|
시장보고서
상품코드
1716692
육상 풍력에너지 시장 기회, 성장 촉진요인, 산업 동향 분석, 예측(2025-2034년)Onshore Wind Energy Market Opportunity, Growth Drivers, Industry Trend Analysis, and Forecast 2025 - 2034 |
||||||
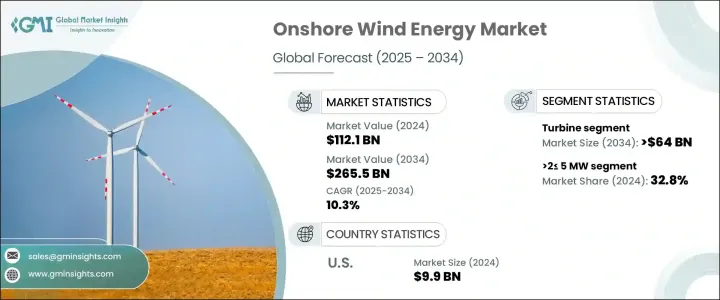
세계 육상 풍력에너지 시장은 2024년 1,121억 달러로 평가되었으며, 2025년부터 2034년까지 연평균 복합 성장률(CAGR) 10.3%로 성장할 것으로 예측됩니다.
이 성장의 주요 요인은 깨끗하고 재생 가능한 에너지원에 대한 수요의 급증과 이산화탄소 배출량의 삭감과 지속 가능한 개발 목표의 지원을 목적으로 한 정부의 이니셔티브입니다. 가장 비용 효율적이고 확장 가능한 솔루션 중 하나로 눈에 띄고 있습니다. 세계 경제가 재생 가능 에너지 목표를 달성하는 데 어려움을 겪고있는 동안, 육상 풍력 발전 프로젝트는 유리한 규제 프레임 워크, 기술 비용 저하 및 최신 풍력 터빈의 효율성 향상으로 기세를 늘리고 있습니다.

정책 입안자는 풍력에너지 개발을 촉진하기 위해 합리화된 허가 프로세스를 도입하고, 세액 공제를 제공하고, 인센티브 프로그램을 전개하고 있으며, 시장 관계자가 포트폴리오를 확대하는데 매우 유리한 환경을 만들어 가고 있습니다. 새로 인해 용량계수가 대폭 개선되고, 평준화에너지 비용(LCOE)이 삭감되고, 육상풍력발전 프로젝트가 보다 경제적으로 실행가능하게 되고 있습니다.
| 시장 범위 | |
|---|---|
| 시작 연도 | 2024년 |
| 예측 연도 | 2025-2034 |
| 시작 금액 | 1,121억 달러 |
| 예측 금액 | 2,655억 달러 |
| CAGR | 10.3% |
연방 및 주 수준의 장려 조치의 꾸준한 구현, 정부의 강력한 의무화, 적극적인 재생 가능 에너지 목표가 육상 풍력에너지 시장의 강력한 성장 촉매로서 작용하고 있습니다. 풍력 자원뿐만 아니라 적극적인 정부 지원과 매력적인 투자 프레임 워크를 제공하는 유망한 시장으로 부상하고 있습니다. 이들 국가는 풍력 에너지 인프라를 확장하기 위한 프로젝트 발표와 외국인 투자가 증가하고 있는 것을 목격하고 있습니다. 송전망 인프라의 근대화를 향한 병행 투자는 풍력 발전의 국가 에너지 시스템에의 통합을 촉진해, 풍력 발전 전력의 신뢰성과 효율을 높이고 있습니다.
육상 풍력에너지 시장은 터빈, 지지 구조, 전기 인프라 등으로 구분되어 터빈이 주요 구성 요소가 되고 있습니다. 터빈 부문만 해도 엄격한 재생 에너지 의무에 부합하는 고용량 효율 터빈에 대한 수요 증가에 힘입어 2034년까지 640억 달러의 수익을 창출할 것으로 예상됩니다. 보다 높은 타워, 보다 긴 블레이드, 고급 그리드 통합 기능 등, 터빈 기술의 진보에 의해 보다 높은 에너지 출력과 다양한 풍황에의 적응성이 가능하게 되어, 육상 풍력 발전 설비는 투자자에게도 전력 회사에 있어서도 매력적인 것이 되고 있습니다.
터빈 정격에서 2MW에서 5MW의 시스템이 2024년 시장 점유율의 32.8%를 차지했는데, 이는 용량, 비용 및 그리드 적합성의 균형이 최적이기 때문입니다. 특정 중간 출력을 필요로 하는 프로젝트에 특히 적합하며, 제어 시스템을 강화하고 고급 소프트웨어를 통합하여 터빈 성능을 향상시키고 에너지 수율을 향상하며 다운타임을 최소화합니다.
북미는 장기적인 연방정부의 인센티브와 풍력발전기술의 비용효과의 진보에 힘입어 2024년 육상 풍력에너지 세계 시장 점유율의 8.6%를 차지했습니다.
목차
제1장 조사 방법과 조사 범위
제2장 주요 요약
제3장 업계 인사이트
- 업계 에코시스템
- 규제 상황
- 업계에 미치는 영향요인
- 성장 촉진요인
- 업계의 잠재적 위험 및 과제
- 성장 가능성 분석
- Porter's Five Forces 분석
- PESTEL 분석
제4장 경쟁 구도
- 소개
- 전략 대시보드
- 혁신과 기술의 전망
제5장 시장 규모와 예측 : 컴포넌트별, 2021년-2034년
- 주요 동향
- 터빈
- 타워
- 블레이드
- 기타
- 지지 구조
- 하부구조
- 파운데이션
- 기타
- 전기 인프라
- 전선 및 케이블
- 변전소
- 기타
- 기타
제6장 시장 규모와 예측 : 터빈 정격별, 2021년-2034년
- 주요 동향
- 2 MW 이하
- 2-5 MW
- 5-8 MW
- 8-10 MW
- 10-12MW
- 12MW 이상
제7장 시장 규모와 예측 : 지역별, 2021-2034년
- 주요 동향
- 북미
- 미국
- 캐나다
- 유럽
- 독일
- 네덜란드
- 스웨덴
- 프랑스
- 영국
- 핀란드
- 폴란드
- 스페인
- 이탈리아
- 오스트리아
- 아일랜드
- 벨기에
- 아시아태평양
- 중국
- 인도
- 일본
- 호주
- 세계 기타 지역
제8장 기업 프로파일
- CRRC
- CSSC Haizhuang Wind Power
- Envision Group
- Goldwind
- GE Vernova
- Iberdrola
- Nordex
- Siemens Gamesa Renewable Energy
- United Power
- Vestas
- Windey Energy Technology Group
The Global Onshore Wind Energy Market was valued at USD 112.1 billion in 2024 and is projected to grow at a CAGR of 10.3% between 2025 and 2034. This growth is largely fueled by a surge in demand for clean, renewable energy sources, combined with government-backed initiatives aimed at reducing carbon emissions and supporting sustainable development goals. Countries worldwide are ramping up efforts to transition away from fossil fuels, and onshore wind energy stands out as one of the most cost-effective and scalable solutions. As economies worldwide face increasing pressure to meet their renewable energy targets, onshore wind projects are gaining momentum, driven by favorable regulatory frameworks, declining technology costs, and improved efficiency of modern wind turbines.
Policymakers are introducing streamlined permitting processes, offering tax credits, and deploying incentive programs to foster wind energy development, creating a highly conducive environment for market players to expand their portfolios. In addition, technological innovations in turbine design and control systems are significantly improving capacity factors and reducing the levelized cost of energy (LCOE), making onshore wind projects more financially viable. As climate goals tighten and energy demand soars, particularly across emerging economies, the global market is on track to witness substantial capacity additions over the next decade.
| Market Scope | |
|---|---|
| Start Year | 2024 |
| Forecast Year | 2025-2034 |
| Start Value | $112.1 Billion |
| Forecast Value | $265.5 Billion |
| CAGR | 10.3% |
The steady implementation of federal and state-level incentives, robust government mandates, and aggressive renewable energy targets are acting as strong growth catalysts for the onshore wind energy market. Rapid urbanization, industrial expansion, and increasing energy consumption, especially in developing regions, are further accelerating the deployment of onshore wind projects. Countries such as Brazil, Mexico, and Argentina are emerging as promising markets, offering not only abundant wind resources but also proactive government support and attractive investment frameworks. These countries are witnessing a growing number of project announcements and foreign investments aimed at expanding their wind energy infrastructure. Parallel investments in modernizing grid infrastructure are facilitating better integration of wind power into national energy systems, enhancing the reliability and efficiency of wind-generated electricity.
The onshore wind energy market is segmented into turbines, support structures, electrical infrastructure, and others, with turbines dominating as the leading component. The turbine segment alone is anticipated to generate USD 64 billion by 2034, propelled by the increasing demand for high-capacity, efficient turbines that align with stringent renewable energy mandates. Advancements in turbine technology, including taller towers, longer blades, and sophisticated grid integration capabilities, are enabling higher energy outputs and greater adaptability to diverse wind conditions, making onshore wind installations more attractive for investors and utilities alike.
In terms of turbine rating, systems ranging from 2 MW to 5 MW held 32.8% of the market share in 2024, owing to their optimal balance between capacity, cost, and grid compatibility. These turbines are particularly favored for projects requiring moderate output with spatial or technical constraints. Enhanced control systems and advanced software integrations are also boosting turbine performance, improving energy yields, and minimizing downtime.
North America accounted for 8.6% of the global onshore wind energy market share in 2024, backed by long-term federal incentives and advancements in wind power technology cost-effectiveness. With continuous policy support and technology improvements, North America remains a pivotal region driving future market growth.
Table of Contents
Chapter 1 Methodology & Scope
- 1.1 Research Design
- 1.2 Base estimates & calculations
- 1.3 Forecast model
- 1.4 Primary research & validation
- 1.4.1 Primary sources
- 1.4.2 Data mining sources
- 1.5 Market Definitions
Chapter 2 Executive Summary
- 2.1 Industry synopsis, 2021 – 2034
Chapter 3 Industry Insights
- 3.1 Industry ecosystem
- 3.2 Regulatory landscape
- 3.3 Industry impact forces
- 3.3.1 Growth drivers
- 3.3.2 Industry pitfalls & challenges
- 3.4 Growth potential analysis
- 3.5 Porter's analysis
- 3.5.1 Bargaining power of suppliers
- 3.5.2 Bargaining power of buyers
- 3.5.3 Threat of new entrants
- 3.5.4 Threat of substitutes
- 3.6 PESTEL analysis
Chapter 4 Competitive landscape, 2024
- 4.1 Introduction
- 4.2 Strategic dashboard
- 4.3 Innovation & technology landscape
Chapter 5 Market Size and Forecast, By Component, 2021 – 2034 (USD Million)
- 5.1 Key trends
- 5.2 Turbine
- 5.2.1 Tower
- 5.2.2 Blades
- 5.2.3 Others
- 5.3 Support structure
- 5.3.1 Substructure steel
- 5.3.2 Foundation
- 5.3.3 Others
- 5.4 Electrical infrastructure
- 5.4.1 Wires & Cables
- 5.4.2 Substation
- 5.4.3 Others
- 5.5 Others
Chapter 6 Market Size and Forecast, By Turbine Rating, 2021 – 2034 (USD Million & MW)
- 6.1 Key trends
- 6.2 ≤ 2 MW
- 6.3 >2≤ 5 MW
- 6.4 >5≤ 8 MW
- 6.5 >8≤10 MW
- 6.6 >10≤ 12 MW
- 6.7 > 12 MW
Chapter 7 Market Size and Forecast, By Region, 2021 – 2034 (USD Million & MW)
- 7.1 Key trends
- 7.2 North America
- 7.2.1 U.S.
- 7.2.2 Canada
- 7.3 Europe
- 7.3.1 Germany
- 7.3.2 Netherlands
- 7.3.3 Sweden
- 7.3.4 France
- 7.3.5 UK
- 7.3.6 Finland
- 7.3.7 Poland
- 7.3.8 Spain
- 7.3.9 Italy
- 7.3.10 Austria
- 7.3.11 Ireland
- 7.3.12 Belgium
- 7.4 Asia Pacific
- 7.4.1 China
- 7.4.2 India
- 7.4.3 Japan
- 7.4.4 Australia
- 7.5 Rest of World
Chapter 8 Company Profiles
- 8.1 CRRC
- 8.2 CSSC Haizhuang Wind Power
- 8.3 Envision Group
- 8.4 Goldwind
- 8.5 GE Vernova
- 8.6 Iberdrola
- 8.7 Nordex
- 8.8 Siemens Gamesa Renewable Energy
- 8.9 United Power
- 8.10 Vestas
- 8.11 Windey Energy Technology Group