|
시장보고서
상품코드
1716725
전기 호이스트 시장 : 기회, 성장 촉진요인, 산업 동향 분석, 예측(2025-2034년)Electric Hoist Market Opportunity, Growth Drivers, Industry Trend Analysis, and Forecast 2025 - 2034 |
||||||
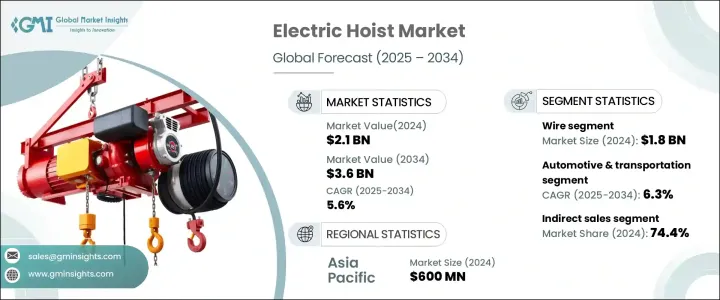
세계의 전기 호이스트 시장은 2024년에 21억 달러로 평가되어 2025년부터 2034년까지 CAGR 5.6%로 확대될 것으로 예측되고 있습니다.
지능적으로 IoT 대응의 전기 호이스트의 채용이 증가하고 있어 실시간 모니터링, 예지 보전, 자동화 시스템을 통합함으로써 자재관리에 혁명을 가져오고 있습니다. 첨단 호이스트는 IoT 센서, AI가 탑재된 툴, 무선 제어를 갖추고 있어 산업계가 성능을 원격 감시하고, 작업 프로세스를 최적화하며, 기기의 고장을 방지할 수 있습니다. 유지 보수가 필요한 전통적인 호이스트와 달리 스마트 호이스트는 실시간 데이터에 따라 마모 초기 징후를 감지하고 가동 중지 시간을 최소화하여 운영 비용을 절감합니다. 센서가 부하 용량, 진동, 시스템 성능을 감시해, 이상이 검출되었을 경우에 운전을 정지하는 것으로, 보다 높은 효율과 작업원의 안전을 확보합니다.

원격 모니터링 및 제어 시스템은 관리자가 어디서나 호이스트의 성능, 부하 상황 및 에너지 소비를 추적할 수 있도록 하여 스마트 호이스트 수요를 더욱 강화합니다. 이러한 시스템은 대규모 시설과 원격지에서 여러 호이스트를 운영하는 산업에 특히 유용합니다. 스마트 호이스트에서 수집한 데이터는 성능 향상, 에너지 사용량 감소, 중요한 작업 자동화에 도움이 되며 현대 산업 환경에 필수적입니다.
| 시장 범위 | |
|---|---|
| 시작 연도 | 2024년 |
| 예측 연도 | 2025-2034년 |
| 시작 금액 | 21억 달러 |
| 예측 금액 | 36억 달러 |
| CAGR | 5.6% |
전기 호이스트 시장은 유형별로 체인 호이스트와 와이어 호이스트로 구분됩니다. 와이어 호이스트는 2024년에 18억 달러의 수익을 올렸고 예측 기간에는 CAGR 5.6%의 성장이 예상됩니다. 와이어 로프 호이스트는 강도, 내구성, 고하중을 다루는 능력으로 시장을 독점하고 있으며, 자동차, 건설, 조선, 항공우주 및 중기계 산업 분야에서 사용하기에 적합합니다. 와이어 로프 호이스트는 체인 호이스트보다 빠르고 효율적이므로 재료를 빠르게 이동할 수 있으므로 생산 가동 중지 시간을 최소화 할 수 있습니다. 와이어 로프 호이스트는 고온, 높은 먼지, 부식성 등 최소한의 유지 보수와 긴 작동 수명이 필요한 환경에서 선호됩니다. 부드럽고 조용한 작동 능력은 직장의 안전과 효율성을 향상시킵니다.
최종 이용 산업에 관해서는 전기 호이스트 시장은 항공우주, 자동차 및 운송, 건설, 에너지, 해양 및 해운, 물류, 자재관리, 석유 및 가스, 농업 등의 분야에 대응하고 있습니다. 전기 호이스트 수요 증가는 자동차 제조, 유지보수, 물류 자동화, 자재관리, 중량물 리프팅에 대한 요구 증가에 기인합니다. 인더스트리 4.0 기술이 IoT 통합형 전기 호이스트의 채용을 촉진하고 있어, 이것은 경량 EV 부품의 핸들링이나 선진 제조 시설의 조립 라인의 자동화에 필수적입니다.
전기 호이스트 시장의 유통 채널은 직접 판매와 간접 판매로 분류됩니다. 간접 채널은 제조업체가 신흥국 시장에 진입하는데 도움이 되고, 거기에서는 현지의 유통업체가 강력한 고객 관계나 지역의 전문 지식을 가지고 있습니다.
아시아태평양은 2024년 세계 전기 호이스트 시장을 선도해 시장 점유율의 약 30.9%를 차지했으며, 약 6억 달러의 매출을 창출하였습니다. 낮은 비용의 노동력과 원재료가 입수 가능하기 때문에 이 지역은 전기 호이스트의 생산과 수출의 허브로서의 지위를 확립하고 있습니다.
목차
제1장 조사 방법과 조사 범위
제2장 주요 요약
제3장 업계 인사이트
- 생태계 분석
- 공급자 상황
- 가격 분석
- 기술과 혁신의 전망
- 주요 뉴스 및 이니셔티브
- 규제 상황
- 제조업체
- 판매자
- 소매업체
- 세력에 대한 영향
- 성장 촉진요인
- 산업 자동화의 상승
- 인프라 개발의 진전
- 안전성과 인체공학의 중시
- 업계의 잠재적 위험 및 과제
- 격렬한 가격 경쟁
- 엄격한 안전 규제
- 성장 촉진요인
- 성장 가능성 분석
- 소비자의 구매행동
- Porter's Five Forces 분석
- PESTEL 분석
제4장 경쟁 구도
- 소개
- 기업 점유율 분석
- 경쟁 포지셔닝 매트릭스
- 전략 전망 매트릭스
제5장 시장 추계 및 예측 : 유형별, 2021-2034년
- 주요 동향
- 체인
- 와이어
제6장 시장 추계 및 예측 : 용량별, 2021-2034년
- 주요 동향
- 0.25-5.0톤
- 5.1-10톤
- 10.1-15톤
- 15.1-20톤
- 20.1-32톤
제7장 시장 추계 및 예측 : 최종 이용 산업별, 2021-2034년
- 주요 동향
- 항공우주
- 자동차 및 운송
- 건설
- 에너지
- 해운
- 운송 및 물류
- 자재관리
- 석유 및 가스
- 농업 및 임업
- 기타
제8장 시장 추계 및 예측 : 용도별, 2021-2034년
- 주요 동향
- 상업회수
- 크레인
- 고정식
- 이동식
- 작업선
- 유틸리티
- 기타
제9장 시장 추계 및 예측 : 유통 채널별, 2021-2034년
- 주요 동향
- 직접
- 간접
제10장 시장 추계 및 예측 : 지역별, 2021-2034년
- 주요 동향
- 북미
- 미국
- 캐나다
- 유럽
- 영국
- 독일
- 프랑스
- 이탈리아
- 스페인
- 러시아
- 아시아태평양
- 중국
- 인도
- 일본
- 호주
- 한국
- 라틴아메리카
- 브라질
- 멕시코
- 아르헨티나
- 중동 및 아프리카
- UAE
- 남아프리카
- 사우디아라비아
제11장 기업 프로파일
- ABUS Cranes
- Columbus McKinnon
- Crosby Group
- Demag Cranes and Components
- Hitachi Industrial Equipment Systems
- IMER International
- Ingersoll Rand
- JASO Industrial Cranes
- KITO
- Konecranes
- Kran Direkt
- Street Crane
- Tianjin Kunda Hoisting Equipment
- Verlinde
- Yale
The Global Electric Hoist Market was valued at USD 2.1 billion in 2024 and is projected to expand at a CAGR of 5.6% from 2025 to 2034. The increasing adoption of intelligent and IoT-enabled electric hoists is revolutionizing material handling by integrating real-time monitoring, predictive maintenance, and automated systems. These advanced hoists come equipped with IoT sensors, AI-powered tools, and wireless controls that allow industries to remotely monitor performance, optimize work processes, and prevent equipment failures. Unlike traditional hoists that require periodic inspections and scheduled maintenance, smart hoists rely on real-time data to detect early signs of wear, minimizing downtime and reducing operational costs. They also enhance workplace safety by mitigating risks such as overload, overheating, and machinery breakdowns. Sensors monitor load capacity, vibrations, and system performance to halt operations when anomalies are detected, ensuring higher efficiency and worker safety.
Remote monitoring and control systems further strengthen the demand for smart hoists by enabling managers to track hoist performance, load conditions, and energy consumption from any location. These systems are particularly beneficial for industries that operate multiple hoists across large facilities or remote sites. The data collected from smart hoists aids in improving performance, reducing energy usage, and automating critical tasks, making them indispensable in modern industrial settings.
| Market Scope | |
|---|---|
| Start Year | 2024 |
| Forecast Year | 2025-2034 |
| Start Value | $2.1 Billion |
| Forecast Value | $3.6 Billion |
| CAGR | 5.6% |
The electric hoist market is segmented by type into chain and wire hoists. Wire hoists generated USD 1.8 billion in revenue in 2024 and are expected to grow at a CAGR of 5.6% over the forecast period. Wire rope hoists dominate the market due to their strength, durability, and ability to handle heavy loads, making them suitable for applications in automotive, construction, shipbuilding, aerospace, and heavy machinery industries. They offer greater speed and efficiency than chain hoists, allowing materials to be moved quickly and minimizing production downtime. Wire rope hoists are preferred in environments that require minimal maintenance and longer operational life, including high-temperature, high-dust, and corrosive settings. Their ability to provide smooth, quiet operation enhances workplace safety and efficiency.
In terms of end-use industries, the electric hoist market caters to sectors such as aerospace, automotive and transportation, construction, energy, marine and shipping, logistics, material handling, oil and gas, and agriculture. The automotive and transportation segment accounted for over 12% of the market in 2024 and is projected to grow at a CAGR of 6.3% until 2034. The increasing demand for electric hoists stems from the growing need for automation, material handling, and heavy lifting in automotive manufacturing, maintenance, and logistics. Industry 4.0 technologies are driving the adoption of electric hoists with IoT integration, which is vital for handling lightweight EV components and automating assembly lines in advanced manufacturing facilities.
Distribution channels in the electric hoist market are categorized as direct and indirect sales. Indirect sales dominated in 2024, accounting for a 74.4% share, due to the extensive network of distributors, dealers, and third-party suppliers that manufacturers utilize to reach a broader customer base without building costly sales systems. Indirect channels help manufacturers penetrate developing markets where local distributors have strong customer relationships and regional expertise. Financing and leasing options provided by dealers also make electric hoists accessible to SME , supporting market expansion.
Asia Pacific led the global electric hoist market in 2024, holding around 30.9% of the market share and generating approximately USD 600 million in revenue. The region's dominance is driven by significant investments in manufacturing, infrastructure, and construction across key countries, leading to higher demand for material handling equipment. The availability of low-cost labor and raw materials contributes to the region's position as a hub for electric hoist production and export. The increasing adoption of automation and the rise of e-commerce in the region is further driving the need for electric hoists, solidifying Asia Pacific's leadership in the global market.
Table of Contents
Chapter 1 Methodology & Scope
- 1.1 Research design
- 1.1.1 Research approach
- 1.1.2 Data collection methods
- 1.2 Base estimates and calculations
- 1.2.1 Base year calculation
- 1.2.2 Key trends for market estimates
- 1.3 Forecast model
- 1.4 Primary research & validation
- 1.4.1 Primary sources
- 1.4.2 Data mining sources
- 1.5 Market definitions
Chapter 2 Executive Summary
- 2.1 Industry synopsis, 2021 - 2034
Chapter 3 Industry Insights
- 3.1 Industry ecosystem analysis
- 3.2 Supplier Landscape
- 3.3 Pricing analysis
- 3.4 Technology & innovation landscape
- 3.5 Key news & initiatives
- 3.6 Regulatory landscape
- 3.7 Manufacturers
- 3.8 Distributors
- 3.9 Retailers
- 3.10 Impact on forces
- 3.10.1 Growth drivers
- 3.10.1.1 Rising industrial automation
- 3.10.1.2 Growing infrastructure development
- 3.10.1.3 Focus on safety and ergonomics
- 3.10.2 Industry pitfalls & challenges
- 3.10.2.1 Intense price competition
- 3.10.2.2 Stringent safety regulations
- 3.10.1 Growth drivers
- 3.11 Growth potential analysis
- 3.12 Consumer buying behavior
- 3.13 Porter's analysis
- 3.14 PESTEL analysis
Chapter 4 Competitive Landscape, 2024
- 4.1 Introduction
- 4.2 Company market share analysis
- 4.3 Competitive positioning matrix
- 4.4 Strategic outlook matrix
Chapter 5 Market Estimates & Forecast, By Type, 2021 - 2034 ($Bn) (Thousand Units)
- 5.1 Key trends
- 5.2 Chain
- 5.3 Wire
Chapter 6 Market Estimates & Forecast, By Capacity (Tons), 2021 - 2034 ($Bn) (Thousand Units)
- 6.1 Key trends
- 6.2 0.25-5.0
- 6.3 5.1-10
- 6.4 10.1-15
- 6.5 15.1-20
- 6.6 20.1-32
Chapter 7 Market Estimates & Forecast, By End Use Industry, 2021 - 2034 ($Bn) (Thousand Units)
- 7.1 Key trends
- 7.2 Aerospace
- 7.3 Automotive & transportation
- 7.4 Construction
- 7.5 Energy
- 7.6 Marine & shipping
- 7.7 Transportation & logistics
- 7.8 Material handling
- 7.9 Oil & gas
- 7.10 Agricultural & forestry
- 7.11 Others
Chapter 8 Market Estimates & Forecast, By Application, 2021 - 2034 ($Bn) (Thousand Units)
- 8.1 Key trends
- 8.2 Commercial recovery
- 8.3 Cranes
- 8.3.1 Fixed
- 8.3.2 Mobile
- 8.4 Workboat
- 8.5 Utility
- 8.6 Others
Chapter 9 Market Estimates & Forecast, By Distribution Channel, 2021 - 2034 ($Bn) (Thousand Units)
- 9.1 Key trends
- 9.2 Direct
- 9.3 Indirect
Chapter 10 Market Estimates & Forecast, By Region, 2021 - 2034 ($Bn) (Thousand Units)
- 10.1 Key trends
- 10.2 North America
- 10.2.1 U.S.
- 10.2.2 Canada
- 10.3 Europe
- 10.3.1 UK
- 10.3.2 Germany
- 10.3.3 France
- 10.3.4 Italy
- 10.3.5 Spain
- 10.3.6 Russia
- 10.4 Asia Pacific
- 10.4.1 China
- 10.4.2 India
- 10.4.3 Japan
- 10.4.4 Australia
- 10.4.5 South Korea
- 10.5 Latin America
- 10.5.1 Brazil
- 10.5.2 Mexico
- 10.5.3 Argentina
- 10.6 MEA
- 10.6.1 UAE
- 10.6.2 South Africa
- 10.6.3 Saudi Arabia
Chapter 11 Company Profiles
- 11.1 ABUS Cranes
- 11.2 Columbus McKinnon
- 11.3 Crosby Group
- 11.4 Demag Cranes and Components
- 11.5 Hitachi Industrial Equipment Systems
- 11.6 IMER International
- 11.7 Ingersoll Rand
- 11.8 JASO Industrial Cranes
- 11.9 KITO
- 11.10 Konecranes
- 11.11 Kran Direkt
- 11.12 Street Crane
- 11.13 Tianjin Kunda Hoisting Equipment
- 11.14 Verlinde
- 11.15 Yale