
|
시장보고서
상품코드
1721491
유리 및 알루미늄 용기 포장 시장 기회, 성장 촉진요인, 산업 동향 분석 및 예측(2025-2034년)Glass and Aluminum Containers Packaging Market Opportunity, Growth Drivers, Industry Trend Analysis, and Forecast 2025 - 2034 |
||||||
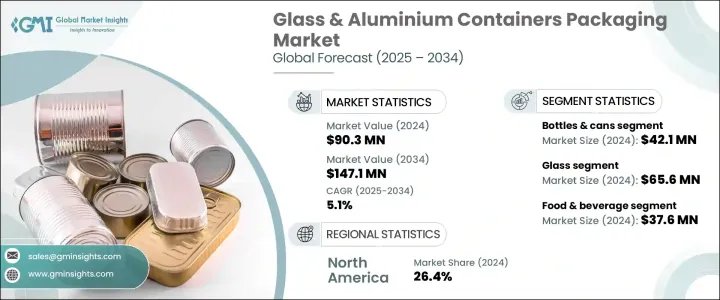
세계의 유리 및 알루미늄 용기 포장 시장은 2024년에 9,030만 달러로 평가되었고 CAGR 5.1%를 나타내 2034년에는 1억 4,710만 달러에 달할 것으로 예측되고 있습니다. 소비자는 더 이상 기능성을 요구하는 것이 아니라 환경에 대한 가치관에 맞는 제품을 적극적으로 선택하게 되어 있습니다. 이러한 행동 변화로 인해 브랜드는 카본 풋 프린트를 삭감하고 순환형 경제를 촉진하는 포장 형태를 우선하게 되어 있습니다. 완전히 리사이클 가능하고 재이용할 수 있는 유리 및 알루미늄은 이 그린 혁명을 리드하고 있습니다.

식음료, 화장품, 의약품 등의 업계는 규정 준수 기준을 충족하기 위해서뿐만 아니라 소비자의 신뢰를 얻기 위해서도 이 전환을 진행하고 있습니다. 미관을 향상시키는 기술 혁신에 의해 유리나 알루미늄의 용기는 고급품에도 일용품에도 선택되게 되어 왔습니다. 생산 기술의 진화에 따라, 제조업체는 보다 강하고, 가볍고, 보다 저렴한 가격으로, 폐기물 제로의 목표에 따른 솔루션을 제공할 수 있게 되었습니다.
| 시장 범위 | |
|---|---|
| 시작 연도 | 2024년 |
| 예측 연도 | 2025-2034년 |
| 시작 금액 | 9,030만 달러 |
| 예측 금액 | 1억 4,710만 달러 |
| CAGR | 5.1% |
트레이와 호일 용기 수요는 꾸준히 증가하고 있으며, 2025년부터 2034년까지의 CAGR은 5.3%를 나타낼 것으로 예측되고 있습니다. 송중에 식품의 신선도를 확실히 유지하는 것과 동시에, 지속가능성의 목표에도 합치하고 있습니다. 동시에, 유리 트레이는 그 전자 레인지 대응 특성과 고급감이 있는 외관으로부터, 고급 포장의 분야에서도 기세를 늘리고 있습니다.
알루미늄 포장 분야에서도 2034년까지의 CAGR은 3.8%를 나타낼 것으로 예상되고 있습니다. 플라스틱 폐기물 삭감을 목표로 하는 세계 정책에 따라 알루미늄으로의 전환이 가속화되고 있습니다.
미국의 유리 및 알루미늄 용기 포장 시장은 2034년까지 3,220만 달러에 달할 것으로 예측되고 있습니다. 이 지역의 금지 조치는 제조업체가 재활용 가능하고 저탄소 포장 형태를 채택하도록 촉구합니다.
Ball Corporation, Verallia, Ardagh Group, Crown Holdings, OI Glass(Owens-Illinois)와 같은 대기업은 녹색기술과 순환경제에 적극적으로 투자하고 있습니다. 이러한 기업들은 생산 역량을 확대하고 재활용 가능한 제품 라인을 도입하며 브랜드와 전략적 협업을 통해 지속 가능한 포장 솔루션을 공동 개발하고 있습니다.
목차
제1장 조사 방법과 범위
제2장 주요 요약
제3장 업계 인사이트
- 생태계 분석
- 업계에 미치는 영향요인
- 성장 촉진요인
- 지속 가능한 포장에 대한 수요 증가
- 엄격한 환경 규제
- 리사이클 기술의 진보
- 성장하는 음료 및 의약품 산업
- 고급감과 미적 매력
- 업계의 잠재적 위험 및 과제
- 높은 생산 비용과 운송 비용
- 파손 가능성과 취급의 문제
- 성장 촉진요인
- 성장 가능성 분석
- 규제 상황
- 기술 환경
- 향후 시장 동향
- 갭 분석
- Porter's Five Forces 분석
- PESTEL 분석
제4장 경쟁 구도
- 서론
- 기업 시장 점유율 분석
- 주요 시장 기업의 경쟁 분석
- 경쟁 포지셔닝 매트릭스
- 전략 대시보드
제5장 시장 추계·예측 : 재료별(2021-2034년)
- 주요 동향
- 유리
- 알루미늄
제6장 시장 추계·예측 : 용기 유형별(2021-2034년)
- 주요 동향
- 병 및 캔
- 자
- 트레이/포일 용기
- 튜브
- 바이알/앰풀
제7장 시장 추계·예측 : 최종 이용 산업별(2021-2034년)
- 주요 동향
- 식품 및 음료
- 퍼스널케어 및 화장품
- 제약
- 산업 및 화학
- 기타
제8장 시장 추계·예측 : 지역별(2021-2034년)
- 주요 동향
- 북미
- 미국
- 캐나다
- 유럽
- 독일
- 영국
- 프랑스
- 스페인
- 이탈리아
- 네덜란드
- 아시아태평양
- 중국
- 인도
- 일본
- 호주
- 한국
- 라틴아메리카
- 브라질
- 멕시코
- 아르헨티나
- 중동 및 아프리카
- 사우디아라비아
- 남아프리카
- 아랍에미리트(UAE)
제9장 기업 프로파일
- OI Glass(Owens-Illinois)
- Ardagh Group
- Verallia
- BA Glass
- Vitro
- Gerresheimer
- Heinz-Glas
- Nihon Yamamura Glass Co.
- Ball Corporation
- Crown Holdings
- Trivium Packaging
- Can-Pack Group
- Toyo Seikan Group
- Silgan Holdings
The Global Glass & Aluminum Containers Packaging Market was valued at USD 90.3 million in 2024 and is estimated to grow at a CAGR of 5.1% to reach at USD 147.1 million by 2034. As sustainability becomes a defining force across industries, the demand for eco-friendly packaging is rapidly accelerating. Consumers are no longer just looking for functionality-they are actively choosing products that align with their environmental values. This behavioral shift is prompting brands to prioritize packaging formats that reduce carbon footprints and foster circular economy practices. Glass and aluminum, being fully recyclable and reusable, are leading this green revolution. The surge in e-commerce heightened focus on health and hygiene, and increasing regulatory pressures against plastic use are further intensifying the shift toward sustainable packaging.
Industries such as food and beverage, cosmetics, and pharmaceuticals are making this transition not only to meet compliance standards but also to earn consumer trust. Brands now view packaging as a strategic asset that communicates their commitment to the planet and drives customer loyalty. With innovations improving cost-efficiency and aesthetics, glass and aluminum containers are becoming the go-to choice for both premium and everyday products. As production technologies evolve, manufacturers are able to offer stronger, lighter, and more affordable solutions that align with zero-waste goals.
| Market Scope | |
|---|---|
| Start Year | 2024 |
| Forecast Year | 2025-2034 |
| Start Value | $90.3 Million |
| Forecast Value | $147.1 Million |
| CAGR | 5.1% |
The demand for trays and foil containers is increasing steadily, with projections indicating a CAGR of 5.3% from 2025 to 2034. Aluminum foil containers are seeing strong uptake across the food delivery and ready-to-eat meal segments, primarily due to their excellent thermal resistance, lightweight structure, and high recyclability. These benefits ensure food remains fresh during storage and transit while aligning with sustainability goals. At the same time, glass trays are gaining momentum in high-end packaging due to their microwave-safe properties and premium look. With consumer preferences shifting toward convenience, hygiene, and eco-consciousness, both formats are expanding into diverse commercial use cases.
The aluminum packaging segment alone is anticipated to witness a CAGR of 3.8% through 2034. Praised for its strength, low weight, and ability to safeguard product integrity by blocking air, moisture, and contaminants, aluminum is becoming a top choice for food, beverage, and pharmaceutical packaging. Global policies aimed at reducing plastic waste are accelerating the shift to aluminum, especially as recycling infrastructure and technologies continue to improve. These advancements enhance aluminum's cost-effectiveness and sustainability across its lifecycle, making it a practical choice for large-scale applications.
The U.S. Glass & Aluminum Containers Packaging Market is forecasted to reach USD 32.2 million by 2034. Growing environmental awareness and policy-driven action against plastic waste are fueling this trend. Federal programs and local bans on single-use plastics are encouraging manufacturers to adopt recyclable, low-carbon packaging formats. Innovations such as thinner yet more durable glass and optimized aluminum recycling processes are helping companies cut emissions and costs while meeting green targets.
Major players, including Ball Corporation, Verallia, Ardagh Group, Crown Holdings, and O-I Glass (Owens-Illinois), are actively investing in green technologies and circular economy initiatives. These companies are scaling up production capabilities, introducing recyclable product lines, and engaging in strategic collaborations with brands to co-develop sustainable packaging solutions. Through automation, waste reduction, and eco-efficient processes, they are setting new benchmarks in next-generation packaging while aligning with evolving regulatory frameworks.
Table of Contents
Chapter 1 Methodology and Scope
- 1.1 Market scope and definitions
- 1.2 Research design
- 1.2.1 Research approach
- 1.2.2 Data collection methods
- 1.3 Base estimates and calculations
- 1.3.1 Base year calculation
- 1.3.2 Key trends for market estimation
- 1.4 Forecast model
- 1.5 Primary research and validation
- 1.5.1 Primary sources
- 1.5.2 Data mining sources
Chapter 2 Executive Summary
- 2.1 Industry 3600 synopsis
Chapter 3 Industry Insights
- 3.1 Industry ecosystem analysis
- 3.2 Industry impact forces
- 3.2.1 Growth drivers
- 3.2.1.1 Rising demand for sustainable packaging
- 3.2.1.2 Stringent environmental regulations
- 3.2.1.3 Advancements in recycling technology
- 3.2.1.4 Growing beverage and pharmaceutical industries
- 3.2.1.5 Premium and aesthetic appeal
- 3.2.2 Industry pitfalls and challenges
- 3.2.2.1 High production and transportation costs
- 3.2.2.2 Breakability and Handling Issues
- 3.2.1 Growth drivers
- 3.3 Growth potential analysis
- 3.4 Regulatory landscape
- 3.5 Technology landscape
- 3.6 Future market trends
- 3.7 Gap analysis
- 3.8 Porter’s analysis
- 3.9 PESTEL analysis
Chapter 4 Competitive Landscape, 2024
- 4.1 Introduction
- 4.2 Company market share analysis
- 4.3 Competitive analysis of major market players
- 4.4 Competitive positioning matrix
- 4.5 Strategy dashboard
Chapter 5 Market Estimates and Forecast, By Material, 2021 – 2034 ($ Mn & million units)
- 5.1 Key trends
- 5.2 Glass
- 5.3 Aluminum
Chapter 6 Market Estimates and Forecast, By Container Type, 2021 – 2034 ($ Mn & million units)
- 6.1 Key trends
- 6.2 Bottles & Cans
- 6.3 Jars
- 6.4 trays/foil containers
- 6.5 tubes
- 6.6 Vials/ampoules
Chapter 7 Market Estimates and Forecast, By End Use Industry, 2021 – 2034 ($ Mn & million units)
- 7.1 Key trends
- 7.2 Food & Beverage
- 7.3 Personal Care & Cosmetics
- 7.4 Pharmaceuticals
- 7.5 Industrial & Chemicals
- 7.6 Others
Chapter 8 Market Estimates and Forecast, By Region, 2021 – 2034 ($ Mn & million units)
- 8.1 Key trends
- 8.2 North America
- 8.2.1 U.S.
- 8.2.2 Canada
- 8.3 Europe
- 8.3.1 Germany
- 8.3.2 UK
- 8.3.3 France
- 8.3.4 Spain
- 8.3.5 Italy
- 8.3.6 Netherlands
- 8.4 Asia Pacific
- 8.4.1 China
- 8.4.2 India
- 8.4.3 Japan
- 8.4.4 Australia
- 8.4.5 South Korea
- 8.5 Latin America
- 8.5.1 Brazil
- 8.5.2 Mexico
- 8.5.3 Argentina
- 8.6 Middle East and Africa
- 8.6.1 Saudi Arabia
- 8.6.2 South Africa
- 8.6.3 UAE
Chapter 9 Company Profiles
- 9.1 O-I Glass (Owens-Illinois)
- 9.2 Ardagh Group
- 9.3 Verallia
- 9.4 BA Glass
- 9.5 Vitro
- 9.6 Gerresheimer
- 9.7 Heinz-Glas
- 9.8 Nihon Yamamura Glass Co.
- 9.9 Ball Corporation
- 9.10 Crown Holdings
- 9.11 Trivium Packaging
- 9.12 Can-Pack Group
- 9.13 Toyo Seikan Group
- 9.14 Silgan Holdings
