


|
시장보고서
상품코드
1740814
스시용 해산물 시장 : 기회, 성장 촉진요인, 산업 동향 분석, 예측(2025-2034년)Sushi Grade Seafood Market Opportunity, Growth Drivers, Industry Trend Analysis, and Forecast 2025 - 2034 |
||||||
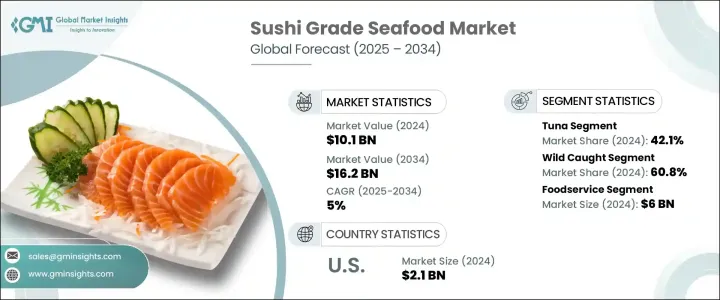
세계의 스시용 해산물 시장은 2024년 101억 달러로 평가되었고, CAGR 5%로 성장하여 2034년까지 162억 달러에 이를 것으로 예측됩니다.
이 눈부신 성장 궤도는 고급스럽고 고품질의 해산물에 대한 세계의 식욕의 고조를 반영하고 있으며, 특히 스시는 다양한 층과 지역에서 인기를 모으고 있습니다. 건강 지향의 고조나 고급 식사 체험에의 욕구와 더불어, 스시용 해산물 수요를 대폭 급증시키고 있습니다. 클린 라벨의 단백질을 요구하는 건강 지향의 소비자에게 있어서의 라이프 스타일의 선택이 되고 있습니다. 엄격한 콜드체인 물류와 온도 관리에 의해 기생충이나 병원균에 의한 리스크를 배제해, 바다에서부터 식탁까지 안전하고 신선한 해산물이 유지됩니다.
세계 시장에서는 소비 습관과 구매 채널 모두에 변화가 일어나고 있습니다. 소비자가 초밥과 원시 해산물 요리에 대한 지식을 깊게 함에 따라 많은 소비자가 자신있게 가정에서 요리하게 되었습니다. 소매업체와 온라인 해산물 플랫폼은 이 동향을 이용하여 전문적인 기준을 충족하는 스시용 해산물을 엄선하여 제공합니다. 고급 레스토랑에서 가정 부엌에 이르기까지, 스시용 해산물은 현재 현대 소비자의 식생활의 주식이며, 특히 고단백, 저지방, 영양이 풍부한 식품을 요구하는 사람들 사이에서 정평이 되고 있습니다. 소셜미디어와 디지털 식문화가 수요를 더욱 부추기며 스시는 음식 블로그, 인플루언서 컨텐츠, 건강한 라이프스타일 동향 등에 크게 등장하고 있습니다. 가정용 밀 키트와 정액제의 해산물 택배 서비스도 시장을 확대해 소비자는 집에 있으면서 레스토랑 품질의 스시를 즐길 수 있게 되었습니다.
| 시장 규모 | |
|---|---|
| 시작 연도 | 2024년 |
| 예측 연도 | 2025-2034년 |
| 시작 금액 | 101억 달러 |
| 예측 금액 | 162억 달러 |
| CAGR | 5% |
미국에서 스시용 어패류는 여전히 뛰어난 카테고리이며, 2024년에는 21억 달러를 창출했으며, 2034년까지 CAGR은 5%로 예측됩니다. 물류의 개선과 전국적인 유통망 덕분에, 스시의 인기는 내륙부에도 확대되고 있습니다.
아시아는 풍부한 음식 전통을 가진 나라들에게 견인되어 생산 대국 및 주요 소비 시장으로서의 우위를 유지하고 있습니다. 영국, 독일, 프랑스 등의 나라에서는 소득의 상승과 음식의 기호의 변화를 배경으로, 이 부문이 2자리 성장을 나타내고 있습니다.
제품 유형별로, 시장은 참치, 새우, 연어 등으로 구분됩니다. 참치는 2024년에 42.1%로 가장 큰 시장 점유율을 차지합니다. 참다랭이와 같은 고지방종이 일류의 스시 메뉴를 독점하고 있는 한편, 지속 가능하고 윤리적으로 조달된 옵션에 대한 수요의 상승이, 생산자를 인증된 환경 배려형의 조달 방법에 향하게 하고 있습니다.
한편, 지속가능하고 윤리적인 조달 방법에 대한 수요가 높아짐에 따라 생산자는 환경에 배려한 인증된 조달 방법을 요구하게 되고 있습니다. 천연 자원이 가까워짐에 따라 안정적인 품질과 공급 수요에 부응하기 위해 양식 선택이 늘어나고 있습니다.
Tassal Group, Grupo Nueva Pescanova, Cermaq, Proximar Seafood, Bakkafrost와 같은 업계의 리더 기업은 그 지위를 확고히 하기 위해 전략적인 단계를 밟고 있습니다. 또, 시장 프레즌스를 확대해, 새로운 소비자층에 리치 하기 위해, 제품 인증을 추구해, 고급 소매점이나 호스피탈리티 브랜드와 전략적 파트너십을 맺고 있는 기업도 많습니다.
목차
제1장 조사 방법과 범위
제2장 주요 요약
제3장 업계 인사이트
- 생태계 분석
- 밸류체인에 영향을 주는 요인
- 이익률 분석
- 혁신
- 미래의 전망
- 제조업자
- 리셀러
- 트럼프 정권에 의한 관세에 대한 영향
- 무역에 미치는 영향
- 무역량의 혼란
- 보복 조치
- 업계에 미치는 영향
- 공급측의 영향(원재료)
- 주요 원재료의 가격 변동
- 공급망 재구성
- 생산 비용에 미치는 영향
- 수요측의 영향(판매가격)
- 최종 시장에의 가격 전달
- 시장 점유율 동향
- 소비자의 반응 패턴
- 공급측의 영향(원재료)
- 영향을 받는 주요 기업
- 전략적인 업계 대응
- 공급망 재구성
- 가격 설정 및 제품 전략
- 정책관여
- 전망과 향후 검토 사항
- 무역에 미치는 영향
- 무역 통계(HS코드)
- 주요 수출국, 2021-2024
- 주요 수입국, 2021-2024
참고: 위의 무역 통계는 주요 국가에 대해서만 제공됩니다.
- 공급자의 상황
- 이익률 분석
- 주요 뉴스와 대처
- 규제 상황
- 영향요인
- 성장 촉진요인
- 세계에서 스시에 대한 수요, 고급 해산물 수요가 상승
- 스시용 해산물은 건강 및 저지방식이와 일치
- E-Commerce와 DIY 키트에 의해 누구나 스시를 즐길 수 있게 되었습니다.
- 업계의 잠재적 위험 및 과제
- 엄격한 품질 관리로 운영의 복잡성 증가
- 환경 제한과 조달 문제에 의해 공급 체인에 부담
- 성장 촉진요인
- 성장 가능성 분석
- Porter's Five Forces 분석
- PESTEL 분석
제4장 경쟁 구도
- 소개
- 기업의 시장 점유율 분석
- 경쟁 포지셔닝 매트릭스
- 전략적 전망 매트릭스
제5장 시장 규모와 예측 : 유형별, 2021-2034년
- 주요 동향
- 참치
- 연어
- 새우
- 기타(낙지, 오징어 등)
제6장 시장 규모와 예측 : 조달별, 2021-2034년
- 주요 동향
- 야생 포획
- 양식
- 기타
제7장 시장 규모와 예측 : 유통채널별, 2021-2034년
- 주요 동향
- 푸드서비스
- 소매
- 직접 판매
제8장 시장 추계 및 예측 : 지역별, 2021-2034년
- 주요 동향
- 북미
- 미국
- 캐나다
- 유럽
- 독일
- 영국
- 프랑스
- 스페인
- 이탈리아
- 네덜란드
- 아시아태평양
- 중국
- 인도
- 일본
- 호주
- 한국
- 라틴아메리카
- 브라질
- 멕시코
- 아르헨티나
- 중동 및 아프리카
- 사우디아라비아
- 남아프리카
- 아랍에미리트(UAE)
제9장 기업 프로파일
- Bakkafrost
- Blue Ocean Mariculture
- Cermaq
- Faroe Islands Salmon Producers
- Grupo Nueva Pescanova
- Ming Hong International
- Mt. Cook Alpine Salmon
- Proximar Seafood
- Seatopia
- Tassal Group
The Global Sushi Grade Seafood Market was valued at USD 10.1 billion in 2024 and is projected to grow at a CAGR of 5% to reach USD 16.2 billion by 2034. This impressive growth trajectory reflects the rising global appetite for premium, high-quality seafood, particularly as sushi continues to gain popularity across diverse demographics and regions. The growing interest in Japanese cuisine, combined with increasing health consciousness and a desire for upscale dining experiences, is driving a significant surge in demand for sushi-grade seafood. These products are not just a culinary trend-they are a lifestyle choice for health-focused consumers seeking nutritious, clean-label proteins. Sushi-grade seafood is held to strict quality, safety, and freshness standards, making it suitable for raw consumption without compromising health. Strict cold chain logistics and temperature controls eliminate risks from parasites and pathogens, ensuring the seafood remains safe and fresh from sea to table.

The global market is experiencing a shift in both consumption habits and purchasing channels. As consumers become more knowledgeable about sushi and raw seafood preparation, many are turning to home preparation with confidence. Retailers and online seafood platforms are capitalizing on this trend, offering curated selections of sushi-grade fish that meet professional standards. From fine dining to home kitchens, sushi-grade seafood is now a staple in the modern consumer's diet, especially among those seeking high-protein, low-fat, and nutrient-rich food options. Social media and digital food culture have further fueled the demand, with sushi appearing prominently in food blogs, influencer content, and healthy lifestyle trends. The accessibility of home meal kits and subscription-based seafood delivery services has also expanded the market, allowing consumers to enjoy restaurant-quality sushi from the comfort of home.
| Market Scope | |
|---|---|
| Start Year | 2024 |
| Forecast Year | 2025-2034 |
| Start Value | $10.1 Billion |
| Forecast Value | $16.2 Billion |
| CAGR | 5% |
In the United States, sushi-grade seafood remains a standout category, generating USD 2.1 billion in 2024 with a steady 5% CAGR projected through 2034. The US market benefits from a strong dining-out culture, but retail sales are gaining momentum as consumers become more comfortable preparing sushi at home. Coastal cities continue to lead in consumption, but sushi's popularity is expanding into inland regions thanks to better logistics and nationwide distribution networks. Online seafood retailers and specialty grocers are key players in this evolution, offering fresh, high-quality seafood with full traceability and certification, appealing to environmentally and health-conscious buyers.
Asia maintains its dominance as a production powerhouse and major consumer market, led by countries with rich culinary traditions. However, Europe is quickly catching up, with an increasing number of sushi restaurants and high-end supermarkets introducing sushi-grade offerings to a broader consumer base. Countries like the UK, Germany, and France are seeing double-digit growth in this segment, driven by rising incomes and changing food preferences.
By product type, the market is segmented into tuna, shrimp, salmon, and others. Tuna holds the largest market share at 42.1% in 2024. Known for its velvety texture, rich flavor, and premium positioning, tuna remains the preferred choice for sushi lovers, especially in fine dining establishments. High-fat varieties like bluefin tuna dominate top-tier sushi menus, while the growing demand for sustainable and ethically sourced options is pushing producers toward certified, eco-conscious sourcing practices.
When it comes to sourcing methods, wild-caught seafood leads the market with a 60.8% share, driven by consumer perceptions of superior taste and higher nutritional value. However, as global regulations tighten and natural resources face strain, farm-raised options are stepping in to meet consistent quality and supply demands. Aquaculture systems are becoming more advanced, offering high-quality tuna, salmon, and shrimp that align with safety standards, traceability, and sustainability goals.
Industry leaders such as Tassal Group, Grupo Nueva Pescanova, Cermaq, Proximar Seafood, and Bakkafrost are taking strategic steps to solidify their positions. These companies are heavily investing in sustainable aquaculture technologies, expanding digital sales platforms, and developing eco-friendly, traceable supply chains. Many are also pursuing product certifications and forming strategic partnerships with premium retail and hospitality brands to broaden their market presence and reach new consumer segments.
Table of Contents
Chapter 1 Methodology & Scope
- 1.1 Market scope & definition
- 1.2 Base estimates & calculations
- 1.3 Forecast calculation
- 1.4 Data sources
- 1.4.1 Primary
- 1.4.2 Secondary
- 1.4.2.1 Paid sources
- 1.4.2.2 Public sources
- 1.5 Primary research and validation
- 1.5.1 Primary sources
- 1.5.2 Data mining sources
Chapter 2 Executive Summary
- 2.1 Industry synopsis, 2021-2034
Chapter 3 Industry Insights
- 3.1 Industry ecosystem analysis
- 3.1.1 Factor affecting the value chain
- 3.1.2 Profit margin analysis
- 3.1.3 Disruptions
- 3.1.4 Future outlook
- 3.1.5 Manufacturers
- 3.1.6 Distributors
- 3.2 Trump administration tariffs
- 3.2.1 Impact on trade
- 3.2.1.1 Trade volume disruptions
- 3.2.1.2 Retaliatory measures
- 3.2.2 Impact on the industry
- 3.2.2.1 Supply-side impact (raw materials)
- 3.2.2.1.1 Price volatility in key materials
- 3.2.2.1.2 Supply chain restructuring
- 3.2.2.1.3 Production cost implications
- 3.2.2.2 Demand-side impact (selling price)
- 3.2.2.2.1 Price transmission to end markets
- 3.2.2.2.2 Market share dynamics
- 3.2.2.2.3 Consumer response patterns
- 3.2.2.1 Supply-side impact (raw materials)
- 3.2.3 Key companies impacted
- 3.2.4 Strategic industry responses
- 3.2.4.1 Supply chain reconfiguration
- 3.2.4.2 Pricing and product strategies
- 3.2.4.3 Policy engagement
- 3.2.5 Outlook and future considerations
- 3.2.1 Impact on trade
- 3.3 Trade statistics (HS Code)
- 3.3.1 Major exporting countries, 2021-2024 (Kilo Tons)
- 3.3.2 Major importing countries, 2021-2024 (Kilo Tons)
Note: the above trade statistics will be provided for key countries only.
- 3.4 Supplier landscape
- 3.5 Profit margin analysis
- 3.6 Key news & initiatives
- 3.7 Regulatory landscape
- 3.8 Impact forces
- 3.8.1 Growth drivers
- 3.8.1.1 Global appetite for sushi fuels demand for premium seafood.
- 3.8.1.2 Sushi grade seafood aligns with wellness and low-fat diets.
- 3.8.1.3 E-commerce and DIY kits make sushi accessible to all.
- 3.8.2 Industry pitfalls & challenges
- 3.8.2.1 Stringent quality controls drive up operational complexity.
- 3.8.2.2 Environmental limits and sourcing issues strain supply chains.
- 3.8.1 Growth drivers
- 3.9 Growth potential analysis
- 3.10 Porter's analysis
- 3.11 PESTEL analysis
Chapter 4 Competitive Landscape, 2024
- 4.1 Introduction
- 4.2 Company market share analysis
- 4.3 Competitive positioning matrix
- 4.4 Strategic outlook matrix
Chapter 5 Market Size and Forecast, By Type, 2021 – 2034 (USD Billion, Kilo Tons)
- 5.1 Key trends
- 5.2 Tuna
- 5.3 Salmon
- 5.4 Shrimp
- 5.5 Others (octopus, squid, etc.)
Chapter 6 Market Size and Forecast, By Sourcing, 2021 – 2034 (USD Billion, Kilo Tons)
- 6.1 Key trends
- 6.2 Wild caught
- 6.3 Farmed
- 6.4 Others
Chapter 7 Market Size and Forecast, By Distribution Channel, 2021 – 2034 (USD Billion, Kilo Tons)
- 7.1 Key trends
- 7.2 Foodservice
- 7.3 Retail
- 7.4 Direct sales
Chapter 8 Market Estimates and Forecast, By Region, 2021 – 2034 (USD Billion) (Kilo Tons)
- 8.1 Key trends
- 8.2 North America
- 8.2.1 U.S.
- 8.2.2 Canada
- 8.3 Europe
- 8.3.1 Germany
- 8.3.2 UK
- 8.3.3 France
- 8.3.4 Spain
- 8.3.5 Italy
- 8.3.6 Netherlands
- 8.4 Asia Pacific
- 8.4.1 China
- 8.4.2 India
- 8.4.3 Japan
- 8.4.4 Australia
- 8.4.5 South Korea
- 8.5 Latin America
- 8.5.1 Brazil
- 8.5.2 Mexico
- 8.5.3 Argentina
- 8.6 Middle East and Africa
- 8.6.1 Saudi Arabia
- 8.6.2 South Africa
- 8.6.3 UAE
Chapter 9 Company Profiles
- 9.1 Bakkafrost
- 9.2 Blue Ocean Mariculture
- 9.3 Cermaq
- 9.4 Faroe Islands Salmon Producers
- 9.5 Grupo Nueva Pescanova
- 9.6 Ming Hong International
- 9.7 Mt. Cook Alpine Salmon
- 9.8 Proximar Seafood
- 9.9 Seatopia
- 9.10 Tassal Group
(주말 및 공휴일 제외)
