|
시장보고서
상품코드
1740846
지속가능한 제조 장비 시장 기회, 성장 촉진요인, 산업 동향 분석 및 예측(2025-2034년)Sustainable Manufacturing Equipment Market Opportunity, Growth Drivers, Industry Trend Analysis, and Forecast 2025 - 2034 |
||||||
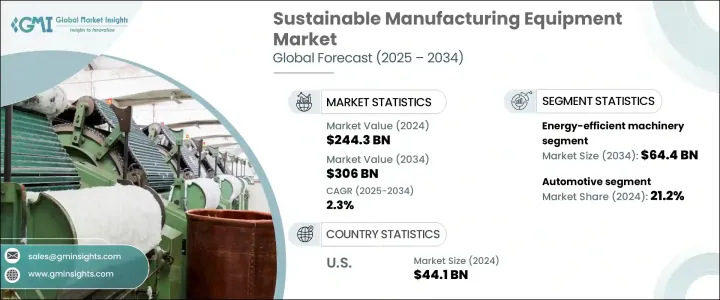
세계의 지속가능한 제조 장비 시장 규모는 2024년에 2,443억 달러에 달했고, CAGR 2.3%를 나타내 2034년에는 3,060억 달러에 이를 것으로 예측됩니다.
환경에 대한 관심 증가와 이산화탄소 배출량 감소에 대한 기업의 헌신 증가는 제조업체에게 환경 친화적인 생산 기술을 채택하도록 장려합니다. 이익성을 높이기 위해 지속가능한 장비로 적극적으로 시프트하고 있습니다. 이를 달성하기 위해 제조업체는 제품 설계 전략을 검토하고 긴 수명, 분해 용이성 및 재활용성을 우선합니다. 한편 재사용과 재활용 재료를 통해 새로운 수익의 길을 만들어내는 것입니다.
세계 정부는 유리한 법률, 세액공제, 자금제공 프로그램을 통해 이 전환을 지원하고 있습니다. 제도에의 준거를 유지해, 새로운 시장 기회를 개척하는 데 있어서 유리한 입장에 있습니다. 장비 제조업체도, 수요가 높아지고 있습니다.
| 시장 범위 | |
|---|---|
| 시작 연도 | 2024년 |
| 예측 연도 | 2025-2034년 |
| 시작 금액 | 2,443억 달러 |
| 예측 금액 | 3,060억 달러 |
| CAGR | 2.3% |
다양한 장비 유형 중에서 에너지 효율적인 기계는 2024년에 572억 달러의 수익으로 시장을 선도했고 2034년에는 644억 달러로 성장할 것으로 예측됩니다. 에너지 효율적인 시스템이 널리 사용되고 있으며 운영 비용을 절감할 수 있다는 점이 이 범주가 시장 전체에서 가장 돌출하고 있습니다. 기업은 광열비를 측정할 수 있는 절약을 실현하는 업그레이드된 기계에 투자하고 있습니다. 이러한 투자는 에너지 비용과 생산성에 직접 영향을 미치기 때문에 일반적으로 저위험 하이 리턴의 결정으로 간주됩니다.
지속가능한 제조 장비 시장은 최종 사용자 산업별로 부문화되어 있어 2024년에는 자동차산업이 매출액 519억 달러로 최대 공헌자로 부상해 시장 점유율 전체의 약 21.2%를 획득했습니다. 이 업계는 배출량의 삭감과 공급 체인의 합리화라는 큰 압박에 직면하고 있으며, 보다 책임 있는 제조 관행을 지원하는 기술에 중점적인 투자를 촉구하고 있습니다.
지역별 분석에서 미국은 2024년 지속가능한 제조 장비 시장의 441억 달러를 차지했으며, 2025년부터 2034년까지의 CAGR은 1.6%를 나타낼 것으로 예상되고 있습니다. 정부가 주도하는 이니셔티브와 인센티브 프로그램을 이용할 수 있는 것도 기업이 보다 깨끗한 기술로 이행하는 것을 더욱 뒷받침하고 있습니다.
지속가능한 제조 장비 분야의 주요 기업은 ABB Ltd. 3D Systems Corporation, Atlas Copco AB, Emerson Electric Co. Bosch Rexroth AG, FANUC Corporation, Honeywell International Inc. General Electric(GE) Company, Mitsubishi Electric Corporation, Schneider Electric SEmens, Environment SA, Tetra Pak International SA, 야스카와전기 주식회사 등이 있습니다.
목차
제1장 조사 방법과 범위
제2장 주요 요약
제3장 업계 인사이트
- 생태계 분석
- 밸류체인에 영향을 주는 요인
- 이익률 분석
- 파괴적 혁신
- 향후 전망
- 제조업체
- 유통업체
- 트럼프 정권의 관세 분석
- 무역에 미치는 영향
- 무역량의 혼란
- 보복 조치
- 업계에 미치는 영향
- 공급측의 영향(원재료)
- 주요 원재료의 가격 변동
- 공급망 재구성
- 생산 비용에 미치는 영향
- 수요측의 영향(판매가격)
- 최종 시장에의 가격 전달
- 시장 점유율 동향
- 소비자의 반응 패턴
- 공급측의 영향(원재료)
- 영향을 받는 주요 기업
- 전략적 업계 대응
- 공급망 재구성
- 가격 설정 및 제품 전략
- 정책관여
- 전망과 향후 검토 사항
- 무역에 미치는 영향
- 공급자의 상황
- 기술 개요
- 주요 뉴스와 대처
- 규제 상황
- 영향요인
- 성장 촉진요인
- 넷 제로 배출에의 기업의 헌신
- 순환형 경제 원칙의 채용
- 정부의 규제와 인센티브
- 업계의 잠재적 위험 및 과제
- 높은 초기 투자 비용
- 규제 규정 준수의 복잡성
- 성장 촉진요인
- 성장 가능성 분석
- Porter's Five Forces 분석
- PESTEL 분석
제4장 경쟁 구도
- 서론
- 기업의 시장 점유율 분석
- 경쟁 포지셔닝 매트릭스
- 전략적 전망 매트릭스
제5장 시장 추계·예측 : 장비 유형별(2021-2034년)
- 주요 동향
- 에너지 효율이 높은 기계
- 폐기물 관리 장비
- 물 및 폐수 처리 장비
- 탄소 배출 제어 시스템
- 신재생에너지 통합 장비
- 스마트 제조 및 감시 장비
- 지속가능한 포장 장비
- 적층 제조 장비
- 기타(재료 회수 시스템 등)
제6장 시장 추계·예측 : 최종 이용 산업별(2021-2034년)
- 주요 동향
- 자동차
- 일렉트로닉스 및 반도체
- 식품 및 음료
- 화학제조
- 의약품
- 금속 및 광업
- 소비재
- 기타(섬유 제조 등)
제7장 시장 추계·예측 : 최종 용도별(2021-2034년)
- 주요 동향
- 대기업
- 중소기업
- 정부 및 연구기관
- 지속가능한 제조업의 스타트업
제8장 시장 추계·예측 : 유통 채널별(2021-2034년)
- 주요 동향
- 직접
- 간접
제9장 시장 추계·예측 : 지역별(2021-2034년)
- 주요 동향
- 북미
- 미국
- 캐나다
- 유럽
- 독일
- 영국
- 프랑스
- 이탈리아
- 스페인
- 아시아태평양
- 중국
- 인도
- 일본
- 한국
- 호주
- 라틴아메리카
- 브라질
- 멕시코
- 아르헨티나
- 중동 및 아프리카
- 아랍에미리트(UAE)
- 사우디아라비아
- 남아프리카
제10장 기업 프로파일
- 3D Systems Corporation
- ABB Ltd.
- Atlas Copco AB
- Bosch Rexroth AG
- Emerson Electric Co.
- FANUC Corporation
- General Electric(GE) Company
- Honeywell International Inc.
- Mitsubishi Electric Corporation
- Rockwell Automation, Inc.
- Schneider Electric SE
- Siemens AG
- Tetra Pak International SA
- Veolia Environment SA
- Yaskawa Electric Corporation
The Global Sustainable Manufacturing Equipment Market was valued at USD 244.3 billion in 2024 and is estimated to grow at a CAGR of 2.3% to reach USD 306 billion by 2034. Growing environmental concerns and increasing corporate commitments to reduce carbon emissions are pushing manufacturers to adopt eco-friendly production technologies. Companies are actively shifting toward sustainable equipment to align with climate targets and improve long-term profitability. A major driver behind this trend is the transition to circular production systems, which emphasize efficient resource use and reduced waste generation. To achieve this, manufacturers are overhauling product design strategies to prioritize longevity, ease of disassembly, and recyclability-requiring specialized equipment to support such changes. This transformation is not just about reducing environmental impact; it also creates new avenues for revenue through reuse and recycled materials while cutting down on raw material expenses. As a result, integrating sustainable manufacturing practices has become a strategic move rather than a regulatory obligation.
Governments around the world are supporting this shift through favorable legislation, tax credits, and funding programs. These initiatives are designed to accelerate the transition to cleaner manufacturing by reducing the financial barriers to adopting new technologies. In this evolving landscape, companies that invest in sustainable equipment are better positioned to stay compliant with emerging regulations and tap into new market opportunities. Equipment manufacturers are also experiencing heightened demand, as businesses seek technologies that can meet efficiency standards while driving operational performance. This growing interest in environmentally sound solutions is fostering a competitive and innovation-driven market atmosphere.
| Market Scope | |
|---|---|
| Start Year | 2024 |
| Forecast Year | 2025-2034 |
| Start Value | $244.3 Billion |
| Forecast Value | $306 Billion |
| CAGR | 2.3% |
Among various equipment types, energy-efficient machinery led the market with a revenue of USD 57.2 billion in 2024 and is anticipated to grow to USD 64.4 billion by 2034. The widespread use of energy-efficient systems across multiple industries, combined with their ability to lower operating costs, makes this category the most prominent in the overall market. Businesses looking to reduce power consumption and operational inefficiencies are investing in upgraded machines that deliver measurable savings on utilities. These investments are typically seen as low-risk, high-reward decisions due to their direct impact on energy bills and productivity. Moreover, many of these systems qualify for financial support, making the initial cost of adoption more manageable and attractive to a wider range of companies.
The sustainable manufacturing equipment market is segmented by end-user industry, and in 2024, the automotive sector emerged as the largest contributor with USD 51.9 billion in revenue, capturing approximately 21.2% of the total market share. The automotive industry's focus on clean production processes and energy conservation has made it a frontrunner in adopting sustainable equipment. The sector faces considerable pressure to reduce emissions and streamline its supply chains, prompting heavy investment in technologies that support more responsible manufacturing practices. By implementing energy-saving systems and emission-reduction tools, automakers are striving to meet sustainability goals and maintain competitiveness in an evolving marketplace.
In regional analysis, the United States accounted for USD 44.1 billion of the sustainable manufacturing equipment market in 2024 and is expected to register a CAGR of 1.6% from 2025 to 2034. The country's strong industrial ecosystem and commitment to innovation in green technology position it as a key player in this space. American manufacturers are leading the way in adopting sustainable production tools, driven by both regulatory pressure and corporate responsibility frameworks. The availability of government-led initiatives and incentive programs has further encouraged companies to transition toward cleaner technologies. These efforts are supported by a dense network of equipment providers and technology firms operating within the country, allowing faster integration of cutting-edge solutions.
Key companies in the sustainable manufacturing equipment space include ABB Ltd., 3D Systems Corporation, Atlas Copco AB, Emerson Electric Co., Bosch Rexroth AG, FANUC Corporation, Honeywell International Inc., General Electric (GE) Company, Mitsubishi Electric Corporation, Schneider Electric SE, Rockwell Automation, Inc., Siemens AG, Veolia Environment S.A., Tetra Pak International S.A., and Yaskawa Electric Corporation. These players are actively investing in R&D and expanding their offerings to meet the growing demand for sustainable and efficient manufacturing solutions.
Table of Contents
Chapter 1 Methodology & Scope
- 1.1 Market scope & definition
- 1.2 Base estimates & calculations
- 1.3 Forecast parameters
- 1.4 Data sources
- 1.4.1 Primary
- 1.4.2 Secondary
- 1.4.2.1 Paid sources
- 1.4.2.2 Public sources
Chapter 2 Executive Summary
- 2.1 Industry 3600 synopsis, 2021 - 2034
Chapter 3 Industry Insights
- 3.1 Industry ecosystem analysis
- 3.1.1 Factor affecting the value chain
- 3.1.2 Profit margin analysis
- 3.1.3 Disruptions
- 3.1.4 Future outlook
- 3.1.5 Manufacturers
- 3.1.6 Distributors
- 3.2 Trump Administration Tariffs Analysis
- 3.2.1 Impact on Trade
- 3.2.1.1 Trade Volume Disruptions
- 3.2.1.2 Retaliatory Measures
- 3.2.2 Impact on the Industry
- 3.2.2.1 Supply-Side Impact (Raw Materials)
- 3.2.2.1.1 Price Volatility in Key Materials
- 3.2.2.1.2 Supply Chain Restructuring
- 3.2.2.1.3 Production Cost Implications
- 3.2.2.2 Demand-Side Impact (Selling Price)
- 3.2.2.2.1 Price Transmission to End Markets
- 3.2.2.2.2 Market Share Dynamics
- 3.2.2.2.3 Consumer Response Patterns
- 3.2.2.1 Supply-Side Impact (Raw Materials)
- 3.2.3 Key Companies Impacted
- 3.2.4 Strategic Industry Responses
- 3.2.4.1 Supply Chain Reconfiguration
- 3.2.4.2 Pricing and Product Strategies
- 3.2.4.3 Policy Engagement
- 3.2.5 Outlook and Future Considerations
- 3.2.1 Impact on Trade
- 3.3 Supplier landscape
- 3.4 Technological overview
- 3.5 Key news & initiatives
- 3.6 Regulatory landscape
- 3.7 Impact forces
- 3.7.1 Growth drivers
- 3.7.1.1 Corporate Commitments to Net-Zero Emissions
- 3.7.1.2 Adoption of Circular Economy Principles
- 3.7.1.3 Government Regulations and Incentives
- 3.7.2 Industry pitfalls & challenges
- 3.7.2.1 High Initial Investment Costs
- 3.7.2.2 Complexity of Regulatory Compliance
- 3.7.1 Growth drivers
- 3.8 Growth potential analysis
- 3.9 Porter's analysis
- 3.10 PESTEL analysis
Chapter 4 Competitive Landscape, 2024
- 4.1 Introduction
- 4.2 Company market share analysis
- 4.3 Competitive positioning matrix
- 4.4 Strategic outlook matrix
Chapter 5 Market Estimates & Forecast, By Equipment Type, 2021 - 2034 (USD Billion) (Thousand Units)
- 5.1 Key Trends
- 5.2 Energy-efficient Machinery
- 5.3 Waste Management Equipment
- 5.4 Water & Wastewater Treatment Equipment
- 5.5 Carbon Emission Control Systems
- 5.6 Renewable Energy Integration Equipment
- 5.7 Smart Manufacturing & Monitoring Equipment
- 5.8 Sustainable Packaging Equipment
- 5.9 Additive Manufacturing Equipment
- 5.10 Others (Material Recovery Systems, etc.)
Chapter 6 Market Estimates & Forecast, By End Use Industry, 2021 - 2034 (USD Billion) (Thousand Units)
- 6.1 Key trends
- 6.2 Automotive
- 6.3 Electronics and Semiconductor
- 6.4 Food and Beverage
- 6.5 Chemical Manufacturing
- 6.6 Pharmaceuticals
- 6.7 Metals and Mining
- 6.8 Consumer Goods
- 6.9 Others (Textile Manufacturing, etc.)
Chapter 7 Market Estimates & Forecast, By End Use, 2021 - 2034, (USD Billion) (Thousand Units)
- 7.1 Key trends
- 7.2 Large Enterprises
- 7.3 Small & Medium Enterprises (SMEs)
- 7.4 Government & Research Institutes
- 7.5 Sustainable Manufacturing Startups
Chapter 8 Market Estimates & Forecast, By Distribution Channel, 2021 - 2034, (USD Billion) (Thousand Units)
- 8.1 Key trends
- 8.2 Direct
- 8.3 Indirect
Chapter 9 Market Estimates & Forecast, By Region, 2021 - 2034, (USD Billion) (Thousand Units)
- 9.1 Key trends
- 9.2 North America
- 9.2.1 U.S.
- 9.2.2 Canada
- 9.3 Europe
- 9.3.1 Germany
- 9.3.2 U.K.
- 9.3.3 France
- 9.3.4 Italy
- 9.3.5 Spain
- 9.4 Asia Pacific
- 9.4.1 China
- 9.4.2 India
- 9.4.3 Japan
- 9.4.4 South Korea
- 9.4.5 Australia
- 9.5 Latin America
- 9.5.1 Brazil
- 9.5.2 Mexico
- 9.5.3 Argentina
- 9.6 MEA
- 9.6.1 UAE
- 9.6.2 Saudi Arabia
- 9.6.3 South Africa
Chapter 10 Company Profiles (Business Overview, Financial Data, Product Landscape, Strategic Outlook, SWOT Analysis)
- 10.1 3D Systems Corporation
- 10.2 ABB Ltd.
- 10.3 Atlas Copco AB
- 10.4 Bosch Rexroth AG
- 10.5 Emerson Electric Co.
- 10.6 FANUC Corporation
- 10.7 General Electric (GE) Company
- 10.8 Honeywell International Inc.
- 10.9 Mitsubishi Electric Corporation
- 10.10 Rockwell Automation, Inc.
- 10.11 Schneider Electric SE
- 10.12 Siemens AG
- 10.13 Tetra Pak International S.A.
- 10.14 Veolia Environment S.A.
- 10.15 Yaskawa Electric Corporation