
|
시장보고서
상품코드
1740849
스타터 비료 시장 기회, 성장 촉진요인, 산업 동향 분석 및 예측(2025-2034년)Starter Fertilizers Market Opportunity, Growth Drivers, Industry Trend Analysis, and Forecast 2025 - 2034 |
||||||
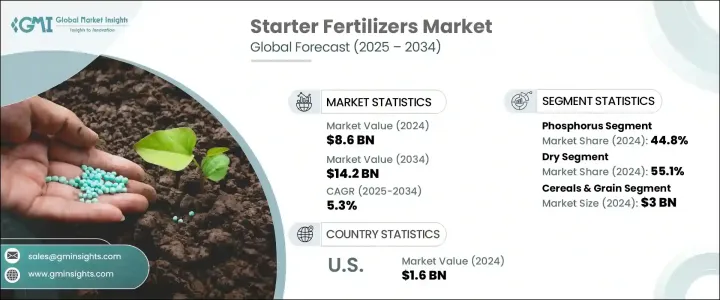
세계의 스타터 비료 시장 규모는 2024년에는 86억 달러로 평가되었고, 현대적인 농법에의 의존도가 높아져, 식물의 초기 발육을 극대화하는 것이 중시되게 된 것을 배경으로, CAGR 5.3%를 나타내 2034년에는 142억 달러에 이를 것으로 예측되고 있습니다.
스타터 비료는 농가가 초기 식물의 건전성을 높이고 전반적인 수율을 극대화하는 효율적이고 지속 가능한 방법을 찾고 있기 때문에 세계 작물 생산 시스템에서 필수적인 요소가 되고 있습니다. 또한 인구 증가, 식물성 식품에 대한 식생활 기호의 변화, 농업 환경 부하의 감소를 위한 세계의 움직임에 의해 수요는 더욱 강해지고 있습니다. 디지털 농업 기술, GPS 지원 재배 시스템 및 토양 분석 도구에 대한 투자 증가는 스타터 비료의 매력을 더욱 향상시키고 있으며, 특히 기술에 익숙한 생산자들 사이에서 목표를 달성 한 영양 솔루션을 찾고 있습니다.
스타터 비료는 질소, 인, 칼륨, 미량 영양소 등의 필수 영양소를 이식시에 직접 공급하도록 설계되어 뿌리의 생장과 모종의 초기 활력을 촉진합니다. 생산자는 첫날부터 최적의 영양소를 이용할 수 있도록 이러한 제제에 주목하고 있습니다.
| 시장 범위 | |
|---|---|
| 시작 연도 | 2024년 |
| 예측 연도 | 2025-2034년 |
| 시작 금액 | 86억 달러 |
| 예측 금액 | 142억 달러 |
| CAGR | 5.3% |
스타터 비료는 보통 심기에 씨앗 근처에 살포되어 곡물, 콩, 야채 등의 작물에서 가장 일반적으로 사용되고 있습니다. 근래, 액체 유형의 스타터 비료는 살포가 간단하고 영양분이 빨리 이용할 수 있기 때문에 채용이 증가하고 있습니다. 농기구와의 적합성 등에서 여전히 건식제제가 세계 시장을 선도하고 있습니다.
주요 양분 부문 중에서 인은 2024년 시장 점유율 44.8%을 차지했으며, 2034년까지의 CAGR은 5.1%를 나타낼 것으로 예측되고 있습니다.에서 중심적인 역할을 합니다. 심기시에 인을 효율적으로 시용하면, 모종이 보다 빨리 균일하게 정착하는 것을 돕고, 그 결과, 작물이 보다 강하게 건강하게 됩니다.
형태별로는 2024년 시장 점유율은 건조제가 55.1%를 차지했고 CAGR은 5.3%를 나타낼 것으로 예측됩니다. 영양농도가 높고 배합의 자유도가 높기 때문에 대규모 농가에서 특히 인기가 있습니다. 이러한 건조비료는 토양 검사 데이터에 근거해 시비량을 미조정할 수 있기 때문에 작물 특유의 양분 수요를 보다 정확하고 비용 효율적으로 만족시킬 수 있습니다.
미국의 스타터 비료 시장은 2024년에 16억 달러를 창출했고 2034년까지 연평균 복합 성장률(CAGR) 5%를 나타낼 것으로 예측됩니다. 이 성장을 지원하는 것은 옥수수, 콩, 밀 등의 고수량 작물의 대규모 생산이며, 스타터 비료는 발아와 초기 발근을 촉진하는데 중요한 역할을 재생합니다. GPS 가이드 플랜터와 가변 속도 비료 살포를 포함한 정밀 농업과 스마트 농업 기술의 상승은 미국 농지에서 이러한 투입물의 채택을 더욱 가속화하고 있습니다.
Syngenta, UPL, CF Industries, Yara, Nufarm Agri Solution과 같은 스타터 비료 업계의 선도 기업들은 선진 영양 기술에 적극적으로 투자하고 생산 능력을 확대하고 있습니다. 이를 통해 디지털 농업 도구를 제품에 통합하고 있으며 생산자 교육 및 제품 교육 프로그램을 지원하여 도입률을 높이고 다양한 토양 및 기후 조건에서 최적의 제품 성능을 발휘할 수 있습니다.
목차
제1장 조사 방법과 범위
제2장 주요 요약
제3장 업계 인사이트
- 생태계 분석
- 밸류체인에 영향을 주는 요인
- 이익률 분석
- 파괴적 혁신
- 향후 전망
- 제조업체
- 유통업체
- 트럼프 정권에 의한 관세에 대한 영향
- 무역에 미치는 영향
- 무역량의 혼란
- 보복 조치
- 업계에 미치는 영향
- 공급측의 영향(원재료)
- 주요 원재료의 가격 변동
- 공급망 재구성
- 생산 비용에 미치는 영향
- 수요측의 영향(판매가격)
- 최종 시장에의 가격 전달
- 시장 점유율 동향
- 소비자의 반응 패턴
- 공급측의 영향(원재료)
- 영향을 받는 주요 기업
- 전략적인 업계 대응
- 공급망 재구성
- 가격 설정 및 제품 전략
- 정책관여
- 전망과 향후 검토 사항
- 무역에 미치는 영향
- 무역 통계(HS코드)
- 주요 수출국(2021-2024년)
- 주요 수입국(2021-2024년)
참고 : 위의 무역 통계는 주요 국가에 대해서만 제공됩니다.
- 공급자의 상황
- 이익률 분석
- 주요 뉴스와 대처
- 규제 상황
- 영향요인
- 성장 촉진요인
- 높은 작물 수율과 조기 식물의 활력에 대한 수요 증가
- 정밀농업과 효율적인 영양관리 도입
- 경작지의 축소가 수량 최적화를 추진
- 업계의 잠재적 위험 및 과제
- 정밀 용도 기기에 대한 고액의 초기 투자
- 규제상의 과제와 규정 준수의 문제
- 성장 촉진요인
- 성장 가능성 분석
- Porter's Five Forces 분석
- PESTEL 분석
제4장 경쟁 구도
- 서론
- 기업의 시장 점유율 분석
- 경쟁 포지셔닝 매트릭스
- 전략적 전망 매트릭스
제5장 시장 규모와 예측 : 유형별(2021-2034년)
- 주요 동향
- 인
- 모노암모늄포스페이트
- 인산이암모늄
- 인산암모늄
- 질소
- 질산암모늄
- 황산암모늄
- 칼륨
- 염화칼륨
- 황산 마그네슘 칼륨
- 황산칼륨
- 미량 영양소
- 유황
- 아연
- 붕소
- 기타
제6장 시장 규모와 예측 : 형태별(2021-2034년)
- 주요 동향
- 건식
- 액체
제7장 시장 규모와 예측 : 작물별(2021-2034년)
- 주요 동향
- 곡물
- 옥수수
- 밀
- 쌀
- 보리
- 과일 및 채소
- 지방종자 및 콩류
- 콩
- 해바라기
- 카놀라
- 사료작물
- 기타
제8장 시장 추계·예측 : 지역별(2021-2034년)
- 주요 동향
- 북미
- 미국
- 캐나다
- 유럽
- 독일
- 영국
- 프랑스
- 스페인
- 이탈리아
- 네덜란드
- 아시아태평양
- 중국
- 인도
- 일본
- 호주
- 한국
- 라틴아메리카
- 브라질
- 멕시코
- 아르헨티나
- 중동 및 아프리카
- 사우디아라비아
- 남아프리카
- 아랍에미리트(UAE)
제9장 기업 프로파일
- CF Industries
- CHS
- ICL
- KS Aktiengesellschaft
- Mosaic
- NUFARM AGRI SOLUTIONS
- Syngenta
- UPL
- Uralchem
- YARA
The Global Starter Fertilizers Market was valued at USD 8.6 billion in 2024 and is estimated to grow at a CAGR of 5.3% to reach USD 14.2 billion by 2034, driven by the increasing reliance on modern agricultural practices and the growing emphasis on maximizing early-stage plant development. Starter fertilizers are becoming a vital component in crop production systems across the globe as farmers seek efficient and sustainable ways to boost early plant health and maximize overall yield. With rising food demand, shrinking arable land, and growing pressure to optimize every stage of the crop lifecycle, starter fertilizers are taking center stage in precision agriculture. These products are not only helping growers address nutrient deficiencies in the soil but also supporting consistent crop establishment, even under challenging climatic conditions. The demand is also reinforced by the rise in population, shifting dietary preferences toward plant-based foods, and the global movement toward reducing agricultural environmental impact. As more countries adopt sustainable intensification strategies, the starter fertilizers market is poised for long-term growth. Increasing investments in digital farming technologies, GPS-enabled planting systems, and soil analytics tools further enhance the appeal of starter fertilizers, particularly among tech-savvy growers looking for targeted nutrient solutions.

Starter fertilizers are engineered to deliver essential nutrients like nitrogen, phosphorus, potassium, and micronutrients directly at planting, where they encourage robust root growth and early seedling vigor. As sustainable farming and crop yield optimization continues to gain momentum, growers are turning to these formulations to ensure optimal nutrient availability from day one. Their ability to improve seedling emergence, plant uniformity, and nutrient uptake makes them a top choice across a broad range of crops.
| Market Scope | |
|---|---|
| Start Year | 2024 |
| Forecast Year | 2025-2034 |
| Start Value | $8.6 Billion |
| Forecast Value | $14.2 Billion |
| CAGR | 5.3% |
Starter fertilizers are typically applied in close proximity to the seed during planting and are most commonly used in crops such as cereals, soybeans, and vegetables. In recent years, liquid starter fertilizers have seen increased adoption due to their ease of application and faster nutrient availability. However, dry formulations still lead the global market due to their longer shelf life, cost-efficiency, and compatibility with standard farming equipment. Innovation is also accelerating in this space, with manufacturers enhancing nutrient solubility and incorporating trace elements to create more tailored solutions that align with specific soil profiles and crop needs.
Among the key nutrient segments, phosphorus holds the lead with a 44.8% market share in 2024 and is expected to grow at a CAGR of 5.1% through 2034. Phosphorus is crucial during early growth stages, playing a central role in root formation and energy transfer processes essential for plant metabolism. When applied efficiently at planting, phosphorus helps seedlings establish more quickly and uniformly, which results in stronger, healthier crops. Ongoing advancements aimed at improving phosphorus solubility and plant uptake continue to support its market dominance.
In terms of form, dry starter fertilizers accounted for a 55.1% share of the market in 2024 and are forecasted to grow at a CAGR of 5.3%. Farmers favor dry formulations for their ease of storage, durability, and adaptability to various crop types. Granular and pelletized versions are especially popular in large-scale farming operations because of their high nutrient concentration and flexibility for blending. These dry fertilizers enable growers to fine-tune applications based on soil test data, helping them meet crop-specific nutrient demands more accurately and cost-effectively.
The United States Starter Fertilizers Market generated USD 1.6 billion in 2024 and is expected to grow at a CAGR of 5% through 2034. This growth is supported by the country's large-scale production of high-yield crops such as corn, soybeans, and wheat, where starter fertilizers play a key role in enhancing germination and early root development. The rise of precision agriculture and smart farming technologies-including GPS-guided planters and variable-rate fertilizer applications-is further accelerating the adoption of these inputs across American farmlands.
Leading players in the starter fertilizers industry, including Syngenta, UPL, CF Industries, Yara, and Nufarm Agri Solution, are actively investing in advanced nutrient technologies and expanding their production capabilities. These companies are forming strategic distribution partnerships, launching crop- and region-specific product lines, and integrating digital agriculture tools into their offerings. Additionally, they are supporting grower education and product training programs to boost adoption rates and ensure optimal product performance across varying soil and climate conditions.
Table of Contents
Chapter 1 Methodology & Scope
- 1.1 Market scope & definition
- 1.2 Base estimates & calculations
- 1.3 Forecast calculation
- 1.4 Data sources
- 1.4.1 Primary
- 1.4.2 Secondary
- 1.4.2.1 Paid sources
- 1.4.2.2 Public sources
- 1.5 Primary research and validation
- 1.5.1 Primary sources
- 1.5.2 Data mining sources
Chapter 2 Executive Summary
- 2.1 Industry synopsis, 2021 - 2034
Chapter 3 Industry Insights
- 3.1 Industry ecosystem analysis
- 3.1.1 Factor affecting the value chain
- 3.1.2 Profit margin analysis
- 3.1.3 Disruptions
- 3.1.4 Future outlook
- 3.1.5 Manufacturers
- 3.1.6 Distributors
- 3.2 Trump administration tariffs
- 3.2.1 Impact on trade
- 3.2.1.1 Trade volume disruptions
- 3.2.1.2 Retaliatory measures
- 3.2.2 Impact on the industry
- 3.2.2.1 Supply-Side impact (Raw Materials)
- 3.2.2.1.1 Price volatility in key materials
- 3.2.2.1.2 Supply chain restructuring
- 3.2.2.1.3 Production cost implications
- 3.2.2.2 Demand-Side impact (Selling Price)
- 3.2.2.2.1 Price transmission to end markets
- 3.2.2.2.2 Market share dynamics
- 3.2.2.2.3 Consumer response patterns
- 3.2.2.1 Supply-Side impact (Raw Materials)
- 3.2.3 Key companies impacted
- 3.2.4 Strategic industry responses
- 3.2.4.1 Supply chain reconfiguration
- 3.2.4.2 Pricing and product strategies
- 3.2.4.3 Policy engagement
- 3.2.5 Outlook and future considerations
- 3.2.1 Impact on trade
- 3.3 Trade statistics (HS Code)
- 3.3.1 Major exporting countries, 2021-2024 (Kilo Tons)
- 3.3.2 Major importing countries, 2021-2024 (Kilo Tons)
Note: the above trade statistics will be provided for key countries only.
- 3.4 Supplier landscape
- 3.5 Profit margin analysis
- 3.6 Key news & initiatives
- 3.7 Regulatory landscape
- 3.8 Impact forces
- 3.8.1 Growth drivers
- 3.8.1.1 Rising demand for high crop yields and early plant vigor
- 3.8.1.2 Adoption of precision agriculture and efficient nutrient management
- 3.8.1.3 Shrinking arable land driving yield optimization
- 3.8.2 Industry pitfalls & challenges
- 3.8.2.1 High initial investment in precision application equipment
- 3.8.2.2 Regulatory challenges and compliance issues
- 3.8.1 Growth drivers
- 3.9 Growth potential analysis
- 3.10 Porter's analysis
- 3.11 PESTEL analysis
Chapter 4 Competitive Landscape, 2024
- 4.1 Introduction
- 4.2 Company market share analysis
- 4.3 Competitive positioning matrix
- 4.4 Strategic outlook matrix
Chapter 5 Market Size and Forecast, By Type, 2021 - 2034 (USD Billion, Units)
- 5.1 Key trends
- 5.2 Phosphorus
- 5.2.1 Monoammonium phosphate
- 5.2.2 Diammonium phosphate
- 5.2.3 Ammonium phosphate
- 5.3 Nitrogen
- 5.3.1 Ammonium nitrate
- 5.3.2 Ammonium sulfate
- 5.4 Potassium
- 5.4.1 Potassium chloride
- 5.4.2 Potassium magnesium sulfate
- 5.4.3 Potassium sulfate
- 5.5 Micronutrient
- 5.5.1 Sulfur
- 5.5.2 Zinc
- 5.5.3 Boron
- 5.5.4 Others
Chapter 6 Market Size and Forecast, By Form, 2021 - 2034 (USD Billion, Units)
- 6.1 Key trends
- 6.2 Dry
- 6.3 Liquid
Chapter 7 Market Size and Forecast, By Crop Type, 2021 - 2034 (USD Billion, Units)
- 7.1 Key trends
- 7.2 Cereal & grains
- 7.2.1 Corn
- 7.2.2 Wheat
- 7.2.3 Rice
- 7.2.4 Barley
- 7.3 Fruit & vegetables
- 7.4 Oilseeds & pulses
- 7.4.1 Soybean
- 7.4.2 Sunflower
- 7.4.3 Canola
- 7.5 Forage crops
- 7.6 Others
Chapter 8 Market Estimates and Forecast, By Region, 2021 - 2034 (USD Billion) (Units)
- 8.1 Key trends
- 8.2 North America
- 8.2.1 U.S.
- 8.2.2 Canada
- 8.3 Europe
- 8.3.1 Germany
- 8.3.2 UK
- 8.3.3 France
- 8.3.4 Spain
- 8.3.5 Italy
- 8.3.6 Netherlands
- 8.4 Asia Pacific
- 8.4.1 China
- 8.4.2 India
- 8.4.3 Japan
- 8.4.4 Australia
- 8.4.5 South Korea
- 8.5 Latin America
- 8.5.1 Brazil
- 8.5.2 Mexico
- 8.5.3 Argentina
- 8.6 Middle East and Africa
- 8.6.1 Saudi Arabia
- 8.6.2 South Africa
- 8.6.3 UAE
Chapter 9 Company Profiles
- 9.1 CF Industries
- 9.2 CHS
- 9.3 ICL
- 9.4 K+S Aktiengesellschaft
- 9.5 Mosaic
- 9.6 NUFARM AGRI SOLUTIONS
- 9.7 Syngenta
- 9.8 UPL
- 9.9 Uralchem
- 9.10 YARA
