


|
시장보고서
상품코드
1740936
전기 대중교통 시스템 시장 : 기회, 성장 촉진요인, 산업 동향 분석 및 예측(2025-2034년)Electric Public Transport System Market Opportunity, Growth Drivers, Industry Trend Analysis, and Forecast 2025 - 2034 |
||||||
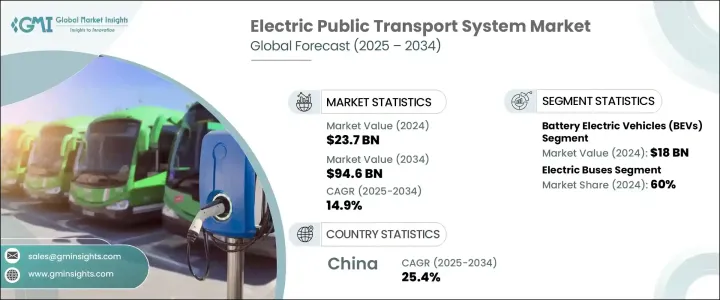
세계의 전기 대중교통 시스템 시장은 2024년에 237억 달러로 평가되었고, 도시 밀도 증가, 환경 규제 강화, 청정 모빌리티 솔루션에 대한 전 세계적인 추진력에 힘입어 2034년에는 946억 달러에 이를 것으로 예측되며, CAGR 14.9%로 성장할 전망입니다.
전 세계 정부와 교통 기관은 배기가스 배출 증가, 교통 혼잡, 도시 팽창에 대응하기 위해 지속 가능한 스마트 교통 시스템으로의 전환을 우선순위로 삼고 있습니다. 도시의 인구 밀도가 높아지고 인구가 급증함에 따라 에너지 효율이 높고 배기가스를 적게 배출하는 대중교통 네트워크에 대한 요구가 중요한 우선순위가 되고 있습니다. 자동화, 디지털화, 무공해 기술을 결합한 전기 대중교통 시스템은 도시 모빌리티의 미래를 재정의하고 있습니다. 도시들은 전기 차량, 최신 인프라, 지능형 교통 관리 시스템에 막대한 투자를 통해 수백만 명의 통근자를 위한 원활하고 연결된 여행 경험을 제공하고 있습니다. 배터리 기술, 텔레매틱스, 무선 충전의 혁신은 전기 차량의 운영 효율성과 신뢰성을 더욱 향상시키고 있습니다. 스마트 시티 대처가 전 세계적으로 확대됨에 따라 전기 대중교통은 차세대 도시 대중교통 생태계의 중추로 부상하고 있으며, 대중의 통근을 더 친환경적이고, 더 빠르고, 더 스마트하게 만들고 있습니다.
탄소 발자국을 줄이고 교통 인프라를 업그레이드하려는 도시의 목표에 따라 트램, 버스, 지하철을 포함한 전기 대중교통에 대한 공공 부문의 투자가 빠르게 가속화되고 있습니다. 디지털 연결 및 자동화와 결합된 전기화는 도시 이동성을 혁신하여 일상적인 대중교통 운영에 첨단 기능과 더 큰 효율성을 가져다주고 있습니다. 전기 대중교통 네트워크는 이제 지능형 경로 계획, 무공해 차량, 실시간 차량 추적 시스템을 통합하고 있습니다. 운영자는 배터리 관리 시스템, 고속 충전 솔루션, 회생 제동과 같은 에너지 절약 기술을 채택하여 운영 비용을 절감하고 성능을 높이고 있습니다. 이와 동시에 첨단 운전자 지원, 온보드 감시 시스템, 통합 디지털 발권 등 승객 중심의 혁신에 대한 수요도 증가하고 있습니다. 이러한 업그레이드는 교통 안전과 승객의 편안함을 향상시킬 뿐만 아니라 탑승객의 매력도 높여줍니다. 무선 소프트웨어 업데이트, 경량 복합 소재, 무선 에너지 전송 시스템 등의 기술 혁신이 시장 성장 궤도를 가속화하고 있습니다. 전기 대체 교통수단이 화석 연료 기반 교통수단을 꾸준히 대체함에 따라 지속 가능성, 자동화, 통근 경험 개선에 초점을 맞춘 지속적인 혁신으로 시장이 번창하고 있습니다.
| 시장 범위 | |
|---|---|
| 시작 연도 | 2024년 |
| 예측 연도 | 2025-2034년 |
| 시작 금액 | 237억 달러 |
| 예측 금액 | 946억 달러 |
| CAGR | 14.9% |
배터리 전기자동차(BEV) 부문은 2024년에 180억 달러를 창출하여 전기 대중교통 시스템 부문 내 추진 카테고리 중 가장 큰 점유율을 차지했습니다. 이러한 지속적인 리더십은 저공해 목표가 지능형 사용자 중심 온보드 기술에 대한 수요 증가와 완벽하게 일치하는 전기 도시 모빌리티로의 전환이 가속화되고 있는 것과 관련이 있습니다. 전기버스는 배기가스 배출이 전혀 없고, 유지보수 필요성이 낮으며, 실시간 경로 업데이트, 대화형 대시보드, 첨단 운전자 지원 시스템과 같은 디지털 혁신과 쉽게 통합할 수 있어 차량을 현대화하는 지자체에서 가장 선호하는 차량입니다.
차량 유형 중에서는 전기 버스 부문은 2024년 60%의 시장 점유율을 차지하며 가장 널리 채택된 전기 대중교통 수단으로 우뚝 섰습니다. 이러한 리더십은 전 세계적인 환경 정책의 변화, 정부 보조금 증가, 공공 충전 네트워크의 빠른 확장에 힘입어 뒷받침되고 있습니다. 최신 전기 버스는 지속 가능한 이동성을 넘어 정전식 터치스크린, 직관적인 운전자 디스플레이, 적응형 조명, 인체공학적 인테리어와 같은 스마트 기능을 제공하여 운전자의 경험과 승객의 편안함을 모두 향상시킵니다. 확장성과 비용 효율성 덕분에 깨끗한 대용량 대중교통에 대한 수요가 급증하는 인구 밀도가 높은 도시에 이상적입니다.
중국의 전기 대중교통 시스템 시장은 2024년에 30억 달러 규모를 형성했으며 2034년까지 25.4%의 놀라운 연평균 성장률을 기록할 것으로 예상됩니다. 이 분야에서 중국의 지배력은 지속 가능한 모빌리티와 스마트 시티 개발을 선호하는 공격적인 국가 전략에 의해 강화되고 있습니다. 막대한 정부 자금 지원, 급속한 도시화, 광범위한 대중교통 전기화 계획으로 중국은 계속해서 혁신의 선두에 서고 있습니다. 지방 당국은 배터리 관리 시스템, AI 기반 스케줄링, 클라우드 기반 모니터링, 자율 주행 기능을 통합하는 대용량 전기 버스와 지능형 교통 생태계에 막대한 투자를 하고 있으며, 이를 통해 가동 중단 시간을 줄이고, 경로를 최적화하며, 차량 수명을 연장할 수 있도록 지원하고 있습니다.
세계의 전기 대중교통 시스템 시장의 주요 기업으로는 VDL Bus & Coach, BYD, Yutong Bus, Heliox, EasyMile, Tata Motors, Hitachi Rail, Siemens Mobility, Alstom 및 Volvo가 포함되어 있습니다. 주요 기업은 모듈형 전기 플랫폼에 투자하고, 상호 운용 가능한 충전 시스템을 개발하며, 도시 교통 기관과 전략적 파트너십을 맺는 등 시장 입지를 강화하고 있습니다. 또한 에너지 최적화된 전기차로 제품 포트폴리오를 확장하고, 글로벌 시장에서 진화하는 규제, 운영 및 환경 요건을 민첩하게 충족하기 위해 ADAS, 텔레매틱스 및 차량 관리 소프트웨어에 R&D 노력을 집중하고 있습니다.
목차
제1장 조사 방법과 범위
제2장 주요 요약
제3장 업계 인사이트
- 생태계 분석
- 공급자의 상황
- 원자재 공급자
- 부품 공급업체
- 제조업자
- 기술 공급자
- 유통 채널 분석
- 최종 용도
- 이익률 분석
- 공급자의 상황
- 트럼프 정권에 의한 관세에 대한 영향
- 무역에 미치는 영향
- 무역량의 혼란
- 보복 조치
- 업계에 미치는 영향
- 공급측의 영향(원자재)
- 주요 원자재의 가격 변동
- 공급망 재구성
- 생산 비용에 미치는 영향
- 수요측의 영향(판매가격)
- 최종 시장에의 가격 전달
- 시장 점유율 동향
- 소비자의 반응 패턴
- 공급측의 영향(원자재)
- 전략적인 업계 대응
- 공급망 재구성
- 가격 설정 및 제품 전략
- 무역에 미치는 영향
- 기술과 혁신의 상황
- 특허 분석
- 규제 상황
- 코스트 내역 분석
- 주요 뉴스와 대처
- 영향요인
- 성장 촉진요인
- 차량 내 연결성 및 UX에 대한 수요 증가
- 재료 및 제조 분야의 기술 발전
- 전기 및 자율 주행 차량의 성장
- 무게 감소 및 설계 통합에 대한 OEM의 초점
- 업계의 잠재적 위험 및 과제
- 높은 생산 비용
- 내구성 및 환경 민감성
- 성장 촉진요인
- 성장 가능성 분석
- Porter's Five Forces 분석
- PESTEL 분석
제4장 경쟁 구도
- 소개
- 기업의 시장 점유율 분석
- 경쟁 포지셔닝 매트릭스
- 전략적 전망 매트릭스
제5장 시장 추계 및 예측 : 교통 수단별(2021-2034년)
- 주요 동향
- 전기 버스
- 전기 열차
- 전기 페리
- 전기 택시 및 라이드 셰어링
제6장 시장 추계 및 예측 : 추진력별(2021-2034년)
- 주요 동향
- 배터리 전기자동차(BEV)
- 플러그인 하이브리드 전기자동차(PHEV)
- 연료전지 전기자동차(FCEV)
제7장 시장 추계 및 예측 : 충전별(2021-2034년)
- 주요 동향
- 디포 충전
- 기회 충전
- 무선 충전
- 배터리 교환
제8장 시장 추계 및 예측 : 용도별(2021-2034년)
- 주요 동향
- 정부 교통 당국
- 민간 차량 운영자
- 공공-민간 파트너십(PPP)
- 공항 및 산업 교통 사업자
- 기타
제9장 시장 추계 및 예측 : 지역별(2021-2034년)
- 주요 동향
- 북미
- 미국
- 캐나다
- 유럽
- 독일
- 프랑스
- 영국
- 스페인
- 이탈리아
- 러시아
- 북유럽 국가
- 아시아태평양
- 중국
- 인도
- 일본
- 한국
- 호주 및 뉴질랜드
- 동남아시아
- 라틴아메리카
- 브라질
- 멕시코
- 아르헨티나
- 중동 및 아프리카
- 아랍에미리트(UAE)
- 남아프리카
- 사우디아라비아
제10장 기업 프로파일
- ABB
- Alexander Dennis
- Alstom
- Ashok Leyland
- BYD
- CAF
- CRRC
- EasyMile
- Heliox
- Hitachi Rail
- Keolis
- Navya
- Proterra
- Schneider Electric
- Siemens eMobility
- Soltaro
- Tata Motors
- VDL Bus &Coach
- Volvo
- Yutong Bus
The Global Electric Public Transport System Market was valued at USD 23.7 billion in 2024 and is estimated to grow at a CAGR of 14.9% to reach USD 94.6 billion by 2034, driven by increased urban density, stricter environmental regulations, and the global momentum toward clean mobility solutions. Governments and transit agencies worldwide are prioritizing the shift to sustainable, smart transportation systems to combat rising emissions, congestion, and urban sprawl. As cities grow denser and populations surge, the demand for energy-efficient, low-emission public transport networks is becoming a critical priority. Electric public transport systems, combining automation, digitalization, and zero-emission technology, are redefining the future of urban mobility. Cities are investing heavily in electrified fleets, modern infrastructure, and intelligent traffic management systems to create seamless, connected travel experiences for millions of commuters. Innovation in battery technologies, telematics, and wireless charging is further enhancing the operational efficiency and reliability of electric fleets. As smart city initiatives expand globally, electric public transportation is emerging as the backbone of next-generation urban transit ecosystems, making public commuting greener, faster, and smarter.

Public sector investments in electric mass transit-including trams, buses, and metros-are rapidly accelerating as cities aim to lower carbon footprints and upgrade transportation infrastructure. Electrification combined with digital connectivity and automation is transforming urban mobility, bringing advanced functionality and greater efficiency into daily transit operations. Electric public transport networks are now integrating intelligent route planning, zero-emission vehicles, and real-time fleet tracking systems. Operators are adopting energy-saving technologies such as battery management systems, fast-charging solutions, and regenerative braking to drive down operating costs and boost performance. Simultaneously, demand is rising for rider-focused innovations like advanced driver assistance, onboard surveillance systems, and integrated digital ticketing. These upgrades not only enhance transit safety and passenger comfort but also increase ridership appeal. Technological breakthroughs, including over-the-air software updates, lightweight composite materials, and wireless energy transfer systems, are accelerating the market growth trajectory. As electric alternatives steadily replace fossil-fuel-based transit modes, the market is thriving with continuous innovations focused on improving sustainability, automation, and commuter experience.
| Market Scope | |
|---|---|
| Start Year | 2024 |
| Forecast Year | 2025-2034 |
| Start Value | $23.7 Billion |
| Forecast Value | $94.6 Billion |
| CAGR | 14.9% |
The battery electric vehicles (BEVs) segment generated USD 18 billion in 2024, securing the largest share among propulsion categories within the electric public transport system sector. Their sustained leadership is tied to the accelerating shift toward electric urban mobility, where low-emission goals align perfectly with the rising demand for intelligent, user-centric onboard technology. BEVs offer zero tailpipe emissions, lower maintenance needs, and easy integration with digital innovations such as real-time route updates, interactive dashboards, and advanced driver assistance systems, making them the top choice for municipalities modernizing their fleets.
Among vehicle types, the electric buses segment dominated with a 60% market share in 2024, standing out as the most widely adopted mode of electric public transport. This leadership is backed by a global wave of environmental policies, increasing government subsidies, and accelerated expansion of public charging networks. Modern electric buses go beyond sustainable mobility, offering smart features like capacitive touchscreens, intuitive driver displays, adaptive lighting, and ergonomic interiors that enhance both driver experience and passenger comfort. Their scalability and cost-efficiency make them ideal for densely populated cities where demand for clean, high-capacity transit is soaring.
The China Electric Public Transport System Market generated USD 3 billion in 2024 and is forecasted to grow at a remarkable CAGR of 25.4% through 2034. China's dominance in the sector is reinforced by aggressive national strategies favoring sustainable mobility and smart city development. Massive government funding, rapid urbanization, and extensive mass transit electrification plans continue to place China at the forefront of innovation. Local authorities are investing heavily in high-capacity electric bus fleets and intelligent traffic ecosystems that integrate battery management systems, AI-powered scheduling, cloud-based monitoring, and autonomous driving capabilities, all helping to reduce downtime, optimize routes, and extend vehicle lifecycles.
Major players in the Global Electric Public Transport System Market include VDL Bus & Coach, BYD, Yutong Bus, Heliox, EasyMile, Tata Motors, Hitachi Rail, Siemens Mobility, Alstom, and Volvo. Leading companies are strengthening their market positions by investing in modular electric platforms, developing interoperable charging systems, and forming strategic partnerships with urban transit agencies. They are also expanding product portfolios with energy-optimized electric vehicles and focusing R&D efforts on ADAS, telematics, and fleet management software to stay agile and meet evolving regulatory, operational, and environmental requirements across global markets.
Table of Contents
Chapter 1 Methodology & Scope
- 1.1 Research design
- 1.1.1 Research approach
- 1.1.2 Data collection methods
- 1.2 Base estimates & calculations
- 1.2.1 Base year calculation
- 1.2.2 Key trends for market estimation
- 1.3 Forecast model
- 1.4 Primary research and validation
- 1.4.1 Primary sources
- 1.4.2 Data mining sources
- 1.5 Market scope & definition
Chapter 2 Executive Summary
- 2.1 Industry 3600 synopsis, 2021 - 2034
Chapter 3 Industry Insights
- 3.1 Industry ecosystem analysis
- 3.1.1 Supplier landscape
- 3.1.1.1 Raw material providers
- 3.1.1.2 Component providers
- 3.1.1.3 Manufacturers
- 3.1.1.4 Technology providers
- 3.1.1.5 Distribution channel analysis
- 3.1.1.6 End use
- 3.1.2 Profit margin analysis
- 3.1.1 Supplier landscape
- 3.2 Impact of Trump administration tariffs
- 3.2.1 Trade impact
- 3.2.1.1 Trade volume disruptions
- 3.2.1.2 Retaliatory measures
- 3.2.2 Impact on industry
- 3.2.2.1 Supply-side impact (raw materials)
- 3.2.2.1.1 Price volatility in key materials
- 3.2.2.1.2 Supply chain restructuring
- 3.2.2.1.3 Production cost implications
- 3.2.2.2 Demand-side impact (selling price)
- 3.2.2.2.1 Price transmission to end markets
- 3.2.2.2.2 Market share dynamics
- 3.2.2.2.3 Consumer response patterns
- 3.2.2.1 Supply-side impact (raw materials)
- 3.2.3 Strategic industry responses
- 3.2.3.1 Supply chain reconfiguration
- 3.2.3.2 Pricing and product strategies
- 3.2.1 Trade impact
- 3.3 Technology & innovation landscape
- 3.4 Patent analysis
- 3.5 Regulatory landscape
- 3.6 Cost breakdown analysis
- 3.7 Key news & initiatives
- 3.8 Impact forces
- 3.8.1 Growth drivers
- 3.8.1.1 Rising demand for in-vehicle connectivity and UX
- 3.8.1.2 Technological advancements in materials & manufacturing
- 3.8.1.3 Growth in electric and autonomous vehicles
- 3.8.1.4 OEM focus on weight reduction and design integration
- 3.8.2 Industry pitfalls & challenges
- 3.8.2.1 High Production Costs
- 3.8.2.2 Durability and Environmental Sensitivity
- 3.8.1 Growth drivers
- 3.9 Growth potential analysis
- 3.10 Porter's analysis
- 3.11 PESTEL analysis
Chapter 4 Competitive Landscape, 2024
- 4.1 Introduction
- 4.2 Company market share analysis
- 4.3 Competitive positioning matrix
- 4.4 Strategic outlook matrix
Chapter 5 Market Estimates & Forecast, By Mode of Transport, 2021 - 2034 ($Mn, Units)
- 5.1 Key trends
- 5.2 Electric buses
- 5.3 Electric trains
- 5.4 Electric ferries
- 5.5 Electric taxis/ride-hailing
Chapter 6 Market Estimates & Forecast, By Propulsion, 2021 - 2034 ($Mn, Units)
- 6.1 Key trends
- 6.2 Battery Electric Vehicles (BEV)
- 6.3 Plug-in Hybrid Electric Vehicles (PHEV)
- 6.4 Fuel Cell Electric Vehicles (FCEV)
Chapter 7 Market Estimates & Forecast, By Charging, 2021 - 2034 ($Mn, Units)
- 7.1 Key trends
- 7.2 Depot charging
- 7.3 Opportunity charging
- 7.4 Wireless charging
- 7.5 Battery swapping
Chapter 8 Market Estimates & Forecast, By Application, 2021 - 2034 ($Mn, Units)
- 8.1 Key trends
- 8.2 Government transit authorities
- 8.3 Private fleet operators
- 8.4 Public-Private Partnerships (PPPs)
- 8.5 Airport & industrial transit operators
- 8.6 Others
Chapter 9 Market Estimates & Forecast, By Region, 2021 - 2034 ($Mn, Units)
- 9.1 Key trends
- 9.2 North America
- 9.2.1 U.S.
- 9.2.2 Canada
- 9.3 Europe
- 9.3.1 Germany
- 9.3.2 France
- 9.3.3 UK
- 9.3.4 Spain
- 9.3.5 Italy
- 9.3.6 Russia
- 9.3.7 Nordics
- 9.4 Asia Pacific
- 9.4.1 China
- 9.4.2 India
- 9.4.3 Japan
- 9.4.4 South Korea
- 9.4.5 ANZ
- 9.4.6 Southeast Asia
- 9.5 Latin America
- 9.5.1 Brazil
- 9.5.2 Mexico
- 9.5.3 Argentina
- 9.6 MEA
- 9.6.1 UAE
- 9.6.2 South Africa
- 9.6.3 Saudi Arabia
Chapter 10 Company Profiles
- 10.1 ABB
- 10.2 Alexander Dennis
- 10.3 Alstom
- 10.4 Ashok Leyland
- 10.5 BYD
- 10.6 CAF
- 10.7 CRRC
- 10.8 EasyMile
- 10.9 Heliox
- 10.10 Hitachi Rail
- 10.11 Keolis
- 10.12 Navya
- 10.13 Proterra
- 10.14 Schneider Electric
- 10.15 Siemens eMobility
- 10.16 Soltaro
- 10.17 Tata Motors
- 10.18 VDL Bus & Coach
- 10.19 Volvo
- 10.20 Yutong Bus
