


|
시장보고서
상품코드
1750290
진공 컨택터 시장 : 기회, 성장 촉진요인, 산업 동향 분석, 예측(2025-2034년)Vacuum Contactor Market Opportunity, Growth Drivers, Industry Trend Analysis, and Forecast 2025 - 2034 |
||||||
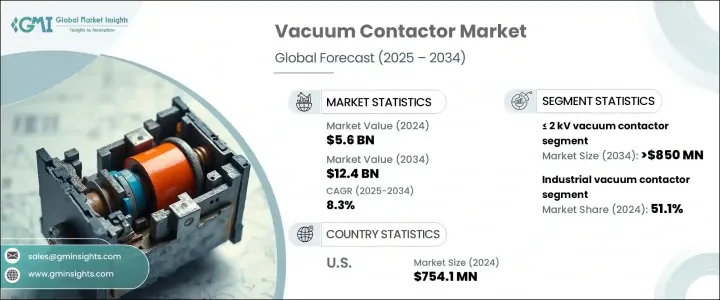
세계의 진공 컨택터 시장 규모는 2024년 56억 달러로, 전력 인프라 투자 증가, 에너지 효율적인 솔루션 수요 증가, 스마트 그리드 시스템 전개 확대 등을 배경으로 CAGR 8.3%로 성장해 2034년까지 124억 달러에 이를 것으로 전망되고 있습니다.
산업계와 공익 사업체가 최신 에너지 네트워크를 지원하는 신뢰성 높은 고성능 스위칭 솔루션을 계속 요구하고 있기 때문에 진공 컨택터 수요는 기세를 늘리고 있습니다.

이 성장의 주요 요인 중 하나는 미션 크리티컬한 환경에서 신뢰할 수 있는 배전을 보장하는 안전하고 내구성 있는 고속 스위칭 디바이스에 대한 요구가 높아진 것입니다. 그러면 기기의 안전성에 대한 의식이 높아져 진공 컨택터의 사용이 확대되고 있습니다. 전기 기계식 컨택터를 포함하는 기존 시스템의 업그레이드를 진행하고 있습니다.
| 시장 범위 | |
|---|---|
| 시작 연도 | 2024년 |
| 예측 연도 | 2025-2034년 |
| 시작 금액 | 56억 달러 |
| 예측 금액 | 124억 달러 |
| CAGR | 8.3% |
이 시장은 2kV 미만, 2-5 kV, 5-10 kV, 10 kV 이상 등 정격 전압별로 분할되어 있습니다. 2kV 미만 부문은 2034년까지 8억 5,000만 달러 이상에 달할 것으로 예측되고 있습니다. 이 부문은 컴팩트한 환경에서 에너지 효율이 높은 시스템의 도입이 증가하고 있기 때문에 특히 인기가 있습니다.
최종 용도의 관점에서 시장은 상업, 공업, 유틸리티로 분류됩니다. 또한, 특히 개발도상지역에서의 공업생산능력의 확대가, 폭넓은 용도에의 진공 컨택터 전개의 새로운 기회를 창출하고 있습니다.
지역별로는 미국이 시장 성장에 크게 공헌하고 있으며, 2022년의 평가액은 6억 9,220만 달러, 2023년에는 7억 2,090만 달러, 2024년에는 7억 5,410만 달러에 달했습니다. 국내 송전망의 근대화와 산업 부문의 운용 효율 향상을 목표로 하는 관민의 대처가, 제품 수요를 가속시키고 있습니다. 또한, 성능의 중단을 막으면서 운용 코스트를 낮추는 것에 중점을 두는 것으로, 이해 관계자는 기존 대체품이 아닌 진공 컨택터를 선택합니다.
경쟁 구도는 중간 정도로 정리되어 있으며 상위 5개사가 세계 시장 점유율의 약 40%를 차지하고 있습니다. 이러한 기업에는 광범위한 제품 포트폴리오와 확립된 서비스 네트워크를 갖춘 주요 다국적 기업이 포함됩니다. 이러한 기업들은 R&D에 대한 지속적인 투자 외에도 지역 파트너십과 진공 컨택터에 스마트 기능을 통합함으로써 시장에서 강력한 발판을 유지하고 있습니다. 이러한 기업들은 제품의 수명을 연장하고, 에너지 손실을 줄이고, 원격 진단을 지원하는 기술에 점점 더 집중하고 있으며, 디지털화 및 스마트 에너지 시스템의 광범위한 동향과 일치하고 있습니다.
목차
제1장 조사 방법과 범위
제2장 주요 요약
제3장 업계 인사이트
- 생태계 분석
- 트럼프 정권의 관세 분석
- 무역에 미치는 영향
- 무역량의 혼란
- 보복 조치
- 업계에 미치는 영향
- 공급측의 영향(원재료)
- 주요 원재료의 가격 변동
- 공급망 재구성
- 생산 비용에 미치는 영향
- 수요측의 영향(판매가격)
- 최종 시장에의 가격 전달
- 시장 점유율 동향
- 소비자의 반응 패턴
- 공급측의 영향(원재료)
- 영향을 받는 주요 기업
- 전략적인 업계 대응
- 공급망 재구성
- 가격 설정 및 제품 전략
- 정책관여
- 전망과 향후 검토 사항
- 무역에 미치는 영향
- 규제 상황
- 업계에 미치는 영향요인
- 성장 촉진요인
- 업계의 잠재적 위험 및 과제
- 성장 가능성 분석
- Porter's Five Forces 분석
- PESTEL 분석
제4장 경쟁 구도
- 소개
- 기업의 시장 점유율 분석
- 전략적 대시보드
- 전략적 노력
- 경쟁 벤치마킹
- 혁신과 지속가능성의 정세
제5장 시장 규모와 예측 : 용도별, 2021-2034년
- 주요 동향
- 모터 스타터
- 변압기
- 커패시터
- 원자로
- 저항 부하
- 기타
제6장 시장 규모와 예측 : 전압별, 2021-2034년
- 주요 동향
- 2kV 미만
- 2-5kV
- 5-10kV
- 10kV 이상
제7장 시장 규모와 예측 : 최종 용도별, 2021-2034년
- 주요 동향
- 상업용
- 산업
- 유틸리티
제8장 시장 규모와 예측 : 지역별, 2021-2034년
- 주요 동향
- 북미
- 미국
- 캐나다
- 멕시코
- 유럽
- 영국
- 프랑스
- 러시아
- 독일
- 스페인
- 이탈리아
- 아시아태평양
- 중국
- 일본
- 한국
- 인도
- 호주
- 인도네시아
- 말레이시아
- 태국
- 중동 및 아프리카
- 사우디아라비아
- 아랍에미리트(UAE)
- 이란
- 이집트
- 남아프리카
- 나이지리아
- 튀르키예
- 모로코
- 라틴아메리카
- 브라질
- 아르헨티나
- 칠레
제9장 기업 프로파일
- ABB
- Datsons Electronics
- Eaton
- EAW Relaistechnik
- ElectronTubes
- GREENSTONE
- Hansen Electric
- HIITIO New Energy
- Kunshan GuoLi Electronic Technology
- Liyond
- LS ELECTRIC
- Mitsubishi Electric Corporation
- Pentagon Switchgears
- Rockwell Automation
- Schneider Electric
- Schrack Technik
The Global Vacuum Contactor Market was valued at USD 5.6 billion in 2024 and is estimated to grow at a CAGR of 8.3% to reach USD 12.4 billion by 2034, driven by increasing investments in power infrastructure, rising demand for energy-efficient solutions, and expanding deployment of smart grid systems. As industries and utilities continue to seek reliable, high-performance switching solutions that support modern energy networks, the demand for vacuum contactors is gaining momentum. Technological advancements, combined with a shift toward automation and the rising share of renewable energy in the power mix, are creating a robust foundation for market expansion.
One of the major factors contributing to this growth is the increasing need for safe, durable, and fast-switching devices that ensure reliable power distribution in mission-critical environments. Vacuum contactors offer advantages such as low maintenance, high electrical endurance, and compact designs that make them suitable for a variety of industrial and utility applications. Their use is expanding due to heightened awareness of equipment safety, especially in medium-voltage environments, where arc flash risks must be minimized. Additionally, the growth in electrification across sectors and an increasing emphasis on operational reliability are pushing end users to upgrade existing systems, which often include aging electromechanical contactors. This transition is further supported by favorable regulations and incentives that promote modernized electrical infrastructure.
| Market Scope | |
|---|---|
| Start Year | 2024 |
| Forecast Year | 2025-2034 |
| Start Value | $5.6 Billion |
| Forecast Value | $12.4 Billion |
| CAGR | 8.3% |
The market is segmented by voltage rating, including <= 2 kV, > 2 kV to 5 kV, > 5 kV to 10 kV, and > 10 kV. Among these, the <= 2 kV segment is forecast to exceed USD 850 million by 2034. This segment is particularly popular due to the increasing deployment of energy-efficient systems in compact environments. Vacuum contactors in this voltage range are favored for their reliability, smaller footprint, and suitability for space-constrained settings where minimal maintenance is a key requirement.
In terms of end use, the market is classified into commercial, industrial, and utility sectors. The industrial segment dominated the market in 2024 with a share of 51.1%. This dominance can be attributed to stricter energy efficiency standards and the growing need for dependable fault-handling equipment in production facilities and processing units. Moreover, expanding industrial manufacturing capacities, particularly in developing regions, are creating new opportunities for vacuum contactor deployment across a wide range of applications.
Regionally, the United States has emerged as a significant contributor to market growth, with valuations of USD 692.2 million in 2022, USD 720.9 million in 2023, and USD 754.1 million in 2024. The increasing pace of infrastructure development in the country, especially in renewable energy and electric vehicle sectors, is leading to greater adoption of vacuum contactors. Public and private sector initiatives aimed at modernizing the national grid and enhancing operational efficiency in industrial sectors are accelerating product demand. Moreover, the focus on lowering operational costs while ensuring uninterrupted performance is prompting stakeholders to choose vacuum contactors over conventional alternatives.
The competitive landscape is moderately consolidated, with the top five players accounting for approximately 40% of the global market share. These include leading multinational corporations with extensive product portfolios and well-established service networks. Their continued investments in R&D, combined with regional partnerships and integration of smart features into vacuum contactors, are helping them maintain a strong foothold in the market. These companies are increasingly focusing on technologies that enhance product longevity, reduce energy losses, and support remote diagnostics, aligning with the broader trends in digitalization and smart energy systems.
Table of Contents
Chapter 1 Methodology & Scope
- 1.1 Research design
- 1.2 Market estimates & forecast parameters
- 1.3 Forecast calculation
- 1.4 Data sources
- 1.4.1 Primary
- 1.4.2 Secondary
- 1.4.2.1 Paid
- 1.4.2.2 Public
- 1.5 Market definitions
Chapter 2 Executive Summary
- 2.1 Industry synopsis, 2021 - 2034
Chapter 3 Industry Insights
- 3.1 Industry ecosystem analysis
- 3.2 Trump administration tariffs analysis
- 3.2.1 Impact on trade
- 3.2.1.1 Trade volume disruptions
- 3.2.1.2 Retaliatory measures
- 3.2.2 Impact on the industry
- 3.2.2.1 Supply-side impact (raw material)
- 3.2.2.1.1 Price volatility in key materials
- 3.2.2.1.2 Supply chain restructuring
- 3.2.2.1.3 Production cost implications
- 3.2.2.2 Demand-side impact (selling price)
- 3.2.2.2.1 Price transmission to end markets
- 3.2.2.2.2 Market share dynamics
- 3.2.2.2.3 Consumer response patterns
- 3.2.2.1 Supply-side impact (raw material)
- 3.2.3 Key companies impacted
- 3.2.4 Strategic industry responses
- 3.2.4.1 Supply chain reconfiguration
- 3.2.4.2 Pricing and product strategies
- 3.2.4.3 Policy engagement
- 3.2.5 Outlook and future considerations
- 3.2.1 Impact on trade
- 3.3 Regulatory landscape
- 3.4 Industry impact forces
- 3.4.1 Growth drivers
- 3.4.2 Industry pitfalls & challenges
- 3.5 Growth potential analysis
- 3.6 Porter's analysis
- 3.6.1 Bargaining power of suppliers
- 3.6.2 Bargaining power of buyers
- 3.6.3 Threat of new entrants
- 3.6.4 Threat of substitutes
- 3.7 PESTEL analysis
Chapter 4 Competitive Landscape, 2025
- 4.1 Introduction
- 4.2 Company market share analysis, 2024
- 4.3 Strategic dashboard
- 4.4 Strategic initiatives
- 4.5 Competitive benchmarking
- 4.6 Innovation & sustainability landscape
Chapter 5 Market Size and Forecast, By Application, 2021 - 2034 ('000 Units & USD Million)
- 5.1 Key trends
- 5.2 Motor starter
- 5.3 Transformer
- 5.4 Capacitor
- 5.5 Reactor
- 5.6 Resistive loads
- 5.7 Others
Chapter 6 Market Size and Forecast, By Voltage, 2021 - 2034 ('000 Units & USD Million)
- 6.1 Key trends
- 6.2 ≤ 2 kV
- 6.3 > 2 kV to 5 kV
- 6.4 > 5 kV to 10 kV
- 6.5 > 10 kV
Chapter 7 Market Size and Forecast, By End Use, 2021 - 2034 ('000 Units & USD Million)
- 7.1 Key trends
- 7.2 Commercial
- 7.3 Industrial
- 7.4 Utility
Chapter 8 Market Size and Forecast, By Region, 2021 - 2034 ('000 Units & USD Million)
- 8.1 Key trends
- 8.2 North America
- 8.2.1 U.S.
- 8.2.2 Canada
- 8.2.3 Mexico
- 8.3 Europe
- 8.3.1 UK
- 8.3.2 France
- 8.3.3 Russia
- 8.3.4 Germany
- 8.3.5 Spain
- 8.3.6 Italy
- 8.4 Asia Pacific
- 8.4.1 China
- 8.4.2 Japan
- 8.4.3 South Korea
- 8.4.4 India
- 8.4.5 Australia
- 8.4.6 Indonesia
- 8.4.7 Malaysia
- 8.4.8 Thailand
- 8.5 Middle East & Africa
- 8.5.1 Saudi Arabia
- 8.5.2 UAE
- 8.5.3 Iran
- 8.5.4 Egypt
- 8.5.5 South Africa
- 8.5.6 Nigeria
- 8.5.7 Turkey
- 8.5.8 Morocco
- 8.6 Latin America
- 8.6.1 Brazil
- 8.6.2 Argentina
- 8.6.3 Chile
Chapter 9 Company Profiles
- 9.1 ABB
- 9.2 Datsons Electronics
- 9.3 Eaton
- 9.4 EAW Relaistechnik
- 9.5 ElectronTubes
- 9.6 GREENSTONE
- 9.7 Hansen Electric
- 9.8 HIITIO New Energy
- 9.9 Kunshan GuoLi Electronic Technology
- 9.10 Liyond
- 9.11 LS ELECTRIC
- 9.12 Mitsubishi Electric Corporation
- 9.13 Pentagon Switchgears
- 9.14 Rockwell Automation
- 9.15 Schneider Electric
- 9.16 Schrack Technik
