|
시장보고서
상품코드
1750505
병렬 스위치기어 시장 : 시장 기회, 성장 촉진요인, 산업 동향 분석, 예측(2025-2034년)Paralleling Switchgear Market Opportunity, Growth Drivers, Industry Trend Analysis, and Forecast 2025 - 2034 |
||||||
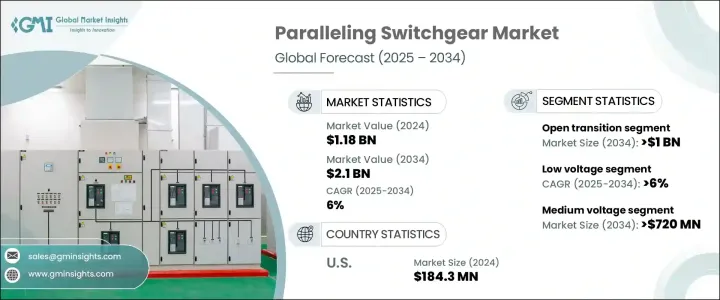
세계의 병렬 스위치기어 시장 규모는 2024년에 11억 8,000만 달러로 평가되었고, CAGR 6%로 성장할 전망이며, 2034년에는 21억 달러에 달할 것으로 예측되고 있습니다.
이러한 증가 추세는 다양한 산업에서 지속적이고 효율적인 배전에 대한 수요가 증가하고 있는 것이 큰 요인이 되고 있습니다. 근대적인 인프라가 계속 확대되는 가운데, 신뢰성 높은 전력 공급을 유지하는 것의 중요성이 높아지고 있습니다. 다양한 분야의 시설에서 안정적인 전력을 확보하고 정전에 따른 위험을 줄이는 시스템이 채택되고 있습니다. 병렬 스위치기어 채택이 급증하는 것은 여러 전원을 동기화해 전체 전기 부하의 안정성을 유지하는 데 도움이 되기 때문입니다.
이러한 시스템은 여러 발전 유닛을 유틸리티 그리드와 통합하도록 설계되었으며, 에너지 분배를 최적화하고 다운타임을 최소화하면서 전원 간의 원활한 전환을 가능하게 합니다. 이 기술은 작은 중단으로도 큰 성능의 중단이나 경제적 손실로 이어질 수 있는 매우 민감한 운영 환경에서 필수적인 구성 요소가 되고 있습니다. 부하 분산, 용장성, 운용 효율을 지원하는 인텔리전트한 전원 관리 솔루션에 대한 신뢰가 높아지고 있는 것이 시장을 전진시키고 있습니다. 도시지역 및 공업지대에서 전력 수요가 증가하는 가운데 병렬 스위치기어를 사용함으로써 그리드 변동이나 정전에 견딜 수 있는 회복력 있는 시설을 유지할 수 있습니다.
| 시장 범위 | |
|---|---|
| 시작 연도 | 2024년 |
| 예측 연도 | 2025-2034년 |
| 시작 금액 | 11억 8,000만 달러 |
| 예측 금액 | 21억 달러 |
| CAGR | 6% |
또 다른 주요 성장 요인은 백업 전원 시스템의 사용 확대이며, 비즈니스 규모가 확대되고 복잡해짐에 따라 중요한 프로세스에서 중단없는 전력을 유지하는 것이 더욱 중요해지고 있습니다. 백업 시스템은 현재 대규모 빌딩, 연구소, 시설에 널리 내장되어 있으며, 대부분의 경우 여러 발전기 유닛이 관여하고 있습니다. 병렬 스위치기어는 자동 또는 수동 동기화와 부하 공유를 가능하게 함으로써 이 통합을 촉진하는 중요한 역할을 합니다. 업무를 멈추지 않고 1차 정보와 2차 정보를 쉽게 전환할 수 있다는 것은 사업 지속 계획에 있어서 전략적인 이점이 되고 있습니다.
광범위한 시장에서 저전압 분야는 2034년까지 연평균 복합 성장률(CAGR)이 6%를 넘을 것으로 예상되고 있습니다. 이 분야는 산업계가 안전성과 성능을 모두 제공하는 솔루션을 점점 더 요구하게 되면서 견인력을 더하고 있습니다. 에너지 사용의 합리화, 자동화, 보다 스마트한 공장 환경의 중시가, 저전압 병렬 스위치기어의 수요를 끌어올리고 있습니다. 산업이 보다 디지털화되고 효율적인 운영으로 이행하는 가운데, 이러한 시스템은 고부하 용도에서도 보다 안전하고 확실하게 전력을 관리 및 배전하는 데 도움이 되고 있습니다. 에너지 낭비를 최소화하면서 일관된 운영을 지원하는 그 역할은 다양한 제조업과 가공업에서 선호되고 있습니다.
지역별로는 미국이 최근 꾸준한 시장 성장을 보이고 있습니다. 이 나라의 병렬 스위치기어 시장은, 2022년에 1억 6,830만 달러였지만, 2023년에는 1억 7,590만 달러로 상승했으며, 추가로 2024년에는 1억 8,430만 달러에 이르렀습니다. 이러한 일관된 상승은 부서를 불문하고 미션 크리티컬한 활동을 지원할 수 있는 견고한 전력 인프라에 대한 수요 증가를 반영하고 있습니다. 기술적으로 선진적이고 인프라가 많은 환경에서의 무정전 전원 공급에 대한 요구가 계속해서 제품 채택을 뒷받침하고 있습니다. 시설이 확대되고 보다 탄력적이며 적응성이 높은 에너지 관리 시스템이 채택됨에 따라 시장 전망은 계속 밝습니다.
업계의 기업들은 기술적으로 첨단 솔루션을 제공하고 중요한 인프라 프로젝트의 존재감을 높이고 그 지위를 강화하고 있습니다. 전력 시스템과 자동화에 관한 전문 지식을 확립하고 있는 기업은, 신뢰성이 높고 인텔리전트한 에너지 솔루션에 대한 수요의 고조를 틈타고 있습니다. 연구개발에 전략적으로 주력함으로써 진화하는 시장 요구를 선점하고 현대의 요건에 맞춘 다양한 고성능 시스템을 공급하고 있습니다. 유틸리티 업그레이드와 스마트 인프라 프로젝트가 탄력을 받는 가운데 폭넓은 포트폴리오와 혁신 주도의 접근 방식을 가진 주요 기업들은 시장의 다음 성장 단계를 선도하는 입장에 있습니다.
목차
제1장 조사 방법 및 범위
제2장 주요 요약
제3장 업계 인사이트
- 생태계 분석
- 트럼프 정권의 관세 분석
- 무역에 미치는 영향
- 무역량의 혼란
- 보복 조치
- 업계에 미치는 영향
- 공급측의 영향(원재료)
- 주요 원재료의 가격 변동
- 공급망 재구성
- 생산 비용에 미치는 영향
- 수요측의 영향(판매가격)
- 최종 시장에 대한 가격 전달
- 시장 점유율 동향
- 소비자의 반응 패턴
- 공급측의 영향(원재료)
- 영향을 받는 주요 기업
- 전략적인 업계 대응
- 공급망 재구성
- 가격 설정 및 제품 전략
- 정책관여
- 전망 및 향후 검토 사항
- 무역에 미치는 영향
- 규제 상황
- 업계에 미치는 영향요인
- 성장 촉진요인
- 업계의 잠재적 위험 및 과제
- 성장 가능성 분석
- Porter's Five Forces 분석
- PESTEL 분석
제4장 경쟁 구도
- 전략적 대시보드
- 혁신 및 지속가능성의 정세
제5장 시장 규모 및 예측 : 유형별(2021-2034년)
- 주요 동향
- 오픈 트랜지션
- 클로즈드 트랜지션
제6장 시장 규모 및 예측 : 전압별(2021-2034년)
- 주요 동향
- 저
- 중
제7장 시장 규모 및 예측 : 용도별(2021-2034년)
- 주요 동향
- 프라임
- 비상용
- 피크 쉐이브
제8장 시장 규모 및 예측 : 최종 용도별(2021-2034년)
- 주요 동향
- 산업
- 상업용
- IT 및 통신
- 헬스케어
- 기타
제9장 시장 규모 및 예측 : 지역별(2021-2034년)
- 주요 동향
- 북미
- 미국
- 캐나다
- 멕시코
- 유럽
- 영국
- 프랑스
- 독일
- 이탈리아
- 러시아
- 스페인
- 아시아태평양
- 중국
- 호주
- 인도
- 일본
- 한국
- 중동 및 아프리카
- 사우디아라비아
- 아랍에미리트(UAE)
- 튀르키예
- 남아프리카
- 이집트
- 라틴아메리카
- 브라질
- 아르헨티나
제10장 기업 프로파일
- ABB
- Caterpillar
- Cummins
- Eaton
- Enercon Engineering
- General Electric
- Industrial Electric MFG.
- KDM Steel
- Kohler
- Nixon Power Services
- Rolls-Royce(MTU Onsite Energy)
- Schneider Electric
- Siemens
- Thomson Power Systems
The Global Paralleling Switchgear Market was valued at USD 1.18 billion in 2024 and is estimated to grow at a CAGR of 6% to reach USD 2.1 billion by 2034. This upward trend is largely fueled by the increasing demand for continuous and efficient power distribution across various industries. As modern infrastructures continue to expand, the importance of maintaining a reliable power supply has become critical. Facilities across multiple sectors are adopting systems that ensure consistent electricity flow and mitigate risks associated with power failures. The adoption of paralleling switchgear has surged as it helps synchronize multiple power sources and maintain stability across electrical loads, particularly in environments where power continuity is essential.

These systems are designed to integrate several power generation units with the utility grid, allowing seamless transitions between sources while optimizing energy distribution and minimizing downtime. This technology is becoming an indispensable component in highly sensitive operational settings, where even the slightest interruption can result in major performance disruptions or financial losses. The increasing reliance on intelligent power management solutions that support load balancing, redundancy, and operational efficiency is propelling the market forward. As power demands rise in urban and industrial regions, the use of paralleling switchgear ensures facilities remain resilient and capable of withstanding grid fluctuations or outages.
| Market Scope | |
|---|---|
| Start Year | 2024 |
| Forecast Year | 2025-2034 |
| Start Value | $1.18 Billion |
| Forecast Value | $2.1 Billion |
| CAGR | 6% |
Another key growth driver is the growing use of backup power systems. As operations scale up in size and complexity, there is a stronger emphasis on maintaining uninterrupted electricity for critical processes. Backup systems are now widely integrated into large buildings, labs, and institutional facilities, often involving multiple generator units. Paralleling switchgear plays a vital role in facilitating this integration by enabling automatic or manual synchronization and load-sharing, which ensures a seamless power transfer during main supply disruptions. The ability to switch effortlessly between primary and secondary sources without halting operations has become a strategic advantage in business continuity planning.
Within the broader market, the low voltage segment is anticipated to witness a CAGR exceeding 6% through 2034. This segment is gaining traction as industries increasingly seek solutions that offer both safety and performance. The emphasis on streamlined energy usage, automation, and smarter factory environments is boosting demand for low voltage paralleling switchgear. As industries transition toward more digitized and efficient operations, these systems are helping manage and distribute electricity more safely and reliably, even in high-load applications. Their role in supporting operational consistency while minimizing energy waste has made them a preferred choice across various manufacturing and processing industries.
Regionally, the United States has demonstrated steady market growth over recent years. The country's paralleling switchgear market stood at USD 168.3 million in 2022, rose to USD 175.9 million in 2023, and further reached USD 184.3 million in 2024. This consistent rise reflects the increasing demand for robust power infrastructure that can support mission-critical activities across sectors. The need for uninterrupted power supply in technologically advanced and infrastructure-heavy environments continues to drive product adoption. The market outlook remains positive as facilities expand and adopt more resilient and adaptable energy management systems.
Key industry players are reinforcing their positions by offering technologically advanced solutions and deepening their presence in critical infrastructure projects. Companies with established expertise in power systems and automation are capitalizing on the rising demand for dependable and intelligent energy solutions. Their strategic focus on research and development has enabled them to stay ahead of evolving market needs, supplying a diverse range of high-performance systems tailored to modern requirements. As utility upgrades and smart infrastructure projects gain momentum, companies with a broad portfolio and innovation-driven approach are well-positioned to lead the next phase of market growth.
Table of Contents
Chapter 1 Methodology & Scope
- 1.1 Market definitions
- 1.2 Base estimates & calculations
- 1.3 Forecast calculation
- 1.4 Data sources
- 1.4.1 Primary
- 1.4.2 Secondary
- 1.4.2.1 Paid
- 1.4.2.2 Public
Chapter 2 Executive Summary
- 2.1 Industry synopsis, 2021 – 2034
Chapter 3 Industry Insights
- 3.1 Industry ecosystem analysis
- 3.2 Trump administration tariff analysis
- 3.2.1 Impact on trade
- 3.2.1.1 Trade volume disruptions
- 3.2.1.2 Retaliatory measures
- 3.2.2 Impact on the industry
- 3.2.2.1 Supply-side impact (raw materials)
- 3.2.2.1.1 Price volatility in key materials
- 3.2.2.1.2 Supply chain restructuring
- 3.2.2.1.3 Production cost implications
- 3.2.2.2 Demand-side impact (selling price)
- 3.2.2.2.1 Price transmission to end markets
- 3.2.2.2.2 Market share dynamics
- 3.2.2.2.3 Consumer response patterns
- 3.2.2.1 Supply-side impact (raw materials)
- 3.2.3 Key companies impacted
- 3.2.4 Strategic industry responses
- 3.2.4.1 Supply chain reconfiguration
- 3.2.4.2 Pricing and product strategies
- 3.2.4.3 Policy engagement
- 3.2.5 Outlook and future considerations
- 3.2.1 Impact on trade
- 3.3 Regulatory landscape
- 3.4 Industry impact forces
- 3.4.1 Growth drivers
- 3.4.2 Industry pitfalls & challenges
- 3.5 Growth potential analysis
- 3.6 Porter's analysis
- 3.6.1 Bargaining power of suppliers
- 3.6.2 Bargaining power of buyers
- 3.6.3 Threat of new entrants
- 3.6.4 Threat of substitutes
- 3.7 PESTEL analysis
Chapter 4 Competitive Landscape, 2024
- 4.1 Strategic dashboard
- 4.2 Innovation & sustainability landscape
Chapter 5 Market Size and Forecast, By Type, 2021 - 2034 (USD Million)
- 5.1 Key trends
- 5.2 Open transition
- 5.3 Closed transition
Chapter 6 Market Size and Forecast, By Voltage, 2021 - 2034 (USD Million)
- 6.1 Key trends
- 6.2 Low
- 6.3 Medium
Chapter 7 Market Size and Forecast, By Application, 2021 - 2034 (USD Million)
- 7.1 Key trends
- 7.2 Prime
- 7.3 Standby
- 7.4 Peak shave
Chapter 8 Market Size and Forecast, By End Use, 2021 - 2034 (USD Million)
- 8.1 Key trends
- 8.2 Industrial
- 8.3 Commercial
- 8.3.1 IT & Telecom
- 8.3.2 Healthcare
- 8.3.3 Others
Chapter 9 Market Size and Forecast, By Region, 2021 - 2034 (USD Million)
- 9.1 Key trends
- 9.2 North America
- 9.2.1 U.S.
- 9.2.2 Canada
- 9.2.3 Mexico
- 9.3 Europe
- 9.3.1 UK
- 9.3.2 France
- 9.3.3 Germany
- 9.3.4 Italy
- 9.3.5 Russia
- 9.3.6 Spain
- 9.4 Asia Pacific
- 9.4.1 China
- 9.4.2 Australia
- 9.4.3 India
- 9.4.4 Japan
- 9.4.5 South Korea
- 9.5 Middle East & Africa
- 9.5.1 Saudi Arabia
- 9.5.2 UAE
- 9.5.3 Turkey
- 9.5.4 South Africa
- 9.5.5 Egypt
- 9.6 Latin America
- 9.6.1 Brazil
- 9.6.2 Argentina
Chapter 10 Company Profiles
- 10.1 ABB
- 10.2 Caterpillar
- 10.3 Cummins
- 10.4 Eaton
- 10.5 Enercon Engineering
- 10.6 General Electric
- 10.7 Industrial Electric MFG.
- 10.8 KDM Steel
- 10.9 Kohler
- 10.10 Nixon Power Services
- 10.11 Rolls-Royce (MTU Onsite Energy)
- 10.12 Schneider Electric
- 10.13 Siemens
- 10.14 Thomson Power Systems