
|
시장보고서
상품코드
1750536
스마트 가스 미터 시장 : 시장 기회, 성장 촉진요인, 산업 동향 분석, 예측(2025-2034년)Smart Gas Meters Market Opportunity, Growth Drivers, Industry Trend Analysis, and Forecast 2025 - 2034 |
||||||
세계의 스마트 가스 미터 시장 규모는 2024년에는 66억 달러로 평가되었고, CAGR 16.9%로 성장할 전망이며, 2034년에는 315억 달러에 이를 것으로 추정됩니다.
이 성장 궤도는 주로 정확한 청구, 보다 좋은 소비 감시, 실시간으로 손실을 검출하는 능력에 대한 수요 증가가 원동력이 되고 있습니다. 공익사업자가 업무 효율화를 추진하는 가운데 스마트 미터링 시스템은 특히 주택 및 상업 사용자 사이에서 큰 지지를 받고 있습니다. 에너지 사용에 대한 소비자 의식의 고조는, 선진 기술의 통합과 함께, 다양한 분야에서 이러한 미터의 채용을 한층 더 가속시키고 있습니다. 다양한 지역의 정부도 공익사업 인프라의 디지털화를 추진하고 있으며, 민간 및 공공 양측의 이해관계자가 지능형 가스 미터 시스템에 투자하는 강력한 인센티브가 되고 있습니다. 이러한 미터를 통해 사용자는 가스 사용량을 실시간으로 모니터링하여 에너지 소비를 최적화하고 최종적으로는 월 청구액을 줄일 수 있습니다. 게다가 보다 지속 가능하고 환경을 배려한 에너지 소비로의 시프트가, 에너지의 설명 책임과 투명성을 높이는 시스템의 채용을 각 산업에 재촉하고 있습니다.
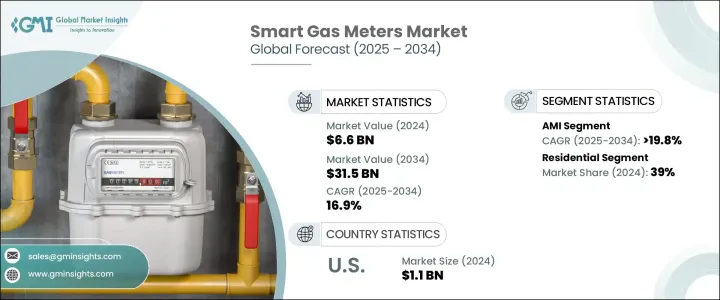
이 시장은 기술별로 고도계측 인프라(AMI) 및 자동검침(AMR)으로 분류됩니다. 그 중에서도 AMI 분야는 현저한 성장을 이루고 있으며, 예측 기간 중의 CAGR은 19.8%를 넘을 것으로 예측되고 있습니다. 이러한 성장은 보다 광범위한 국가와 지역의 현대화 이니셔티브의 일환으로 스마트 인프라가 널리 전개되고 있기 때문입니다. AMI 솔루션은 유틸리티 기업과 최종 사용자 간의 양방향 통신을 제공하여 가스 사용량을 보다 역동적으로 제어하고 실시간 데이터 수집을 가능하게 합니다. 이러한 기능은 신속한 문제 해결을 지원할 뿐만 아니라 에너지 관리 개선 및 유틸리티자의 장기적인 비용 절감에도 기여합니다. 유틸리티 기업이 디지털 전환에 대한 투자를 계속하고 있는 가운데, AMI는 향후 수년간 기술 전망을 지배할 것으로 예측됩니다.
| 시장 범위 | |
|---|---|
| 시작 연도 | 2024년 |
| 예측 연도 | 2025-2034년 |
| 시작 금액 | 66억 달러 |
| 예측 금액 | 315억 달러 |
| CAGR | 16.9% |
스마트 가스 미터 시장은 용도별로는 상업, 주택, 유틸리티로 구분됩니다. 주택 분야는 2024년 세계 시장 점유율의 약 39%를 차지했으며, 다른 모든 분야를 선도하고 있습니다. 소비자는 에너지 사용 상황을 실시간으로 파악하기를 요구하게 되어 있고, 스마트 미터는 이를 위해 필요한 도구를 제공합니다. 가정이 소비량의 삭감과 에너지 효율의 향상을 목표로 하는 가운데, 인텔리전트 가스 미터 솔루션에 대한 수요는 계속 높아지고 있습니다. 보다 클린한 에너지원으로의 전환의 동향과 함께, 지원적인 규제 정책이나 인센티브도, 이 부문의 확대에 크게 기여하고 있습니다. 스마트 미터가 제공하는 편리성과 비용 대비 효과에 의해, 주택 분야에서는 특히 매력적인 것이 되어, 보급을 뒷받침하고 있습니다.
미국은 세계 상황에서 중요한 시장으로 부상하고 있으며, 그 시장 상황은 2022년에 8억 달러, 2023년에 9억 달러, 2024년에는 11억 달러에 이른 것으로 평가되고 있습니다. 이 나라에서는, 미터 시스템의 급속한 기술 진보를 볼 수 있어 보다 깨끗한 에너지 관행에의 추진이 높아지고 있습니다. 이러한 개발에 의해, 공익 사업자는 기존의 인프라를 보다 스마트한 것으로 업그레이드하도록 요구되고 있습니다. 미국에서의 스마트 미터 채용은 환경 목표와 송전망의 신뢰성 및 효율을 높일 필요성 양쪽 모두에 의해 촉진되고 있습니다. 전력회사와 소비자 사이에서 이러한 미터기가 받아들여지고 있기 때문에, 미국 시장은 당분간, 강력한 상승 기조를 유지할 것으로 예상됩니다.
경쟁 구도는 중간 정도로 집중되어 있으며 대형 5개사가 총 시장의 약 35%의 점유율을 차지하고 있습니다. 이러한 주요 기업은, 시장에서의 존재감을 높이기 위해, 제조 능력의 확대, 기술 제공의 강화, 광범위한 세계 공급망의 구축에 주력하고 있습니다. 세계의 지속 가능성 목표에 따른 혁신적인 계측 기술을 도입하기 위해 연구 개발에 많은 투자가 이루어지고 있습니다. 에너지 프로바이더나 하이테크 기업과의 전략적 제휴는, 이러한 시장 리더에게 있어서, 대규모 계약을 확보하기 위한 일반적인 루트가 되고 있습니다. 게다가 현지 생산과 뛰어난 애프터서비스가 중시되어 배치의 신속화와 및 고객 만족도 향상에 도움이 되고 있습니다.
목차
제1장 조사 방법 및 범위
제2장 주요 요약
제3장 업계 인사이트
- 업계 에코시스템
- 트럼프 정권의 관세 분석
- 무역에 미치는 영향
- 무역량의 혼란
- 보복 조치
- 업계에 미치는 영향
- 공급측의 영향(원재료)
- 주요 원재료의 가격 변동
- 공급망 재구성
- 생산 비용에 미치는 영향
- 수요측의 영향(판매가격)
- 최종 시장에 대한 가격 전달
- 시장 점유율 동향
- 소비자의 반응 패턴
- 공급측의 영향(원재료)
- 영향을 받는 주요 기업
- 전략적인 업계 대응
- 공급망 재구성
- 가격 설정 및 제품 전략
- 정책관여
- 전망 및 향후 검토 사항
- 무역에 미치는 영향
- 규제 상황
- 업계에 미치는 영향요인
- 성장 촉진요인
- 업계의 잠재적 위험 및 과제
- 성장 가능성 분석
- Porter's Five Forces 분석
- PESTEL 분석
제4장 경쟁 구도
- 서문
- 기업의 시장 점유율
- 전략적 대시보드
- 전략적 노력
- 경쟁 벤치마킹
- 혁신 및 지속가능성의 정세
제5장 시장 규모 및 예측 : 기술별(2021-2034년)
- 주요 동향
- 아미
- AMR
제6장 시장 규모 및 예측 : 용도별(2021-2034년)
- 주요 동향
- 주택용
- 상업용
- 유틸리티
제7장 시장 규모 및 예측 : 지역별(2021-2034년)
- 주요 동향
- 북미
- 미국
- 캐나다
- 유럽
- 독일
- 영국
- 프랑스
- 스웨덴
- 이탈리아
- 아시아태평양
- 중국
- 일본
- 인도
- 한국
- 호주
- 중동 및 아프리카
- 아랍에미리트(UAE)
- 사우디아라비아
- 남아프리카
- 이집트
- 라틴아메리카
- 브라질
- 멕시코
- 아르헨티나
제8장 기업 프로파일
- Aclara Technologies
- Apator
- Azbil Kimmon
- Chint Group
- Honeywell International
- Itron
- Landis Gyr
- Neptune Technology Group
- Osaki Electric
- Raychem RPG
- Schneider Electric
- Sensus
- Wasion Group
- Zenner International
The Global Smart Gas Meters Market was valued at USD 6.6 billion in 2024 and is estimated to grow at a CAGR of 16.9% to reach USD 31.5 billion by 2034. This growth trajectory is primarily driven by increasing demand for accurate billing, better consumption monitoring, and the ability to detect losses in real time. As utility providers push for operational efficiency, smart metering systems are gaining significant traction, especially among residential and commercial users. Rising consumer awareness about energy usage, along with the integration of advanced technologies, is further accelerating the adoption of these meters across diverse sectors. Governments across various regions are also promoting digitalization in utility infrastructure, providing a strong incentive for both private and public stakeholders to invest in intelligent gas metering systems. These meters enable users to monitor real-time gas usage, optimize energy consumption, and ultimately reduce monthly bills, which adds considerable value to consumers and providers alike. Additionally, the shift toward more sustainable and environmentally conscious energy consumption is pushing industries to adopt systems that enhance energy accountability and transparency.

The market is categorized by technology into Advanced Metering Infrastructure (AMI) and Automatic Meter Reading (AMR). Among these, the AMI segment is poised for remarkable growth, projected to register a CAGR exceeding 19.8% during the forecast period. This growth is attributed to widespread rollouts of smart infrastructure as part of broader national and regional modernization initiatives. AMI solutions offer two-way communication between utilities and end-users, enabling more dynamic control over gas usage and real-time data collection. These capabilities not only support faster issue resolution but also contribute to improved energy management and long-term cost savings for utility providers. As utilities continue investing in digital transformation, AMI is expected to dominate the technology landscape in the coming years.
| Market Scope | |
|---|---|
| Start Year | 2024 |
| Forecast Year | 2025-2034 |
| Start Value | $6.6 Billion |
| Forecast Value | $31.5 Billion |
| CAGR | 16.9% |
In terms of application, the smart gas meters market is segmented into commercial, residential, and utility sectors. The residential segment accounted for approximately 39% of the global market share in 2024, leading all other segments. Consumers are increasingly seeking real-time visibility into their energy usage, and smart meters provide the tools needed to achieve that. As households aim to reduce consumption and become more energy-efficient, the demand for intelligent gas metering solutions continues to climb. Supportive regulatory policies and incentives, along with the trend of switching to cleaner energy sources, are also contributing significantly to the expansion of this segment. The convenience and cost-effectiveness offered by smart meters make them particularly appealing in the residential space, driving widespread adoption.
The United States has emerged as a key market in the global landscape, with its smart gas meters market valued at USD 800 million in 2022, USD 900 million in 2023, and reaching USD 1.1 billion in 2024. The country is witnessing rapid technological advancements in metering systems and a growing push toward cleaner energy practices. These developments are prompting utility providers to upgrade existing infrastructure with smarter alternatives. The adoption of smart meters in the US is being fueled by both environmental goals and the need to enhance grid reliability and efficiency. The growing acceptance of these meters among utility firms and consumers alike is expected to keep the US market on a strong upward path in the foreseeable future.
The competitive landscape of the smart gas meters market is moderately concentrated, with five major players collectively holding about 35% of the total market share. These key companies are focusing on expanding their manufacturing capabilities, enhancing their technological offerings, and building extensive global supply chains to strengthen their market presence. Significant investments are being funneled into research and development to introduce innovative metering technologies that align with global sustainability goals. Strategic collaborations with energy providers and tech firms are becoming a popular route for these market leaders to secure large-scale contracts. Additionally, there is a strong emphasis on local production and superior after-sales services, which help speed up deployment and improve customer satisfaction.
Table of Contents
Chapter 1 Methodology & Scope
- 1.1 Research design
- 1.2 Base estimates & calculations
- 1.3 Forecast calculation
- 1.4 Primary research & validation
- 1.4.1 Primary sources
- 1.4.2 Data mining sources
- 1.5 Market definitions
Chapter 2 Executive Summary
- 2.1 Industry synopsis, 2021 - 2034
Chapter 3 Industry Insights
- 3.1 Industry ecosystem
- 3.2 Trump administration tariff analysis
- 3.2.1 Impact on trade
- 3.2.1.1 Trade volume disruptions
- 3.2.1.2 Retaliatory measures
- 3.2.2 Impact on the industry
- 3.2.2.1 Supply-side impact (raw materials)
- 3.2.2.1.1 Price volatility in key materials
- 3.2.2.1.2 Supply chain restructuring
- 3.2.2.1.3 Production cost implications
- 3.2.2.2 Demand-side impact (selling price)
- 3.2.2.2.1 Price transmission to end markets
- 3.2.2.2.2 Market share dynamics
- 3.2.2.2.3 Consumer response patterns
- 3.2.2.1 Supply-side impact (raw materials)
- 3.2.3 Key companies impacted
- 3.2.4 Strategic industry responses
- 3.2.4.1 Supply chain reconfiguration
- 3.2.4.2 Pricing and product strategies
- 3.2.4.3 Policy engagement
- 3.2.5 Outlook and future considerations
- 3.2.1 Impact on trade
- 3.3 Regulatory landscape
- 3.4 Industry impact forces
- 3.4.1 Growth drivers
- 3.4.2 Industry pitfalls & challenges
- 3.5 Growth potential analysis
- 3.6 Porter's analysis
- 3.6.1 Bargaining power of suppliers
- 3.6.2 Bargaining power of buyers
- 3.6.3 Threat of new entrants
- 3.6.4 Threat of substitutes
- 3.7 PESTEL analysis
Chapter 4 Competitive landscape, 2024
- 4.1 Introduction
- 4.2 Company market share
- 4.3 Strategic dashboard
- 4.4 Strategic initiative
- 4.5 Competitive benchmarking
- 4.6 Innovation & sustainability landscape
Chapter 5 Market Size and Forecast, By Technology, 2021 - 2034 (‘000 Units, USD Million)
- 5.1 Key trends
- 5.2 AMI
- 5.3 AMR
Chapter 6 Market Size and Forecast, By Application, 2021 - 2034 (‘000 Units, USD Million)
- 6.1 Key trends
- 6.2 Residential
- 6.3 Commercial
- 6.4 Utility
Chapter 7 Market Size and Forecast, By Region, 2021 - 2034 (‘000 Units, USD Million)
- 7.1 Key trends
- 7.2 North America
- 7.2.1 U.S.
- 7.2.2 Canada
- 7.3 Europe
- 7.3.1 Germany
- 7.3.2 UK
- 7.3.3 France
- 7.3.4 Sweden
- 7.3.5 Italy
- 7.4 Asia Pacific
- 7.4.1 China
- 7.4.2 Japan
- 7.4.3 India
- 7.4.4 South Korea
- 7.4.5 Australia
- 7.5 Middle East & Africa
- 7.5.1 UAE
- 7.5.2 Saudi Arabia
- 7.5.3 South Africa
- 7.5.4 Egypt
- 7.6 Latin America
- 7.6.1 Brazil
- 7.6.2 Mexico
- 7.6.3 Argentina
Chapter 8 Company Profiles
- 8.1 Aclara Technologies
- 8.2 Apator
- 8.3 Azbil Kimmon
- 8.4 Chint Group
- 8.5 Honeywell International
- 8.6 Itron
- 8.7 Landis+Gyr
- 8.8 Neptune Technology Group
- 8.9 Osaki Electric
- 8.10 Raychem RPG
- 8.11 Schneider Electric
- 8.12 Sensus
- 8.13 Wasion Group
- 8.14 Zenner International
