
|
시장보고서
상품코드
1766233
폭발물 처리 로봇 시장 기회, 성장 촉진요인, 산업 동향 분석, 예측(2025-2034년)Explosive Ordnance Disposal (EOD) Robots Market Opportunity, Growth Drivers, Industry Trend Analysis, and Forecast 2025 - 2034 |
||||||
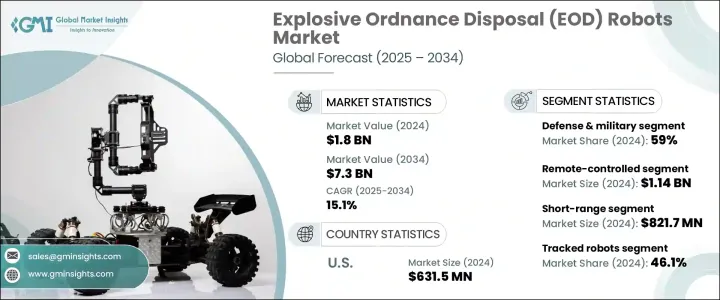
세계의 폭발물 처리 로봇 시장은 2024년에는 18억 달러로 평가되었고 CAGR 15.1%를 나타내며 2034년에는 73억 달러에 이를 것으로 추정됩니다.
이러한 시스템에 대한 수요의 급증은 세계 안보 위협의 빈도 증가와 각국 정부의 방위 투자 증가에 크게 관련되어 있습니다.

폭발물 처리 작업에서 로봇 공학의 통합은 더 이상 틈새 능력이 아니라 현대 군 및 안보 기관에 중요한 자산이 되고 있습니다. 로봇의 도입은 상황 인식과 의사결정을 강화할 뿐만 아니라 운영 비용과 인적 리스크를 대폭 줄여줍니다.
| 시장 범위 | |
|---|---|
| 시작 연도 | 2024년 |
| 예측 연도 | 2025-2034년 |
| 시작 금액 | 18억 달러 |
| 예측 금액 | 73억 달러 |
| CAGR | 15.1% |
EOD 로봇은 유형별로 원격조작형과 자율·반자율형으로 분류됩니다. 실시간 결정이 중요한 시나리오에서는 수동 제어가 필수적이며 운영자는 인간 명령에 즉각적으로 반응하는 시스템을 선호합니다.
최종 용도별로는 방위 및 군사 분야가 2024년 세계 시장 점유율의 59%를 차지해, 최대의 공헌자였습니다. 지휘·제어·통신·컴퓨터·정보·감시·정찰(C4ISR) 네트워크와의 제휴 강화에 가세해 전력 근대화에의 지속적인 투자가 이 부문의 리드를 한층 더 강화하고 있습니다.
EOD 로봇을 가동 범위별로 분류하면 단거리 로봇이 2024년에 8억 2,170만 달러로 시장을 석권했습니다. 컴팩트한 설계와 높은 기동성을 통해 국소적인 위협에 효과적인 툴을 필요로 하는 법집행기관, 제1응답자, 폭탄처리반에 최적입니다.
로봇은 추적형, 바퀴형, 다리형, 하이브리드형으로 분류됩니다. 이 중 추종형 로봇의 2024년 시장 점유율은 46.1%였습니다. 안정성이 특히 평가되고 있어 전투지역이나 폭발 후의 환경에서 특히 유용합니다.
미국은 세계 시장에서 큰 점유율을 차지하고 있으며, 2024년의 평가액은 6억 3,150만 달러였습니다. 왕성한 수요는 특히 국방부와 국토 안보부 등의 기관을 통해 연구 및 조달을 지원하는 정부의 이니셔티브에 의해 견인되고 있습니다.
폭발물 처리 로봇 시장 경쟁 구도에는 뛰어난 세계 기업과 민첩한 지역 제조업체가 모두 있습니다. 3Harris Technologies, Inc., QinetiQ, iRobot Corporation, Peraton 등 상위 4개 기업이 2024년 총 41.4%의 시장 점유율을 차지했습니다. 이에 따라 신흥 선수는 법 집행기관과 민간 경비의 틈새 용도에 맞는 전문적이고 비용 효율적인 솔루션을 제공함으로써 그 영역을 개척하고 있습니다.
목차
제1장 조사 방법과 범위
제2장 주요 요약
제3장 업계 인사이트
- 생태계 분석
- 공급자의 상황
- 이익률
- 비용 구조
- 각 단계에서의 부가가치
- 밸류체인에 영향을 주는 요인
- 파괴적 혁신
- 트럼프 정권의 관세 분석
- 무역에 미치는 영향
- 무역량의 혼란
- 보복 조치
- 업계에 미치는 영향
- 공급측의 영향
- 가격 변동
- 공급망 재구성
- 생산 비용에 미치는 영향
- 수요측의 영향
- 최종 시장에의 가격 전달
- 시장 점유율 동향
- 소비자의 반응 패턴
- 공급측의 영향
- 영향을 받는 주요 기업
- 전략적인 업계의 대응
- 공급망 재구성
- 가격 설정 및 제품 전략
- 정책관여
- 전망과 향후 검토 사항
- 무역에 미치는 영향
- 업계에 미치는 영향요인
- 성장 촉진요인
- 세계 방위비 증가
- 테러와 IED의 위협 증가
- 자율형 및 AI 구동형 기술의 도입
- 민간의 법 집행 기관 및 국토 안보에 있어서의 사용 확대
- 민간 보안 용도 증가
- 업계의 잠재적 위험 및 과제
- 고액의 취득·유지비
- 기술적 복잡성과 신뢰성에 대한 우려
- 시장 기회
- 성장 촉진요인
- 성장 가능성 분석
- 규제 상황
- 북미
- 유럽
- 아시아태평양
- 라틴아메리카
- 중동 및 아프리카
- Porter's Five Forces 분석
- PESTEL 분석
- 기술과 혁신의 상황
- 현재의 기술 동향
- 신흥기술
- 가격 동향
- 지역별
- 제품별
- 가격 전략
- 새로운 비즈니스 모델
- 규정 준수 요건
- 소비자 감정 분석
- 특허 및 지적재산 분석
- 지정학과 무역의 역학
제4장 경쟁 구도
- 서론
- 기업의 시장 점유율 분석
- 지역별
- 북미
- 유럽
- 아시아태평양
- 시장 집중 분석
- 지역별
- 주요 기업의 경쟁 벤치마킹
- 재무실적의 비교
- 수익
- 이익률
- 연구개발
- 제품 포트폴리오 비교
- 제품 라인업의 넓이
- 기술
- 파괴적 혁신
- 지리적 존재의 비교
- 세계 실적 분석
- 서비스 네트워크의 범위
- 지역별 시장 침투율
- 경쟁 포지셔닝 매트릭스
- 리더
- 챌린저
- 팔로워
- 틈새 기업
- 전략적 전망 매트릭스
- 재무실적의 비교
- 주요 발전(2021-2024년)
- 합병과 인수
- 파트너십 및 협업
- 기술적 진보
- 확대 및 투자 전략
- 디지털 변혁의 대처
- 신흥기업/스타트업기업경쟁 구도
제5장 시장 추계·예측 : 유형별(2021-2034년)
- 주요 동향
- 원격 제어
- 자율형/반자율형
제6장 시장 추계·예측 : 모빌리티별(2021-2034년)
- 주요 동향
- 추적 로봇
- 바퀴 달린 로봇
- 다리 로봇
- 하이브리드
제7장 시장 추계·예측 : 작전 범위별(2021-2034년)
- 주요 동향
- 단거리(500미터 미만)
- 중거리(500m-2km)
- 장거리(2km 이상)
제8장 시장 추계·예측 : 최종 용도별(2021-2034년)
- 주요 동향
- 국방 및 군사
- 법 집행
- 국토 안보
- 기타
제9장 시장 추계·예측 : 지역별(2021-2034년)
- 주요 동향
- 북미
- 미국
- 캐나다
- 유럽
- 영국
- 독일
- 프랑스
- 이탈리아
- 스페인
- 네덜란드
- 아시아태평양
- 중국
- 인도
- 일본
- 한국
- 호주
- 라틴아메리카
- 브라질
- 멕시코
- 중동 및 아프리카
- 남아프리카
- 사우디아라비아
- 아랍에미리트(UAE)
제10장 기업 프로파일
- Boston Dynamics
- Elbit Systems Ltd.
- Foxtech Robotics
- ICOR Technology
- iRobot Corporation
- L3Harris Technologies, Inc.
- Nex Robotics
- Peraton
- PIAP
- QinetiQ
- Reamda Ltd.
- Roboteam
- Shark Robotics
- SuperDroid Robots
- Teledyne FLIR LLC
The Global Explosive Ordnance Disposal Robots Market was valued at USD 1.8 billion in 2024 and is estimated to grow at a CAGR of 15.1% to reach USD 7.3 billion by 2034. The surge in demand for these systems is largely tied to the growing frequency of security threats worldwide and rising defense investments by governments. As threats evolve in complexity, nations are prioritizing the development and deployment of unmanned technologies to neutralize potential dangers while reducing risk to human lives.
The integration of robotics in explosive ordnance disposal tasks is no longer a niche capability but a critical asset for modern armed forces and security agencies. These robots are increasingly viewed as a frontline solution for tackling explosive hazards in unpredictable scenarios, making them indispensable in both battlefield and civilian operations. Their deployment not only enhances situational awareness and decision-making but also significantly cuts operational costs and personnel risk. As a result, procurement of robotic platforms continues to rise as militaries adapt to asymmetric threats and law enforcement looks for reliable tools in urban environments.
| Market Scope | |
|---|---|
| Start Year | 2024 |
| Forecast Year | 2025-2034 |
| Start Value | $1.8 Billion |
| Forecast Value | $7.3 Billion |
| CAGR | 15.1% |
Within the market, EOD robots are categorized by type into remote-controlled and autonomous/semi-autonomous variants. In 2024, remote-controlled robots led the market with a valuation of USD 1.14 billion. Their popularity is rooted in their reliability and affordability, which makes them accessible to a wide range of users, including tactical units and security agencies. Manual control remains essential in scenarios where real-time judgment is crucial, and operators prefer systems that respond instantly to human commands. These platforms are also relatively easier to operate, demand minimal regulatory clearance, and are widely preferred in deployments that require adaptability and real-time oversight.
In terms of end use, the defense and military sector was the leading contributor, accounting for 59% of the global market share in 2024. This dominance is driven by the sector's substantial reliance on robotic systems for tasks such as improvised explosive device (IED) neutralization, tactical reconnaissance, and logistical support in hostile environments. Armed forces across the globe are prioritizing the integration of robotics into their defense strategies to minimize soldier exposure and improve mission success rates. Ongoing investments in force modernization, alongside greater alignment with command, control, communications, computers, intelligence, surveillance, and reconnaissance (C4ISR) networks, are further strengthening this segment's lead.
When segmented by operational range, short-range EOD robots dominated the market with a value of USD 821.7 million in 2024. These robots are widely used in urban missions, restricted spaces, and civil operations due to their ease of mobility and suitability for fast-response deployments. Their compact designs and high maneuverability make them ideal for law enforcement, first responders, and bomb squads who need effective tools for localized threats. As security challenges grow in densely populated areas, the demand for such systems is expected to remain strong throughout the forecast period.
Mobility is another key area of segmentation, with robots being divided into tracked, wheeled, legged, and hybrid formats. Among these, tracked robots accounted for a 46.1% market share in 2024. These systems are particularly valued for their superior traction and stability on uneven or debris-filled terrain, which makes them especially useful in combat zones and post-explosion environments. Their rugged construction allows them to carry heavier payloads and operate in harsh conditions, making them the preferred choice for both military and tactical operations.
The United States represented a significant share of the global market, with a valuation of USD 631.5 million in 2024. The country's leadership in this space is fueled by its high defense spending, continuous overseas deployments, and strategic focus on protective technologies for military personnel. The robust demand for advanced EOD systems in the U.S. is also driven by government initiatives that support research and procurement, particularly through agencies such as the Department of Defense and Department of Homeland Security. Technological advancements in artificial intelligence and automation are further propelling the adoption of next-generation robotic solutions within national security frameworks.
The competitive landscape of the EOD robots market features both established global players and agile regional manufacturers. The top four companies-L3Harris Technologies, Inc., QinetiQ, iRobot Corporation, and Peraton-collectively held a market share of 41.4% in 2024. These leading firms benefit from long-term defense contracts, broad distribution networks, and ongoing investment in R&D. Their dominance is reinforced by strong relationships with government defense bodies and a track record of innovation in unmanned systems. Meanwhile, emerging players are carving out their space by offering specialized, cost-effective solutions tailored to niche applications in law enforcement and civilian security. Collaborative development efforts between private firms and public defense organizations are also accelerating product innovation and reshaping the dynamics of market competition.
Table of Contents
Chapter 1 Methodology & Scope
- 1.1 Market scope and definition
- 1.2 Research design
- 1.2.1 Research approach
- 1.2.2 Data collection methods
- 1.3 Data mining sources
- 1.3.1 Global
- 1.3.2 Regional/Country
- 1.4 Base estimates and calculations
- 1.4.1 Base year calculation
- 1.4.2 Key trends for market estimation
- 1.5 Primary research and validation
- 1.5.1 Primary sources
- 1.6 Forecast model
- 1.7 Research assumptions and limitations
Chapter 2 Executive Summary
- 2.1 Industry 3600 synopsis
- 2.2 Key market trends
- 2.2.1 Type trends
- 2.2.2 Mobility trends
- 2.2.3 Operational range trends
- 2.2.4 End use trends
- 2.2.5 Regional trends
- 2.3 TAM Analysis, 2025-2034 (USD Million)
- 2.4 CXO perspectives: Strategic imperatives
- 2.4.1 Executive decision points
- 2.4.2 Critical success factors
- 2.5 Future Outlook and Strategic Recommendations
Chapter 3 Industry Insights
- 3.1 Industry ecosystem analysis
- 3.1.1 Supplier landscape
- 3.1.2 Profit margin
- 3.1.3 Cost structure
- 3.1.4 Value addition at each stage
- 3.1.5 Factor affecting the value chain
- 3.1.6 Disruptions
- 3.2 Trump administration tariffs analysis
- 3.2.1 Impact on trade
- 3.2.1.1 Trade volume disruptions
- 3.2.1.2 Retaliatory measures
- 3.2.2 Impact on the industry
- 3.2.2.1 Supply-side impact
- 3.2.2.1.1 Price volatility in
- 3.2.2.1.2 Supply chain restructuring
- 3.2.2.1.3 Production cost implications
- 3.2.2.2 Demand-side impact
- 3.2.2.2.1 Price transmission to end markets
- 3.2.2.2.2 Market share dynamics
- 3.2.2.2.3 Consumer response patterns
- 3.2.2.1 Supply-side impact
- 3.2.3 key companies impacted
- 3.2.4 strategic industry responses
- 3.2.4.1 Supply chain reconfiguration
- 3.2.4.2 Pricing and product strategies
- 3.2.4.3 Policy engagement
- 3.2.5 Outlook and future considerations
- 3.2.1 Impact on trade
- 3.3 Industry impact forces
- 3.3.1 Growth drivers
- 3.3.1.1 Rising global defense expenditures
- 3.3.1.2 Growing incidences of terrorism & IED threats
- 3.3.1.3 Adoption of autonomous & AI-driven technologies
- 3.3.1.4 Expanding use in civilian law enforcement & homeland security
- 3.3.1.5 Rising civil security applications
- 3.3.2 Industry pitfalls and challenges
- 3.3.2.1 High acquisition and maintenance costs
- 3.3.2.2 Technical complexity & reliability concerns
- 3.3.3 Market opportunities
- 3.3.1 Growth drivers
- 3.4 Growth potential analysis
- 3.5 Regulatory landscape
- 3.5.1 North America
- 3.5.2 Europe
- 3.5.3 Asia Pacific
- 3.5.4 Latin America
- 3.5.5 Middle East & Africa
- 3.6 Porter's analysis
- 3.7 PESTEL analysis
- 3.8 Technology and innovation landscape
- 3.8.1 Current technological trends
- 3.8.2 Emerging technologies
- 3.9 Price trends
- 3.9.1 By region
- 3.9.2 By product
- 3.10 Pricing strategies
- 3.11 Emerging business models
- 3.12 Compliance requirements
- 3.13 Consumer sentiment analysis
- 3.14 Patent and IP analysis
- 3.15 Geopolitical and trade dynamics
Chapter 4 Competitive Landscape, 2024
- 4.1 Introduction
- 4.2 Company market share analysis
- 4.2.1 By region
- 4.2.1.1 North America
- 4.2.1.2 Europe
- 4.2.1.3 Asia Pacific
- 4.2.2 Market concentration analysis
- 4.2.1 By region
- 4.3 Competitive benchmarking of key players
- 4.3.1 Financial performance comparison
- 4.3.1.1 Revenue
- 4.3.1.2 Profit margin
- 4.3.1.3 R&D
- 4.3.2 Product portfolio comparison
- 4.3.2.1 Product range breadth
- 4.3.2.2 Technology
- 4.3.2.3 Innovation
- 4.3.3 Geographic presence comparison
- 4.3.3.1 Global footprint analysis
- 4.3.3.2 Service network coverage
- 4.3.3.3 Market penetration by region
- 4.3.4 Competitive positioning matrix
- 4.3.4.1 Leaders
- 4.3.4.2 Challengers
- 4.3.4.3 Followers
- 4.3.4.4 Niche players
- 4.3.5 Strategic outlook matrix
- 4.3.1 Financial performance comparison
- 4.4 Key developments, 2021-2024
- 4.4.1 Mergers and acquisitions
- 4.4.2 Partnerships and collaborations
- 4.4.3 Technological advancements
- 4.4.4 Expansion and investment strategies
- 4.4.5 Digital transformation initiatives
- 4.5 Emerging/ startup competitors landscape
Chapter 5 Market Estimates & Forecast, By Type, 2021-2034 (USD Million & Units)
- 5.1 Key trends
- 5.2 Remote controlled
- 5.3 Autonomous/semi-autonomous
Chapter 6 Market Estimates & Forecast, By Mobility, 2021-2034 (USD Million & Units)
- 6.1 Key trends
- 6.2 Tracked robots
- 6.3 Wheeled robots
- 6.4 Legged robots
- 6.5 Hybrid
Chapter 7 Market Estimates & Forecast, By Operational Range, 2021-2034 (USD Million & Units)
- 7.1 Key trends
- 7.2 Short-range (<500 meters)
- 7.3 Medium-range (500m – 2 km)
- 7.4 Long-range (>2 km)
Chapter 8 Market Estimates & Forecast, By End Use, 2021-2034 (USD Million & Units)
- 8.1 Key trends
- 8.2 Defense & military
- 8.3 Law enforcement
- 8.4 Homeland security
- 8.5 Others
Chapter 9 Market Estimates & Forecast, By Region, 2021-2034 (USD Million & Units)
- 9.1 Key trends
- 9.2 North America
- 9.2.1 U.S.
- 9.2.2 Canada
- 9.3 Europe
- 9.3.1 UK
- 9.3.2 Germany
- 9.3.3 France
- 9.3.4 Italy
- 9.3.5 Spain
- 9.3.6 Netherlands
- 9.4 Asia Pacific
- 9.4.1 China
- 9.4.2 India
- 9.4.3 Japan
- 9.4.4 South Korea
- 9.4.5 Australia
- 9.5 Latin America
- 9.5.1 Brazil
- 9.5.2 Mexico
- 9.6 MEA
- 9.6.1 South Africa
- 9.6.2 Saudi Arabia
- 9.6.3 UAE
Chapter 10 Company Profiles
- 10.1 Boston Dynamics
- 10.2 Elbit Systems Ltd.
- 10.3 Foxtech Robotics
- 10.4 ICOR Technology
- 10.5 iRobot Corporation
- 10.6 L3Harris Technologies, Inc.
- 10.7 Nex Robotics
- 10.8 Peraton
- 10.9 PIAP
- 10.10 QinetiQ
- 10.11 Reamda Ltd.
- 10.12 Roboteam
- 10.13 Shark Robotics
- 10.14 SuperDroid Robots
- 10.15 Teledyne FLIR LLC
