


|
시장보고서
상품코드
1766316
유틸리티 배전반 시장(2025-2034년) : 기회, 성장 촉진요인, 업계 동향 분석, 예측Utility Distribution Panel Market Opportunity, Growth Drivers, Industry Trend Analysis, and Forecast 2025 - 2034 |
||||||
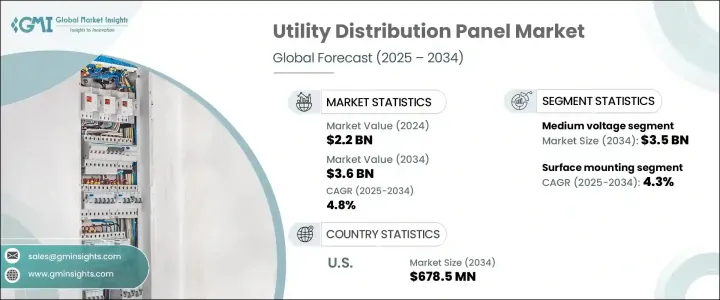
세계의 유틸리티 배전반 시장 규모는 2024년에 22억 달러에 달하였으며, CAGR 4.8%로 성장하여 2034년까지 36억 달러에 이를 것으로 예측되고 있습니다.
이 성장의 주요 요인은 에너지 수요의 변화, 지속적인 인프라 개발, 송전망의 안전성과 신뢰성 향상에 대한 요구 고조를 들 수 있습니다. 현대적이고 지능적인 배전 프레임워크에 대한 수요가 지속적으로 늘어나고 있습니다.

기술 혁신은 기존의 배전반을 재구성하는데 있어서 중요한 원동력이 되고 있습니다. 유틸리티 배전반 시스템은 여러 전원 공급 장치에서 에너지 흐름을 지원하기 위해 더 높은 유연성과 쉬운 재구성 기능을 제공할 것으로 기대됩니다.
| 시장 범위 | |
|---|---|
| 시작 연도 | 2024년 |
| 예측 연도 | 2025-2034년 |
| 시작 금액 | 22억 달러 |
| 예측 금액 | 36억 달러 |
| CAGR | 4.8% |
이 시장은 에너지 효율의 의무화와 안전 기준의 진화에도 영향을 받고 있습니다. 따라서 스마트 기능과 IoT(사물인터넷)와의 통합이 중요해지고 있습니다.
또한 다양한 부문에 배치되는 배전반의 유형과 크기에도 현저한 변화가 일어나고 있습니다. 고전압 패널은 시스템의 안정성을 높여 운영 위험을 줄이고 최신 자동화 시스템과 원활하게 통합할 수 있도록 설계되었습니다.
설치 형태는 유틸리티 배전반 분야에서의 구매 결정을 좌우하는 중요한 요소입니다. 2024년 시장 점유율은 표면 실장형이 51%를 차지하였고 2034년까지의 CAGR은 4.3%로 예측되고 있습니다. 표면 실장 패널은 설치의 용이성, 접근성, 전반적인 실용성으로 인해 산업 환경에서 선호되는 경우가 많습니다. 이 패널은 엄격한 사용 조건을 견디는 견고하고 내구성있는 설치가 요구되는 수요가 높은 환경에 적합합니다. 한편, 플래시 마운트 패널은 미관과 공간의 유효한 활용이 최우선되는 상업 및 주택 분야에서 인기를 모으고 있습니다. 인테리어에 어울리는 합리적인 외관을 유지할 수 있기 때문에 특히 신축 스마트 빌딩과 고급 부동산 프로젝트에 대한 수요가 높아지고 있습니다.
미국은 유틸리티 배전반 업계 전반에 걸쳐 일관되고 강력한 성장을 보이고 있습니다. 2022년 시장 규모는 4억 1,000만 달러였으나 2023년에는 4억 3,880만 달러로 증가했으며, 2024년에는 4억 6,680만 달러로 더욱 증가했습니다. 앞으로 미국 시장은 2034년까지 6억 7,850만 달러로 성장할 것으로 예측됩니다. 이러한 증가 추세는 인프라 현대화를 위한 많은 투자, 스마트 그리드 기술의 광범위한 채택, 에너지 효율 목표 달성을 위한 국가의 확고한 노력 때문입니다. 디지털 전환과 노후화된 송전망 컴포넌트의 현대화에 중점을 둔 지속적인 노력은 미래의 시장 확대를 위한 비옥한 토양을 형성하고 있습니다. 북미는 견고한 전력망과 선진 기술의 도입에 힘입어 북미 시장의 성장에 가장 기여하고 있는 지역입니다.
업계 경쟁은 치열해지고 있으며, 제조업체는 기술 혁신, 제품 다양화, 고성장 지역 진출을 통해 시장 점유율 확보에 노력하고 있습니다. 시장은 점점 세분화되고 있으며 여러 수직 시장에 걸쳐 혁신이 일어나고 있습니다.
목차
제1장 조사 방법과 범위
제2장 주요 요약
제3장 업계 인사이트
- 업계 생태계 분석
- 규제 상황
- 업계에 미치는 영향요인
- 성장 촉진요인
- 업계의 잠재적 리스크 및 과제
- 성장 가능성 분석
- Porter's Five Forces 분석
- PESTEL 분석
제4장 경쟁 구도
- 경쟁 구도
- 기업의 시장 점유율 분석
- 전략적 노력
- 경쟁 벤치마킹
- 전략적 대시보드
- 혁신과 기술의 상황
제5장 시장 규모와 예측 : 전압별(2021-2034년)
- 주요 동향
- 저전압
- 중전압
제6장 시장 규모와 예측 : 설치별(2021-2034년)
- 주요 동향
- 플래시 마운트
- 표면 실장
제7장 시장 규모와 예측 : 지역별(2021-2034년)
- 주요 동향
- 북미
- 미국
- 캐나다
- 유럽
- 영국
- 프랑스
- 독일
- 러시아
- 이탈리아
- 아시아태평양
- 중국
- 호주
- 인도
- 일본
- 한국
- 중동 및 아프리카
- 사우디아라비아
- 아랍에미리트(UAE)
- 카타르
- 남아프리카
- 이집트
- 라틴아메리카
- 브라질
- 아르헨티나
- 멕시코
제8장 기업 프로파일
- ABB
- Ags
- alfanar Group
- Arranger Electric Co., Ltd
- CSE Solutions Pvt. Ltd.
- Eaton
- EAMFCO
- ESL POWER SYSTEMS, INC.
- General Electric
- Hager Group
- INDUSTRIAL ELECTRIC MFG
- Larsen &Toubro Limited
- Legrand
- Meba Electric Co., Ltd
- NHP
- Norelco
- Paneltronics
- R Baker
- Schneider Electric
- Siemens
- Symbiotic Systems
The Global Utility Distribution Panel Market was valued at USD 2.2 billion in 2024 and is estimated to grow at a CAGR of 4.8% to reach USD 3.6 billion by 2034. This growth is largely driven by shifting energy demands, continuous infrastructure development, and an increasing need for enhanced grid safety and dependability. As urban centers continue to expand and industrial activity intensifies across both developed and emerging economies, the demand for modern, intelligent power distribution frameworks has witnessed consistent growth. The integration of digital capabilities into these systems not only supports more efficient energy management but also improves monitoring, control, and performance optimization.
Technological innovation has been a key force in reshaping traditional utility distribution panels. Enhanced control features, real-time monitoring capabilities, and the adaptability of these systems to different application environments are gaining market preference. As reliance on renewable energy sources grows, utility distribution panels must evolve to manage the variability and complexity of distributed power generation. These systems are expected to offer greater flexibility and easy reconfiguration to support energy flow from multiple sources. This dynamic market scenario is encouraging manufacturers to develop highly customizable and scalable solutions that address both functional and regulatory needs.
| Market Scope | |
|---|---|
| Start Year | 2024 |
| Forecast Year | 2025-2034 |
| Start Value | $2.2 billion |
| Forecast Value | $3.6 billion |
| CAGR | 4.8% |
The market is also being influenced by tightening energy efficiency mandates and evolving safety standards. Manufacturers are under pressure to align with international protocols while meeting customer expectations for high performance and reliability. As a result, there is a growing emphasis on incorporating smart features and internet-of-things (IoT) integration to ensure real-time diagnostics, predictive maintenance, and enhanced power quality management. Additionally, the ability to provide scalable solutions tailored to a wide range of end users-such as industrial complexes, residential buildings, and commercial establishments-is becoming a competitive differentiator.
A notable shift is also occurring in the type and size of distribution panels deployed across various sectors. The medium voltage segment accounted for the largest market share in 2024 and is projected to grow significantly to reach USD 3.5 billion by 2034. This segment is primarily favored for applications in large industrial facilities, energy-intensive manufacturing plants, and utility-grade substations. There is an increasing push to reinforce the reliability and durability of these systems to cope with high power loads while minimizing system downtime. Medium voltage panels are being engineered to enhance system stability, reduce operational risk, and provide seamless integration with modern automation systems.
Mounting configuration is another critical factor shaping purchasing decisions in the utility distribution panel space. The surface mounting segment dominated the market in 2024, holding 51% of the overall share, and is projected to register a CAGR of 4.3% through 2034. Surface-mounted panels are often preferred in industrial settings due to their ease of installation, accessibility, and overall practicality. These panels are well-suited for high-demand environments that require rugged and durable installations capable of withstanding challenging operating conditions. Meanwhile, flush-mounted panels are gaining popularity in commercial and residential sectors, where aesthetics and space utilization are top priorities. Their ability to blend with interiors and maintain a streamlined appearance is boosting demand, particularly in newly constructed smart buildings and high-end real estate projects.
The United States has consistently demonstrated strong growth across the utility distribution panel industry. The market was valued at USD 410 million in 2022, rose to USD 438.8 million in 2023, and further increased to USD 466.8 million in 2024. Looking ahead, the US market is forecasted to grow to USD 678.5 million by 2034. This upward trend is attributed to significant investments in modernizing infrastructure, broader adoption of smart grid technologies, and a firm national commitment to achieving energy efficiency targets. Ongoing initiatives focused on digital transformation and the renewal of aging grid components are creating fertile ground for future expansion. The country remains the largest contributor to regional market growth in North America, bolstered by a robust utility network and advanced technology adoption.
Industry competition is intensifying, with manufacturers striving to secure market share through innovation, product diversification, and expansion into high-growth regions. While the market is becoming increasingly fragmented, the top five players collectively accounted for over 35% of the global share in 2024. These leaders have established a solid global presence and continue to drive innovation across multiple verticals. Their offerings are often distinguished by wide-ranging product portfolios, customer-centric customization options, and a clear commitment to digital transformation across power distribution ecosystems.
Table of Contents
Chapter 1 Methodology & Scope
- 1.1 Market definitions
- 1.2 Base estimates & calculations
- 1.3 Forecast calculation
- 1.4 Data sources
- 1.4.1 Primary
- 1.4.2 Secondary
- 1.4.2.1 Paid
- 1.4.2.2 Public
Chapter 2 Executive Summary
- 2.1 Industry synopsis, 2021 - 2034
Chapter 3 Industry Insights
- 3.1 Industry ecosystem analysis
- 3.2 Regulatory landscape
- 3.3 Industry impact forces
- 3.3.1 Growth drivers
- 3.3.2 Industry pitfalls & challenges
- 3.4 Growth potential analysis
- 3.5 Porter's analysis
- 3.5.1 Bargaining power of suppliers
- 3.5.2 Bargaining power of buyers
- 3.5.3 Threat of new entrants
- 3.5.4 Threat of substitutes
- 3.6 PESTEL analysis
Chapter 4 Competitive landscape, 2025
- 4.1 Competitive landscape
- 4.2 Company market share analysis, 2024
- 4.3 Strategic initiatives
- 4.4 Competitive benchmarking
- 4.5 Strategic dashboard
- 4.6 Innovation & technology landscape
Chapter 5 Market Size and Forecast, By Voltage, 2021 - 2034 (USD Million)
- 5.1 Key trends
- 5.2 Low voltage
- 5.3 Medium voltage
Chapter 6 Market Size and Forecast, By Mounting, 2021 - 2034 (USD Million)
- 6.1 Key trends
- 6.2 Flush mounting
- 6.3 Surface mounting
Chapter 7 Market Size and Forecast, By Region, 2021 - 2034 (USD Million)
- 7.1 Key trends
- 7.2 North America
- 7.2.1 U.S.
- 7.2.2 Canada
- 7.3 Europe
- 7.3.1 UK
- 7.3.2 France
- 7.3.3 Germany
- 7.3.4 Russia
- 7.3.5 Italy
- 7.4 Asia Pacific
- 7.4.1 China
- 7.4.2 Australia
- 7.4.3 India
- 7.4.4 Japan
- 7.4.5 South Korea
- 7.5 Middle East & Africa
- 7.5.1 Saudi Arabia
- 7.5.2 UAE
- 7.5.3 Qatar
- 7.5.4 South Africa
- 7.5.5 Egypt
- 7.6 Latin America
- 7.6.1 Brazil
- 7.6.2 Argentina
- 7.6.3 Mexico
Chapter 8 Company Profiles
- 8.1 ABB
- 8.2 Ags
- 8.3 alfanar Group
- 8.4 Arranger Electric Co., Ltd
- 8.5 CSE Solutions Pvt. Ltd.
- 8.6 Eaton
- 8.7 EAMFCO
- 8.8 ESL POWER SYSTEMS, INC.
- 8.9 General Electric
- 8.10 Hager Group
- 8.11 INDUSTRIAL ELECTRIC MFG
- 8.12 Larsen & Toubro Limited
- 8.13 Legrand
- 8.14 Meba Electric Co., Ltd
- 8.15 NHP
- 8.16 Norelco
- 8.17 Paneltronics
- 8.18 R Baker
- 8.19 Schneider Electric
- 8.20 Siemens
- 8.21 Symbiotic Systems
