
|
시장보고서
상품코드
1773220
마이크로 관개 시스템 시장 기회, 성장 촉진요인, 산업 동향 분석 및 예측(2025-2034년)Micro-irrigation System Market Opportunity, Growth Drivers, Industry Trend Analysis, and Forecast 2025 - 2034 |
||||||
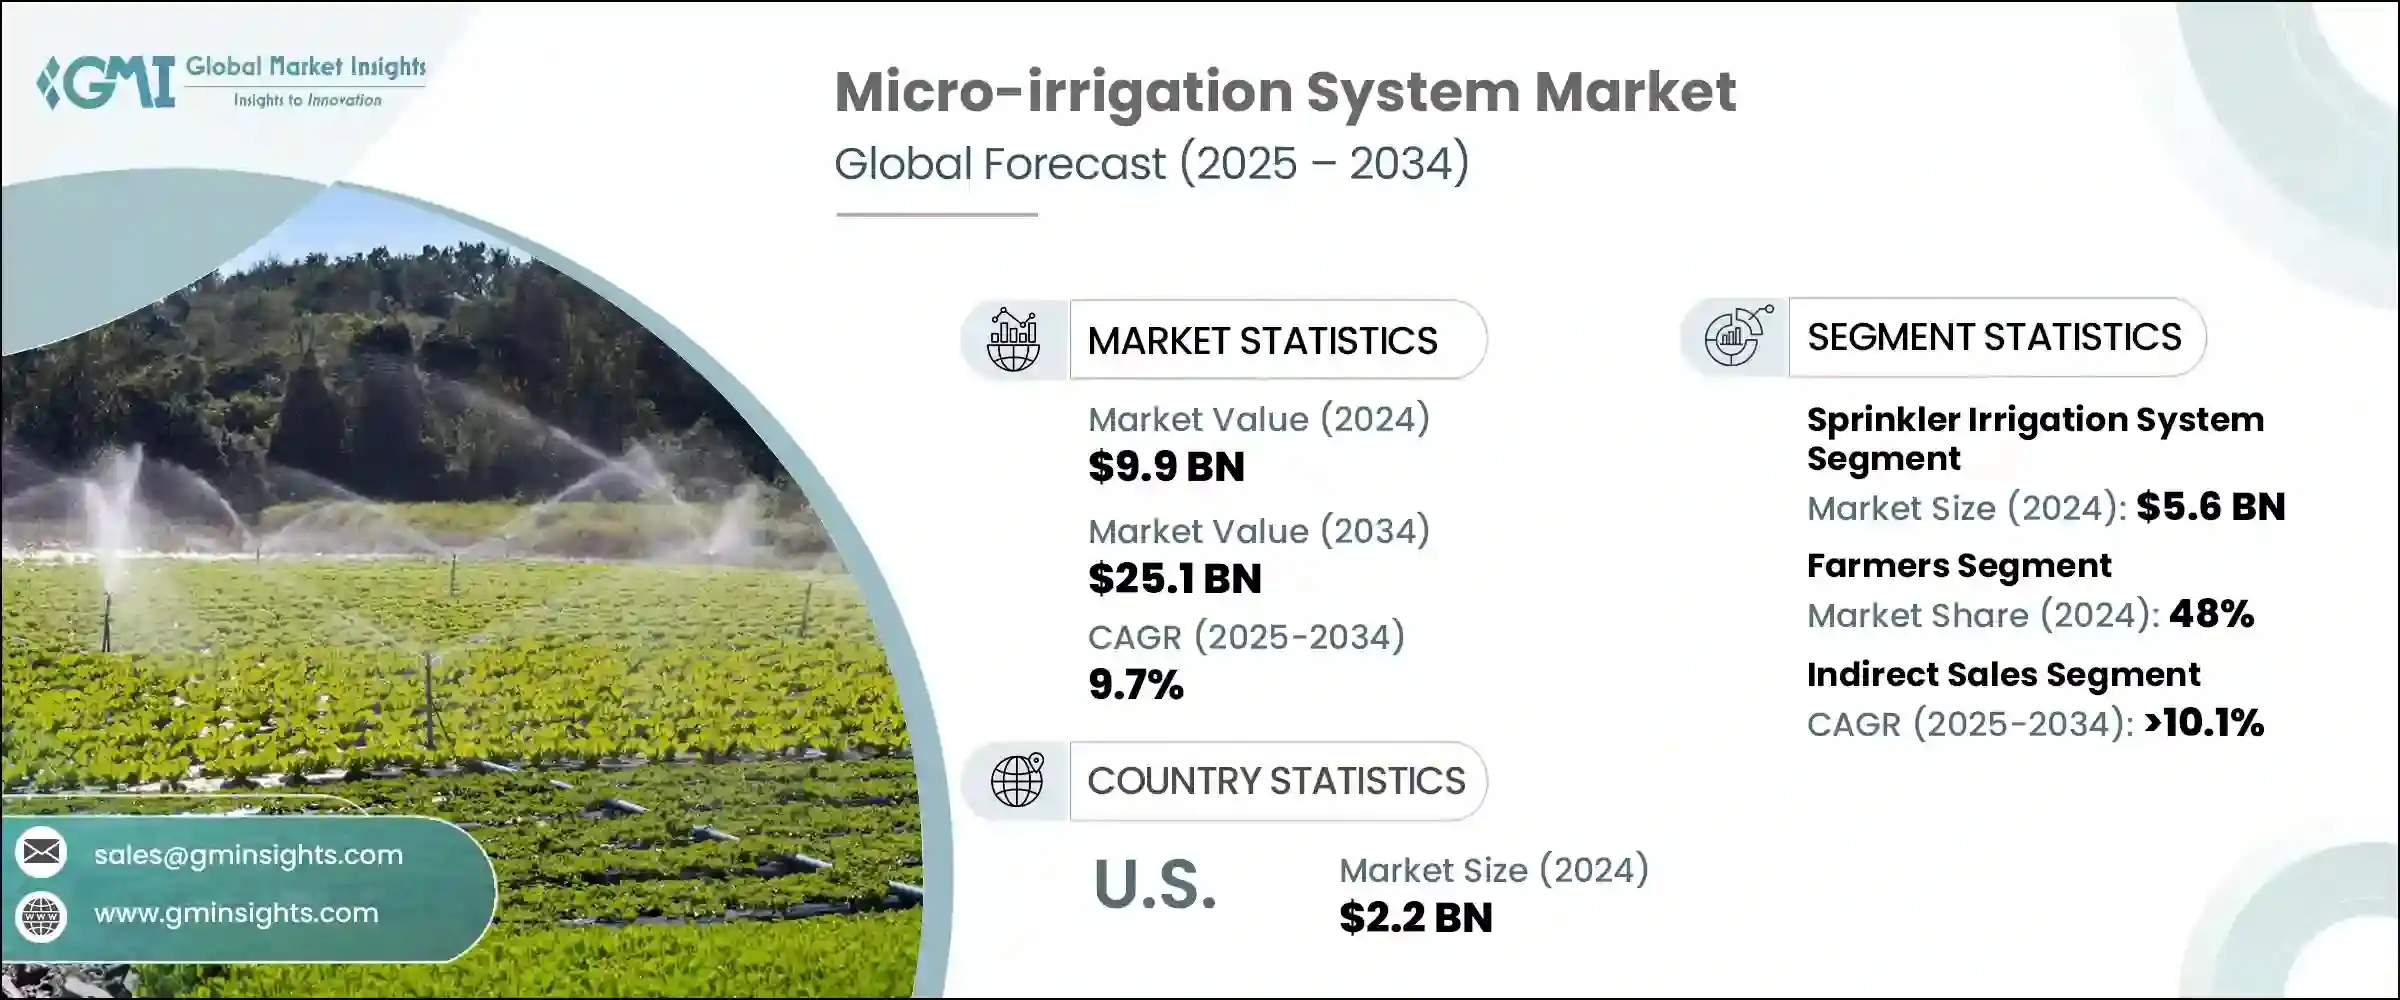
세계의 마이크로 관개 시스템 시장은 2024년에는 99억 달러로 평가되었고, CAGR 9.7%로 성장하여 2034년에는 251억 달러에 이를 것으로 추정되고 있습니다.
세계 인구 증가와 식량 안보에 대한 관심이 높아짐에 따라 이러한 시스템에 대한 수요는 계속 증가하고 있습니다. 농업에서 물이 점점 더 한정된 자원이 되는 가운데, 마이크로 관개는 다양한 기후 조건에서 작물의 요구 사항을 충족시키는 효율적인 솔루션을 제공합니다. 건조한 지역이든 습한 지역이든, 마이크로 관개는 중요한 역할을 수행하여 건조한 지역에서 작물 재배를 가능하게 하거나 계절적 강수량이 충분하지 않을 때 자연 강우를 보충할 수 있습니다. 이 방법은 작물 수확량을 안정시킬 뿐만 아니라 농업의 생산성과 수익성을 크게 향상시킬 수 있습니다.
식물의 뿌리 부분에 직접 물을 공급할 수 있기 때문에 물 낭비를 최소화하면서 작물 수확량을 극대화할 수 있습니다. 효율을 높이고, 물을 절약하고, 토양의 건강을 개선하기 위한 농부들의 요구에 따라, 마이크로 관개 기술의 채택은 점점 더 매력적인 선택이 되고 있습니다. 이러한 시스템은 수작업을 줄이고, 에너지 사용량을 줄이며, 보다 지속 가능한 농법을 지원합니다. 전 세계 농업 이해관계자들이 현대식 관개 기술을 받아들이고 있으며, 경제적, 환경적 인센티브로 인해 시장은 계속 확대되고 있습니다. 또한, 특히 가뭄과 담수 이용이 제한적인 지역에서 물 효율적 농업을 장려하는 정부의 이니셔티브는 산업의 성장을 더욱 가속화하고 있습니다.
| 시장 범위 | |
|---|---|
| 개시 연도 | 2024년 |
| 예측 연도 | 2025-2034년 |
| 개시 금액 | 99억 달러 |
| 예측 금액 | 251억 달러 |
| CAGR | 9.7% |
2024년 스프링클러 관개 시스템은 시스템 유형별로 시장을 주도하며 56억 달러의 매출을 창출하고 예측 기간 동안 연평균 10.1%의 성장률을 보일 것으로 예측됩니다. 이 시스템은 다양한 작물에 광범위하게 적용될 수 있는 다재다능한 특성으로 인해 선호되고 있습니다. 한편, 점적 관개의 기술 혁신은 보다 세밀한 제어를 가능하게 하여 농부들이 특정 작물 요구와 기후 조건에 따라 관개 일정, 기간 및 유량을 조정할 수 있는 유연성을 제공합니다. 이러한 발전은 관개의 신뢰성과 정확성을 향상시켜 생산자가 수확량을 최적화하는 동시에 자원을 절약할 수 있도록 돕고 있습니다.
최신 물방울 시스템은 현재 주요 환경 및 토양 측정 기준을 추적하는 센서 기술을 통합하고 있습니다. 이러한 센서는 토양 수분, 날씨 변화, 식물 상태를 모니터링하고 농부가 물주기를 미세 조정할 수 있도록 도와줍니다. 유선이든 무선이든, 이러한 센서 시스템은 종종 중앙 컨트롤러 또는 클라우드 기반 플랫폼에 연결되어 데이터 수집 및 의사 결정을 실시간으로 효율적으로 처리할 수 있도록 합니다. 이러한 통합은 관개에 대한 추측을 줄이고 농부들이 최소한의 인력 개입으로 효율성과 작물 건강을 개선할 수 있도록 돕습니다.
최종 용도별로는 2024년 농가용이 전체 매출의 48%를 차지하며 시장을 주도할 것으로 예상되며, 2034년까지 10.2%의 연평균 복합 성장률(CAGR)로 확대될 것으로 전망됩니다. 밭작물 생산자들 사이에서 비용 관리는 여전히 중요한 요소이며, 이는 마이크로 관개로의 전환을 계속 촉진하고 있습니다. 이러한 시스템은 소규모 농장에서 대규모 농장에 이르기까지 경영 목표에 부합하며, 물 소비를 줄이고 작물의 균일성을 개선하여 장기적인 비용 절감을 실현합니다.
유통 채널에서 간접 판매는 2024년 시장을 주도할 것으로 예상되며, 분석 기간 동안 10.1% 이상의 CAGR을 나타낼 것으로 예측됩니다. 농부들은 특히 개발도상국에서 관개 장비에 접근하기 위해 현지 유통업체, 소매업체, 온라인 플랫폼에 크게 의존하고 있습니다. 이러한 간접 채널은 더 넓은 접근성과 맞춤형 지원을 제공함으로써 판매 생태계의 중요한 부분으로 자리 잡았습니다. 또한, 디지털 상거래의 도입이 증가함에 따라 제조업체는 새로운 시장에 진입하고, 서비스 소외 지역에 도달할 수 있게 되어 간접 경로를 통한 판매를 더욱 촉진하고 있습니다.
간접판매가 주류를 차지하고 있는 가운데, 직접판매도 점차 확산되고 있습니다. 이 접근 방식을 통해 제조업체는 최종 사용자와 직접 소통하고 맞춤형 솔루션, 기술 지원 및 경쟁력있는 가격을 제공할 수 있습니다. 점점 더 많은 제조업체들이 고객과의 관계를 강화하고 더 나은 애프터 서비스를 제공하기 위해 직접 참여 전략으로 전환하고 있습니다.
미국은 2024년에도 마이크로 관개 시스템 시장의 주요 국가로 남아 22억 달러의 매출에 기여하며 북미 전체 점유율의 84%를 차지할 것으로 예측됩니다. 미국의 관개 인프라는 기술 발전과 지역 정책 이니셔티브에 힘입어 크게 발전했습니다. 작물 재배 패턴의 변화와 물 사용 효율성 향상에 대한 요구는 관개 시설의 도입을 지속적으로 촉진하고 있습니다. 관개의 전반적인 강도는 다양한 지역적 요인에 따라 달라질 수 있지만, 보다 효율적인 시스템을 통한 생산성 향상에 초점을 맞추었습니다.
경쟁상황은 인수, 생산능력 확대, 파트너십을 통해 적극적으로 포지션 강화에 나서고 있는 몇몇 유력 기업들이 있는데, Adritec Europe, Netafim, Lindsay, Rivulis, Toro 등의 기업들은 총 약 8%에서 12% 시장 점유율을 차지하고 있습니다. 차지하고 있습니다. 이들 업계 선두주자들은 제품 포트폴리오를 다양화하고 고객 도달 범위를 확대하기 위해 기술 혁신과 전략적 제휴에 지속적으로 투자하고 있습니다.
목차
제1장 조사 방법과 범위
제2장 주요 요약
제3장 업계 인사이트
- 생태계 분석
- 공급업체 상황
- 이익률
- 각 단계에서의 부가가치
- 밸류체인에 영향을 미치는 요인
- 업계에 대한 영향요인
- 성장 촉진요인
- 업계의 잠재적 리스크&과제
- 기회
- 성장 가능성 분석
- 향후 시장 동향
- 기술 및 혁신 상황
- 현재 기술 동향
- 신기술
- 가격 동향
- 지역별
- 시스템 유형별
- 규제 상황
- 표준과 컴플라이언스 요건
- 지역 규제 구조
- 인증 기준
- Porter's Five Forces 분석
- PESTEL 분석
제4장 경쟁 구도
- 서론
- 기업의 시장 점유율 분석
- 지역별
- 기업 매트릭스 분석
- 주요 시장 기업의 경쟁 분석
- 경쟁 포지셔닝 매트릭스
- 주요 발전
- 인수합병(M&A)
- 파트너십 및 협업
- 신제품 발매
- 확장 계획
제5장 시장 추산·예측 : 시스템 유형별, 2021년-2034년
- 주요 동향
- 드립 관개 시스템
- 표면 드립 관개
- 지하 드립 관개
- 패밀리 드립
- 인라인 드립
- 기타(온라인 드립 등)
- 스프링클러 관개 시스템
- 센터 피봇
- 견인 가능한 피봇
- 레인 건
- 충격 스프링클러
- 팝업 스프링클러
- 기타(선형 이동 스프링클러등)
- 기타(버블러-, 스프레이 관개 등)
제6장 시장 추산·예측 : 용도별, 2021년-2034년
- 주요 동향
- 밭작물
- 경관
- 컨테이너 원예
- 소규모 농업
- 기타(관엽식물 등)
제7장 시장 추산·예측 : 최종 용도별, 2021년-2034년
- 주요 동향
- 농민
- 기업 농장
- 정부기관
- 기타(산업 사용자 등)
제8장 시장 추산·예측 : 유통 채널별, 2021년-2034년
- 주요 동향
- 직접 판매
- 간접 판매
제9장 시장 추산·예측 : 지역별, 2021년-2034년
- 주요 동향
- 북미
- 미국
- 캐나다
- 유럽
- 독일
- 영국
- 프랑스
- 스페인
- 이탈리아
- 네덜란드
- 아시아태평양
- 중국
- 일본
- 인도
- 호주
- 한국
- 라틴아메리카
- 브라질
- 멕시코
- 아르헨티나
- 중동 및 아프리카
- 남아프리카공화국
- 사우디아라비아
- 아랍에미리트(UAE)
제10장 기업 개요
- Adritec Europe
- Automat Industries
- Captain Polyplast
- Ecoflo India
- Hunter
- Jain Irrigation Systems
- Lindsay
- N-Drip
- Netafim
- Novagric
- Rain Bird Corporation
- Rivulis
- T-L Irrigation
- Toro
- Valmont
The Global Micro-irrigation System Market was valued at USD 9.9 billion in 2024 and is estimated to grow at a CAGR of 9.7% to reach USD 25.1 billion by 2034. Demand for these systems continues to rise due to the growing global population and increasing concern over food security. As water becomes a more limited resource in agriculture, micro-irrigation offers an efficient solution to meet crop requirements across varying climate conditions. In both dry and humid regions, micro-irrigation plays a vital role, either enabling crop cultivation in arid areas or supplementing natural rainfall when seasonal precipitation is inadequate. This method not only helps maintain consistent crop yields but also significantly improves agricultural productivity and profitability, which is particularly essential as arable land per capita continues to shrink globally.
The ability to deliver water directly to the root zone of plants ensures minimal water waste while maximizing crop output. As pressure mounts on farmers to increase efficiency, conserve water, and enhance soil health, the adoption of micro-irrigation technologies has become an increasingly attractive choice. These systems reduce manual labor, lower energy usage, and support more sustainable farming practices. With agricultural stakeholders worldwide embracing modern irrigation techniques, the market continues to expand, driven by both economic and environmental incentives. Additionally, government initiatives promoting water-efficient farming are further accelerating industry growth, especially in regions prone to drought or limited freshwater availability.
| Market Scope | |
|---|---|
| Start Year | 2024 |
| Forecast Year | 2025-2034 |
| Start Value | $9.9 Billion |
| Forecast Value | $25.1 Billion |
| CAGR | 9.7% |
In 2024, the sprinkler irrigation system led the market by system type, generating USD 5.6 billion in revenue, and is projected to grow at a CAGR of 10.1% over the forecast period. This system is preferred for its versatility and broad application across various crop types. On the other hand, technological innovations in drip irrigation are allowing for more granular control, giving farmers the flexibility to adjust irrigation schedules, duration, and flow rates based on specific crop needs and climatic conditions. These advancements have enhanced the reliability and precision of irrigation, allowing growers to optimize yields and conserve resources simultaneously.
Modern drip systems now integrate sensor technologies that track key environmental and soil metrics. These sensors help monitor soil moisture, weather changes, and plant conditions, enabling farmers to fine-tune water applications. Whether wired or wireless, these sensor systems often link to central controllers or cloud-based platforms, streamlining data collection and decision-making in real time. Such integration reduces guesswork in irrigation, helping farmers improve efficiency and crop health with minimal human intervention.
Based on end use, the farmer segment dominated the market in 2024, accounting for 48% of the total revenue, and is projected to expand at a CAGR of 10.2% through 2034. Cost control remains a critical factor among field crop producers, which continues to drive the shift toward micro-irrigation. These systems align well with the operational goals of small and large-scale farms alike, offering long-term cost savings through reduced water consumption and improved crop uniformity.
In terms of distribution channel, indirect sales led the market in 2024 and are forecasted to maintain a CAGR exceeding 10.1% during the analysis period. Farmers heavily rely on local distributors, retailers, and online platforms to access irrigation equipment, especially in developing regions. These indirect channels provide wider accessibility and tailored support, making them a vital part of the sales ecosystem. Additionally, the rising adoption of digital commerce has allowed manufacturers to penetrate new markets and extend their reach to underserved areas, further boosting sales through indirect routes.
While indirect sales dominate, direct sales are gradually gaining traction. This approach allows producers to engage directly with end-users and offer customized solutions, technical assistance, and competitive pricing. More manufacturers are leaning toward direct engagement strategies to build stronger customer relationships and provide enhanced after-sales service.
The United States remained the leading country in the micro-irrigation system market in 2024, contributing USD 2.2 billion in revenue and commanding 84% of the total North American share. The country's irrigation infrastructure has evolved significantly, supported by technological advancements and regional policy initiatives. Shifting cropping patterns and the need for higher water-use efficiency continue to drive adoption. While the overall intensity of irrigation may fluctuate due to various regional factors, the focus remains firmly on improving productivity through more efficient systems.
The competitive landscape features several prominent players who are actively working to strengthen their positions through acquisitions, capacity expansions, and partnerships. Companies such as Adritec Europe, Netafim, Lindsay, Rivulis, and Toro together hold a combined market share of approximately 8% to 12%. These industry leaders continue to invest in innovation and strategic collaborations to diversify their product portfolios and increase customer reach.
Table of Contents
Chapter 1 Methodology and scope
- 1.1 Market scope and definition
- 1.2 Research design
- 1.2.1 Research approach
- 1.2.2 Data collection methods
- 1.3 Data mining sources
- 1.3.1 Global
- 1.3.2 Regional/country
- 1.4 Base estimates and calculations
- 1.4.1 Base year calculation
- 1.4.2 Key trends for market estimation
- 1.5 Primary research and validation
- 1.5.1 Primary sources
- 1.6 Forecast model
- 1.7 Research assumptions and limitations
Chapter 2 Executive summary
- 2.1 Industry 3600 synopsis
- 2.2 Key market trends
- 2.2.1 By regional
- 2.2.2 By system type
- 2.2.3 By application
- 2.2.4 By end use
- 2.2.5 By distribution channel
- 2.3 CXO perspectives: strategic imperatives
- 2.3.1 Key decision points for industry executives
- 2.3.2 Critical success factors for market players
- 2.4 Future outlook and strategic recommendations
Chapter 3 Industry insights
- 3.1 Industry ecosystem analysis
- 3.1.1 Supplier landscape
- 3.1.2 Profit margin
- 3.1.3 Value addition at each stage
- 3.1.4 Factor affecting the value chain
- 3.2 Industry impact forces
- 3.2.1 Growth drivers
- 3.2.2 Industry pitfalls & challenges
- 3.2.3 Opportunities
- 3.3 Growth potential analysis
- 3.4 Future market trends
- 3.5 Technology and innovation landscape
- 3.5.1 Current technological trends
- 3.5.2 Emerging technologies
- 3.6 Price trends
- 3.6.1 By region
- 3.6.2 By system type
- 3.7 Regulatory landscape
- 3.7.1 Standards and compliance requirements
- 3.7.2 Regional regulatory frameworks
- 3.7.3 Certification standards
- 3.8 Porter's analysis
- 3.9 PESTEL analysis
Chapter 4 Competitive landscape, 2024
- 4.1 Introduction
- 4.2 Company market share analysis
- 4.2.1 By region
- 4.2.1.1 North America
- 4.2.1.2 Europe
- 4.2.1.3 Asia Pacific
- 4.2.1.4 Latin America
- 4.2.1.5 MEA
- 4.2.1 By region
- 4.3 Company matrix analysis
- 4.4 Competitive analysis of major market players
- 4.5 Competitive positioning matrix
- 4.6 Key developments
- 4.6.1 Mergers & acquisitions
- 4.6.2 Partnerships & collaborations
- 4.6.3 New product launches
- 4.6.4 Expansion plans
Chapter 5 Market Estimates & Forecast, By System Type, 2021 - 2034 ($Billion, Million Units)
- 5.1 Key trends
- 5.2 Drip irrigation system
- 5.2.1 Surface drip irrigation
- 5.2.2 Sub-surface drip irrigation
- 5.2.3 Family drip
- 5.2.4 In-line drip
- 5.2.5 Others (online drip etc.)
- 5.3 Sprinkler irrigation system
- 5.3.1 Centre pivot
- 5.3.2 Towable pivot
- 5.3.3 Rain gun
- 5.3.4 Impact sprinkler
- 5.3.5 Pop up sprinkler
- 5.3.6 Others (linear move sprinkler etc.)
- 5.4 Others (bubbler, spray irrigation etc.)
Chapter 6 Market Estimates & Forecast, By Application, 2021 - 2034 ($Billion, Million Units)
- 6.1 Key trends
- 6.2 Field crops
- 6.3 Landscapes
- 6.4 Container gardening
- 6.5 Small-scale farming
- 6.6 Others (indoor plants etc.)
Chapter 7 Market Estimates & Forecast, By End Use, 2021 - 2034 ($Billion, Million Units)
- 7.1 Key trends
- 7.2 Farmers
- 7.3 Corporate farms
- 7.4 Government agencies
- 7.5 Others (industrial users etc.)
Chapter 8 Market Estimates & Forecast, By Distribution Channel, 2021 - 2034 ($Billion, Million Units)
- 8.1 Key trends
- 8.2 Direct sales
- 8.3 Indirect sales
Chapter 9 Market Estimates & Forecast, By Region, 2021 - 2034 ($Billion, Million Units)
- 9.1 Key trends
- 9.2 North America
- 9.2.1 U.S.
- 9.2.2 Canada
- 9.3 Europe
- 9.3.1 Germany
- 9.3.2 UK
- 9.3.3 France
- 9.3.4 Spain
- 9.3.5 Italy
- 9.3.6 Netherlands
- 9.4 Asia Pacific
- 9.4.1 China
- 9.4.2 Japan
- 9.4.3 India
- 9.4.4 Australia
- 9.4.5 South Korea
- 9.5 Latin America
- 9.5.1 Brazil
- 9.5.2 Mexico
- 9.5.3 Argentina
- 9.6 MEA
- 9.6.1 South Africa
- 9.6.2 Saudi Arabia
- 9.6.3 UAE
Chapter 10 Company Profiles
- 10.1 Adritec Europe
- 10.2 Automat Industries
- 10.3 Captain Polyplast
- 10.4 Ecoflo India
- 10.5 Hunter
- 10.6 Jain Irrigation Systems
- 10.7 Lindsay
- 10.8 N-Drip
- 10.9 Netafim
- 10.10 Novagric
- 10.11 Rain Bird Corporation
- 10.12 Rivulis
- 10.13 T-L Irrigation
- 10.14 Toro
- 10.15 Valmont
