|
시장보고서
상품코드
1773355
모래 처리 장비 시장 기회, 성장 촉진요인, 산업 동향 분석 및 예측(2025-2034년)Sand Processing Equipment Market Opportunity, Growth Drivers, Industry Trend Analysis, and Forecast 2025 - 2034 |
||||||
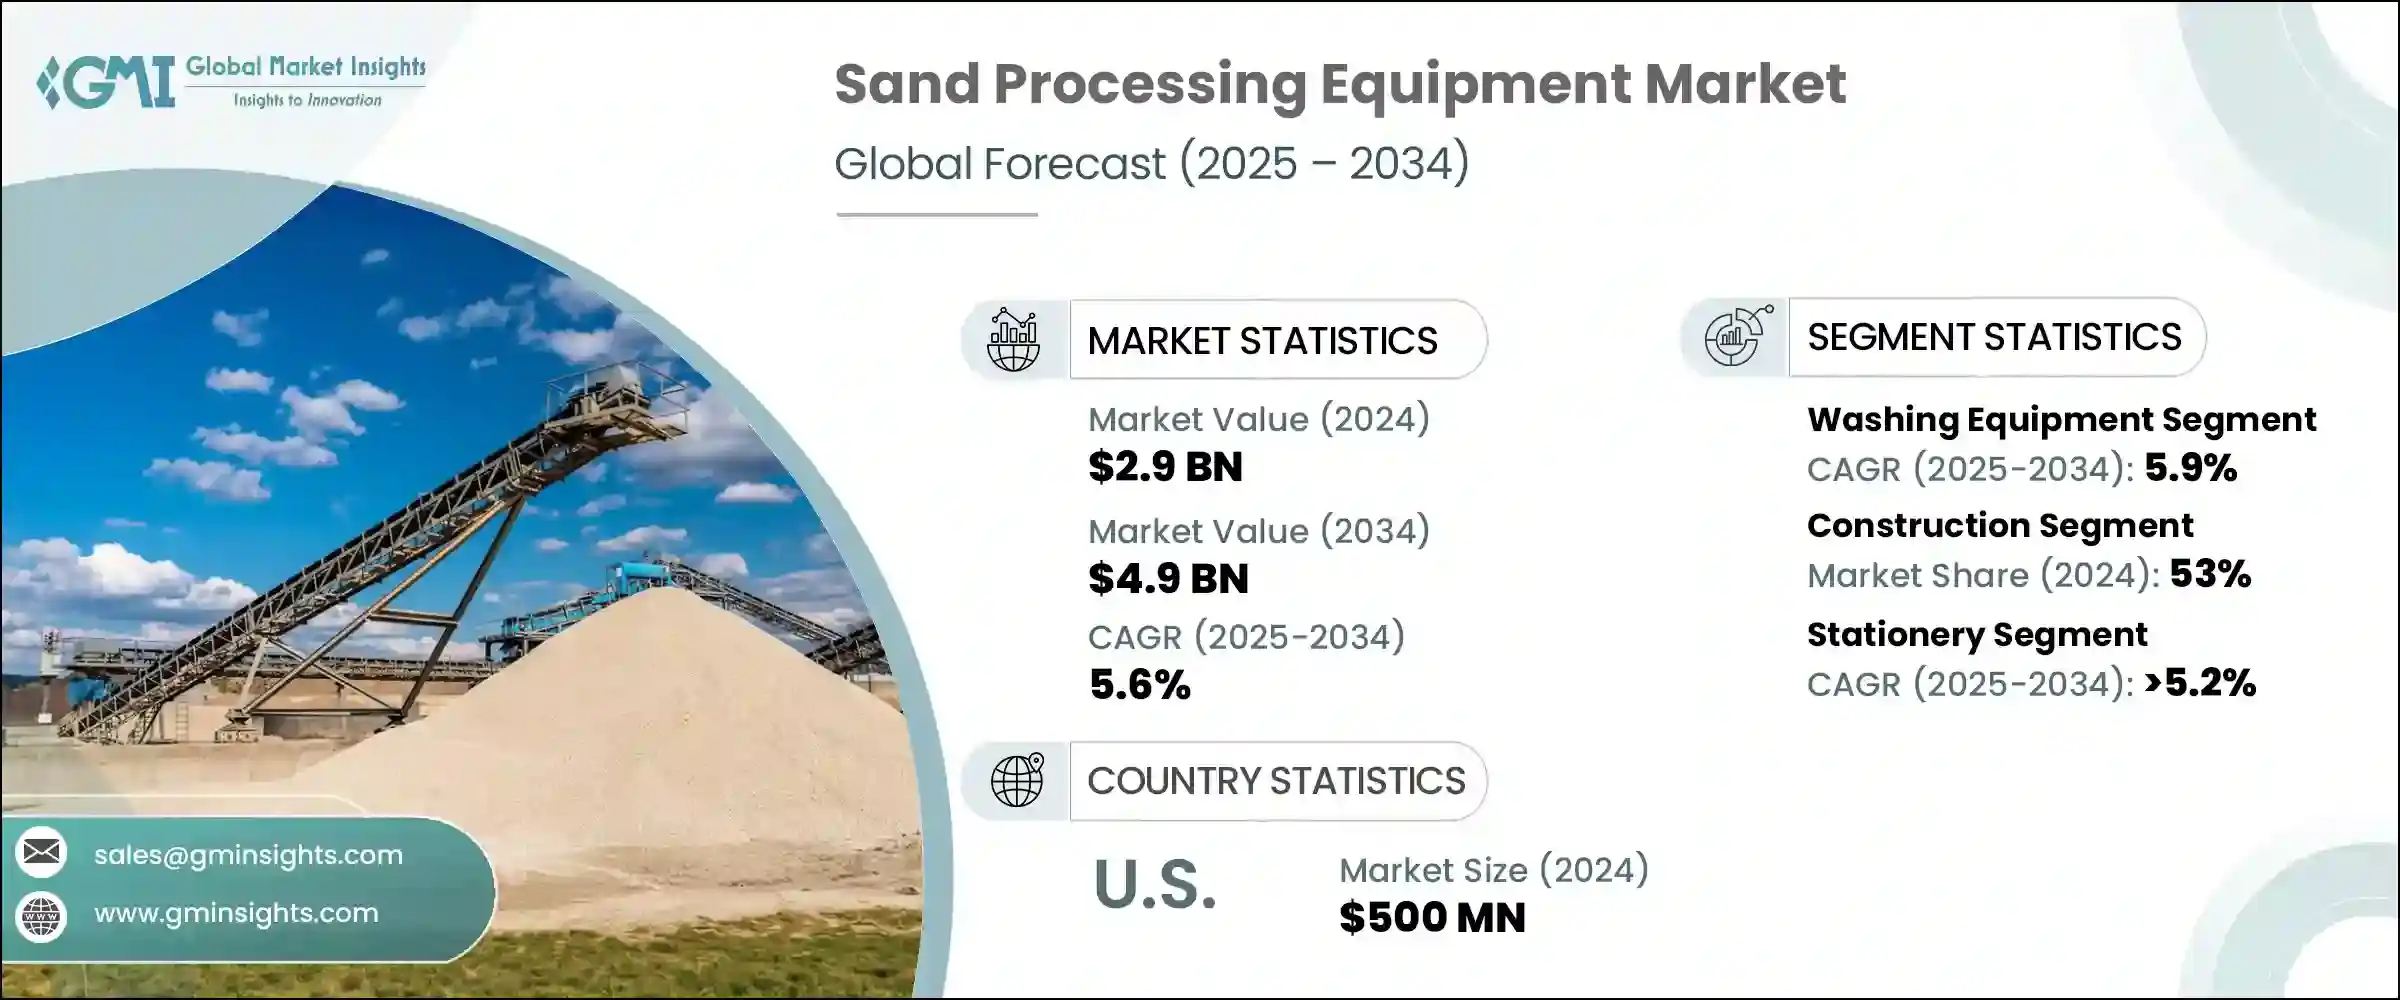
세계의 모래 처리 장비 시장은 2024년에는 29억 달러로 평가되었고 CAGR 5.6%를 나타내 2034년까지는 49억 달러에 이를 것으로 추정되고 있습니다. 모래에 대한 수요 증가가 주요 요인이 되고 있습니다. 특히 신흥 경제 국가에서는 산업 활동의 격화와 도시화의 가속에 따라, 주요 건설 용도로 사용되는 정제 모래 수요가 높아지고 있습니다. 건설용 모래는 필수적인 역할을 수행하고 있습니다. 높은 최신의 모래 처리 기술을 적극적으로 모색하고 있습니다. 현재는 조업의 생산성을 향상시킬 뿐만 아니라, 재이용이나 리사이클을 촉진해, 업계의 천연 사원에의 의존도를 저감시키는 시스템의 통합이 명확하게 중시되고 있습니다.

세계의 규제기관도, 환경에 배려한 관행을 서포트하는 기계의 채용을 장려하는 것으로, 시장을 보다 환경 친화적인 방향으로 인도하고 있습니다. 보다 엄격한 환경 규제를 준수하기 위해 제조업체는 자원을 절약하고 처리 결과를 더 잘 제어할 수 있는 솔루션을 설계하고 있습니다.
| 시장 범위 | |
|---|---|
| 시작 연도 | 2024년 |
| 예측 연도 | 2025-2034년 |
| 시작 금액 | 29억 달러 |
| 예측 금액 | 49억 달러 |
| CAGR | 5.6% |
장비 카테고리 중 세정 시스템이 2024년 선두에 서서 약 9억 달러의 수익을 올렸습니다. 자동 세척 시스템의 채택은 깨끗하고 일관된 고품질의 모래를 생산할 수 있기 때문입니다. 또한, IoT나 인공지능과 같은 선진 기술이 세정 시스템에 짜넣어져, 리얼타임으로의 성능 추적을 강화해, 에너지 소비를 삭감해, 시스템 다운 타임의 리스크를 저감하고 있습니다.
최종 용도별로 2024년에는 건설 부문이 시장의 대부분을 차지하고 총 매출액의 53%를 차지했습니다. 그림이 진행되는 가운데 건설회사는 고품질의 생산과 규제 준수의 요구를 충족시키는 고도의 모래처리 솔루션에 대한 의존을 강화하고 있습니다.
장비 구성에 관해서는 거치형 시스템이 2024년 시장을 독점했고 2034년까지 5.2% 이상의 안정된 CAGR을 나타낼 것으로 예측됩니다. 훌라 프로젝트에 이상적입니다. 게다가 정착형 셋업에 첨단 제어 기술을 통합함으로써 기업은 에너지 사용을 최적화하고 생산 품질을 향상시키고 운영 정지 시간을 최소화할 수 있습니다.
지역별로는 미국이 2024년에 북미에서 가장 호조인 시장에 부상해, 5억 달러 가까운 매출을 계상해, 이 지역의 총 시장 점유율의 77%를 차지했습니다. 프라이언스, 지속가능성을 실현할 수 있는 모래처리 시스템에 대한 수요가 현저하게 증가하고 있습니다.
모래 처리 장비 업계 주요 기업은 인수, 파트너십 및 혁신 중심의 투자를 통해 전략적 성장을 선도하고 있습니다. 업계는 통합 솔루션의 에코시스템으로 꾸준히 전환하고 있으며, 광범위한 용도를 지원하는 시스템을 제공하는 한편, 지속가능성이 중시되는 세계 시장에서 기업이 장래에 걸쳐 사업을 계속할 수 있도록 하고 있습니다.
목차
제1장 조사 방법과 범위
제2장 주요 요약
제3장 업계 인사이트
- 업계 생태계 분석
- 공급자의 상황
- 이익률
- 각 단계에서의 부가가치
- 밸류체인에 영향을 주는 요인
- 업계에 미치는 영향요인
- 성장 촉진요인
- 업계의 잠재적 리스크 및 과제
- 기회
- 성장 가능성 분석
- 향후 시장 동향
- 기술과 혁신의 상황
- 현재의 기술 동향
- 신흥기술
- 가격 동향
- 지역별
- 기기 유형별
- 규제 상황
- 표준 및 규정 준수 요건
- 지역 규제 틀
- 인증기준
- Porter's Five Forces 분석
- PESTEL 분석
제4장 경쟁 구도
- 서론
- 기업의 시장 점유율 분석
- 지역별
- 기업 매트릭스 분석
- 주요 시장 기업의 경쟁 분석
- 경쟁 포지셔닝 매트릭스
- 주요 발전
- 합병과 인수
- 파트너십 및 협업
- 신제품 발매
- 확장 계획
제5장 시장 추계·예측 : 기기 유형별(2021-2034년)
- 주요 동향
- 스크리닝 장비
- 트롬멜 스크린
- 진동 스크린
- 경사
- 수평
- 멀티 데크
- 디스크 스크린
- 세척 장비
- 나선형 모래 세척기
- 임펠러 모래 세척기
- 장비 분류
- 탈수 사이클론
- 사이클론 분류
- 탱크 분류
- 기타(미세물질 세척기 등)
- 스크러빙 장비
- 교반 스크러빙 기계
- 나선형 그루부 스크러빙 기계
- 기타(탈수 등)
제6장 시장 추계·예측 : 유형별(2021-2034년)
- 주요 동향
- 문구류
- 모바일
제7장 시장 추계·예측 : 최종 이용 산업별(2021-2034년)
- 주요 동향
- 건설
- 유리 제조
- 파운드리 산업
- 광업 및 광물 가공
- 기타
제8장 시장 추계·예측 : 유통 채널별(2021-2034년)
- 주요 동향
- 직접 판매
- 간접 판매
제9장 시장 추계·예측 : 지역별(2021-2034년)
- 주요 동향
- 북미
- 미국
- 캐나다
- 유럽
- 독일
- 영국
- 프랑스
- 스페인
- 이탈리아
- 네덜란드
- 아시아태평양
- 중국
- 일본
- 인도
- 호주
- 한국
- 라틴아메리카
- 브라질
- 멕시코
- 아르헨티나
- 중동 및 아프리카
- 남아프리카
- 사우디아라비아
- 아랍에미리트(UAE)
제10장 기업 프로파일
- Aggregates Equipment
- Astec
- CDE Group
- D&G Machinery
- FSP
- LZZG
- McLanahan
- Metso
- Mogensen
- Palmer
- Sinonine
- Sinto
- Superior Industries
- Titan Crushing Equipment
- Weir
The Global Sand Processing Equipment Market was valued at USD 2.9 billion in 2024 and is estimated to grow at a CAGR of 5.6% to reach USD 4.9 billion by 2034. This rise is largely being driven by the rising demand for high-quality sand across the construction and infrastructure industries. As industrial activity intensifies and urbanization accelerates-particularly in developing economies-there is a growing requirement for refined sand used in key construction applications. From concrete manufacturing to road-building and foundational support, construction-grade sand plays an essential role. In response to mounting pressure to meet performance standards while minimizing environmental impact, companies are actively seeking modern, energy-efficient sand processing technologies that align with evolving sustainability goals. There is now a clear emphasis on integrating systems that not only improve operational productivity but also promote reuse and recycling, reducing the industry's dependence on natural sand sources.
Global regulatory bodies are also steering the market in a greener direction by encouraging the adoption of machinery that supports environmentally responsible practices. The equipment being developed today is designed to operate with greater precision, efficiency, and a smaller ecological footprint. To comply with stricter environmental regulations, manufacturers are designing solutions that conserve resources and enable better control over processing outcomes. These innovations are gaining traction as concerns over resource depletion and environmental damage grow stronger.
| Market Scope | |
|---|---|
| Start Year | 2024 |
| Forecast Year | 2025-2034 |
| Start Value | $2.9 Billion |
| Forecast Value | $4.9 Billion |
| CAGR | 5.6% |
Among the equipment categories, washing systems took the lead in 2024, generating revenue of around USD 900 million. This segment is forecast to grow at a CAGR of 5.9% throughout the 2025-2034 period. The growing adoption of automated washing systems stems from their ability to deliver clean, consistent, and high-grade sand output. These machines are becoming essential for companies looking to reduce water waste, recycle process water, and maintain sand quality at scale. In addition, advanced technologies like IoT and artificial intelligence are being incorporated into washing systems to enhance their real-time performance tracking, reduce energy consumption, and lower the risk of system downtime. As industries move toward achieving greener operations, demand for such intelligent washing units is only expected to intensify.
In terms of end-use, the construction sector held the lion's share of the market in 2024, accounting for 53% of total revenue. This segment is projected to witness a CAGR of 6% over the next decade. The continued rise in global infrastructure projects, especially in rapidly developing nations, is a key growth driver. With growing urban populations and national-level infrastructure programs in motion, construction companies are increasingly relying on advanced sand processing solutions that meet the need for high-quality output and regulatory compliance. There is a strong shift toward on-site sand preparation, which enhances project efficiency and reduces dependence on external sand suppliers. As construction standards become more stringent, the demand for high-performance equipment capable of producing premium-grade materials continues to rise.
When it comes to equipment configuration, stationary systems dominated the market in 2024 and are expected to maintain a steady CAGR of over 5.2% through 2034. These systems are primarily used in large-scale industrial environments where high-volume production and long-term reliability are critical. Stationary units offer enhanced capacity, durability, and customization, making them ideal for mining and heavy infrastructure projects. Additionally, the integration of advanced control technologies in stationary setups is helping companies optimize energy use, improve output quality, and minimize operational downtime. These innovations are particularly appealing to firms focused on reducing their carbon footprint and maintaining consistent product standards.
Regionally, the United States emerged as the top-performing market within North America in 2024, contributing nearly USD 500 million in revenue and capturing 77% of the region's total market share. This dominance is closely linked to major public and private investments in infrastructure upgrades. As modernization efforts accelerate across the country-particularly in transportation, commercial construction, and housing-there is a noticeable increase in demand for sand processing systems that can deliver performance, compliance, and sustainability. Manufacturers are responding with modular, automation-friendly designs that meet both functional requirements and regulatory mandates. These systems are allowing companies to better align with current and upcoming environmental standards while maximizing long-term value.
Major players in the sand processing equipment industry are prioritizing strategic growth through acquisitions, partnerships, and innovation-driven investments. Many companies are enhancing their portfolios with new technologies that promise better efficiency, reduced emissions, and superior sand quality. The industry is steadily moving toward an ecosystem of integrated solutions, offering systems that support a wide range of applications while enabling companies to future-proof their operations in a sustainability-driven global market.
Table of Contents
Chapter 1 Methodology and scope
- 1.1 Market scope and definition
- 1.2 Research design
- 1.2.1 Research approach
- 1.2.2 Data collection methods
- 1.3 Data mining sources
- 1.3.1 Global
- 1.3.2 Regional/country
- 1.4 Base estimates and calculations
- 1.4.1 Base year calculation
- 1.4.2 Key trends for market estimation
- 1.5 Primary research and validation
- 1.5.1 Primary sources
- 1.6 Forecast model
- 1.7 Research assumptions and limitations
Chapter 2 Executive summary
- 2.1 Industry 360° synopsis
- 2.2 Key market trends
- 2.2.1 By regional
- 2.2.2 By equipment type
- 2.2.3 By type
- 2.2.4 By end use industry
- 2.2.5 By distribution channel
- 2.3 CXO perspectives: strategic imperatives
- 2.3.1 Key decision points for industry executives
- 2.3.2 Critical success factors for market players
- 2.4 Future outlook and strategic recommendations
Chapter 3 Industry insights
- 3.1 Industry ecosystem analysis
- 3.1.1 Supplier landscape
- 3.1.2 Profit margin
- 3.1.3 Value addition at each stage
- 3.1.4 Factor affecting the value chain
- 3.2 Industry impact forces
- 3.2.1 Growth drivers
- 3.2.2 Industry pitfalls & challenges
- 3.2.3 Opportunities
- 3.3 Growth potential analysis
- 3.4 Future market trends
- 3.5 Technology and innovation landscape
- 3.5.1 Current technological trends
- 3.5.2 Emerging technologies
- 3.6 Price trends
- 3.6.1 By region
- 3.6.2 By equipment type
- 3.7 Regulatory landscape
- 3.7.1 Standards and compliance requirements
- 3.7.2 Regional regulatory frameworks
- 3.7.3 Certification standards
- 3.8 Porter's analysis
- 3.9 PESTEL analysis
Chapter 4 Competitive landscape, 2024
- 4.1 Introduction
- 4.2 Company market share analysis
- 4.2.1 By region
- 4.2.1.1 North America
- 4.2.1.2 Europe
- 4.2.1.3 Asia Pacific
- 4.2.1.4 Latin America
- 4.2.1.5 MEA
- 4.2.1 By region
- 4.3 Company matrix analysis
- 4.4 Competitive analysis of major market players
- 4.5 Competitive positioning matrix
- 4.6 Key developments
- 4.6.1 Mergers & acquisitions
- 4.6.2 Partnerships & collaborations
- 4.6.3 New product launches
- 4.6.4 Expansion plans
Chapter 5 Market Estimates & Forecast, By Equipment Type, 2021 - 2034 ($Billion, Thousand Units)
- 5.1 Key trends
- 5.1.1 Screening equipment
- 5.1.2 Trommel Screens
- 5.1.3 Vibrating Screens
- 5.1.3.1 Inclined
- 5.1.3.2 Horizontal
- 5.1.3.3 Multi-deck
- 5.1.4 Disc screens
- 5.2 Washing equipment
- 5.2.1 Spiral sand washing machines
- 5.2.2 Impeller sand washing machines
- 5.3 Classifying equipment
- 5.3.1 Dewatering cyclones
- 5.3.2 Classifying cyclones
- 5.3.3 Classifying tanks
- 5.3.4 Others (fine material washers etc.)
- 5.4 Scrubbing equipment
- 5.4.1 Stirring scrubbing machines
- 5.4.2 Spiral groove scrubbing machines
- 5.5 Others (dewatering etc.)
Chapter 6 Market Estimates & Forecast, By Type, 2021 - 2034 ($Billion, Thousand Units)
- 6.1 Key trends
- 6.2 Stationery
- 6.3 Mobile
Chapter 7 Market Estimates & Forecast, By End Use Industry, 2021 - 2034 ($Billion, Thousand Units)
- 7.1 Key trends
- 7.2 Construction
- 7.3 Glass Manufacturing
- 7.4 Foundry industry
- 7.5 Mining & mineral processing
- 7.6 Others
Chapter 8 Market Estimates & Forecast, By Distribution Channel, 2021 - 2034 ($Billion, Thousand Units)
- 8.1 Key trends
- 8.2 Direct sales
- 8.3 Indirect sales
Chapter 9 Market Estimates & Forecast, By Region, 2021 - 2034 ($Billion, Thousand Units)
- 9.1 Key trends
- 9.2 North America
- 9.2.1 U.S.
- 9.2.2 Canada
- 9.3 Europe
- 9.3.1 Germany
- 9.3.2 UK
- 9.3.3 France
- 9.3.4 Spain
- 9.3.5 Italy
- 9.3.6 Netherlands
- 9.4 Asia Pacific
- 9.4.1 China
- 9.4.2 Japan
- 9.4.3 India
- 9.4.4 Australia
- 9.4.5 South Korea
- 9.5 Latin America
- 9.5.1 Brazil
- 9.5.2 Mexico
- 9.5.3 Argentina
- 9.6 MEA
- 9.6.1 South Africa
- 9.6.2 Saudi Arabia
- 9.6.3 UAE
Chapter 10 Company Profiles
- 10.1 Aggregates Equipment
- 10.2 Astec
- 10.3 CDE Group
- 10.4 D&G Machinery
- 10.5 FSP
- 10.6 LZZG
- 10.7 McLanahan
- 10.8 Metso
- 10.9 Mogensen
- 10.10 Palmer
- 10.11 Sinonine
- 10.12 Sinto
- 10.13 Superior Industries
- 10.14 Titan Crushing Equipment
- 10.15 Weir