
|
시장보고서
상품코드
1773441
수하물 처리 시스템 시장 기회, 성장 촉진요인, 산업 동향 분석 및 예측(2025-2034년)Baggage Handling Systems Market Opportunity, Growth Drivers, Industry Trend Analysis, and Forecast 2025 - 2034 |
||||||
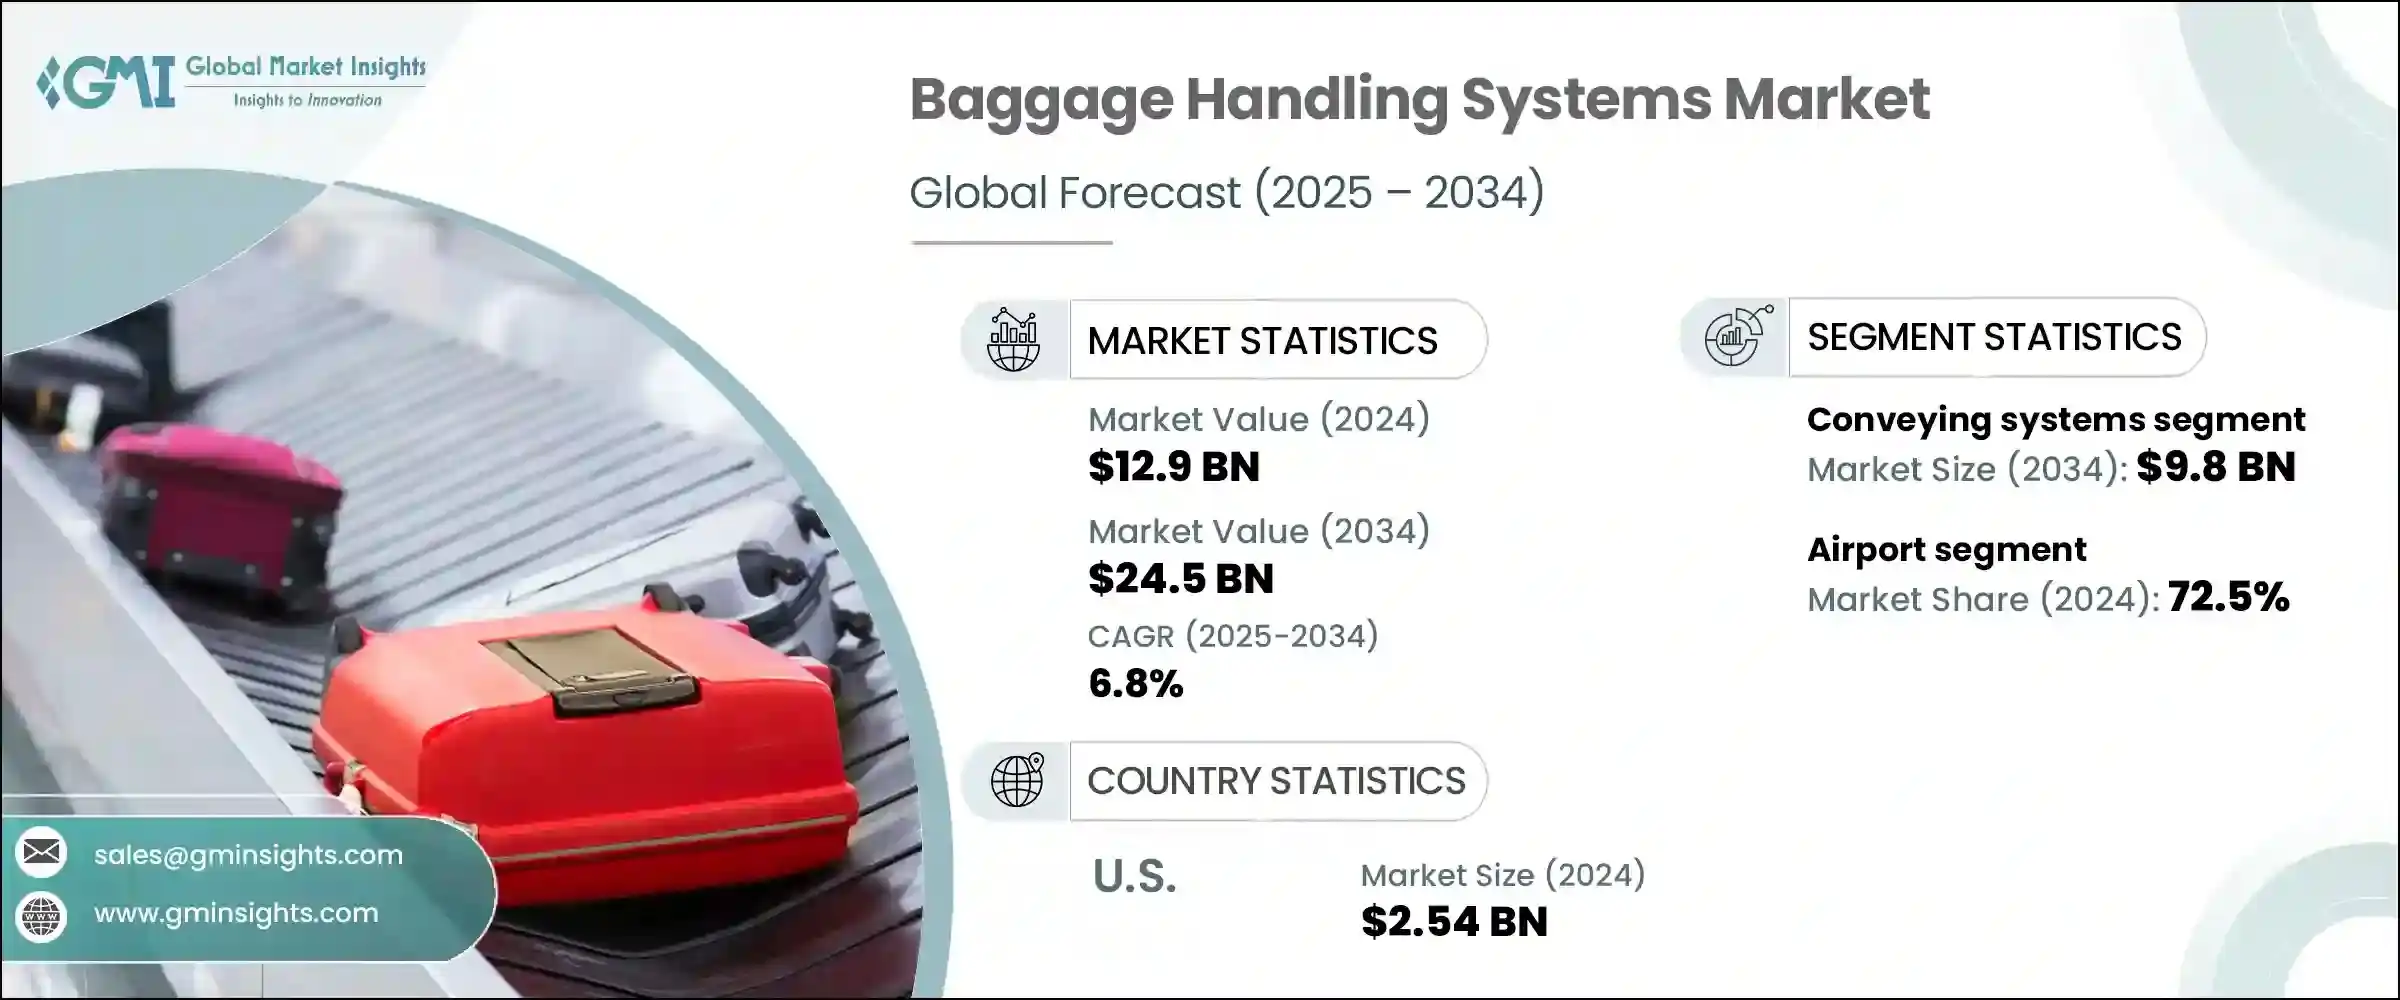
수하물 처리 시스템 세계 시장 규모는 2024년에 129억 달러로 평가되었고, CAGR 6.8%로 성장하여 2034년에는 245억 달러에 이를 것으로 예측됩니다.
성장의 주요 원동력은 아시아, 아프리카, 중동의 대규모 공항 확장 및 현대화 프로젝트입니다. 이들 지역의 정부 및 민간 이해관계자들은 자동화와 승객 편의에 중점을 둔 스마트 공항 인프라를 우선순위에 두고 있습니다. 한편, 미국과 유럽에서는 레거시 공항 시설의 개보수가 진행되고 있으며, 2024년 미국 교통 당국이 발표한 대규모 인프라 자금은 터미널 수하물 시스템 업그레이드에 초점을 맞추었습니다.
항공 교통량 증가와 규제 요구 사항으로 인해 공항은 에너지 효율적이고 모듈식이며 소프트웨어 지원 시스템으로 전환하고 있습니다. 디지털 기술, 예지보전, 자동화는 이제 최신 수하물 처리 아키텍처의 필수 요소로 자리 잡았습니다. 이러한 요소들이 결합되어 시스템 요구사항이 재편되고 있으며, 선진국과 신흥국을 막론하고 혁신적인 솔루션에 대한 수요가 지속적으로 증가하고 있습니다. 스마트한 수하물 추적, 보안 규정 준수 강화, 원활한 승객 이동은 전 세계적으로 첨단 수하물 처리 시스템에 대한 투자와 채택을 촉진하는 중요한 벤치마크가 되고 있습니다.
| 시장 범위 | |
|---|---|
| 개시 연도 | 2024년 |
| 예측 연도 | 2025-2034년 |
| 개시 금액 | 129억 달러 |
| 예측 금액 | 245억 달러 |
| CAGR | 6.8% |
컨베이어 시스템 분야는 2024년 54억 달러, 2034년에는 98억 달러에 달했습니다. 컨베이어는 모든 수하물 업무의 중추적인 역할을 하며, 체크인부터 검색, 분류, 캐러셀에 이르기까지 공항의 주요 검문소 간 수하물 이동을 용이하게 합니다. 운영상 중요도가 높고 정기적인 유지보수가 필요하기 때문에 공항 신설 및 현대화 프로젝트에서 가장 널리 채택되는 구성 요소입니다. 수하물 처리 시스템은 신뢰할 수 있고 확장 가능한 컨베이어 인프라 없이는 효율적으로 작동할 수 없습니다.
2024년 공항 부문은 93억 달러로 72.5%의 점유율을 차지했습니다. 공항은 승객의 흐름, 수하물 정확성 및 규정 준수와 관련된 엄격한 요구 사항으로 인해 수하물 처리 시스템의 가장 큰 수요처로 남아 있습니다. 터미널 설계 및 여객 경로의 각 요소는 BHS 설치를 중심으로 계획되어 운영의 연속성에 필수적인 요소로 자리 잡았습니다. 항공 승객이 증가함에 따라 공항 운영사는 증가하는 수하물 양을 관리하고 운영을 간소화하기 위해 이러한 시스템의 도입을 가속화하고 있습니다.
미국 수하물 처리 시스템 시장은 2024년 25억 4,000만 달러 규모에 달했으며, 2034년까지 연평균 6.1%의 성장률을 보일 것으로 예측됩니다. 첨단 폭발물 감지 시스템의 의무화, RFID 및 예측 기술의 사용 확대로 인해 미국 공항의 업그레이드가 확산되고 있습니다. 수하물 시스템은 순수한 기계식 시스템에서 스마트 공항의 목표에 부합하는 디지털 우선 플랫폼으로 전환되고 있습니다. 통합 소프트웨어 시스템, 자동화 및 AI 기반 도구가 표준이 되어 승객의 만족도를 높이고 수하물 오작동을 줄이는 데 도움이 되고 있습니다.
시장에 영향을 미치는 주요 기업으로는 BEUMER Group, Alstef Group, BCS Group, Daifuku Corporation, CIMC-TianDa Holdings 등이 있습니다. 수하물 처리 시스템 시장의 주요 기업들은 디지털 혁신, 세계 진출, 제품 모듈화의 조합을 추구하며 시장에서의 입지를 강화하고 있습니다. 각 업체들은 자동화, 예지보전, 실시간 수하물 추적을 지원하는 소프트웨어 통합 플랫폼에 많은 투자를 하고 있습니다. 다양한 공항 규모와 레이아웃에 대응하기 위해서는 맞춤형 및 모듈식 시스템 설계가 핵심입니다. 각 업체들은 공항 당국 및 항공 계약업체와 장기적인 파트너십을 맺고 대규모 설치 및 서비스 계약을 체결하고 있습니다. 신흥 시장에서는 현지화 전략을 통해 각 지역의 운영 요구에 맞게 시스템을 조정할 수 있습니다.
목차
제1장 조사 방법과 범위
제2장 주요 요약
제3장 업계 인사이트
- 생태계 분석
- 공급업체 상황
- 이익률
- 각 단계에서의 부가가치
- 밸류체인에 영향을 미치는 요인
- 업계에 대한 영향요인
- 성장 촉진요인
- 업계의 잠재적 리스크&과제
- 기회
- 성장 가능성 분석
- 향후 시장 동향
- 기술 및 혁신 상황
- 현재 기술 동향
- 신기술
- 가격 동향
- 지역별
- 시스템별
- 규제 상황
- 표준과 컴플라이언스 요건
- 지역 규제 구조
- 인증 기준
- Porter's Five Forces 분석
- PESTEL 분석
제4장 경쟁 구도
- 서론
- 기업의 시장 점유율 분석
- 지역별
- 북미
- 유럽
- 아시아태평양
- 지역별
- 기업 매트릭스 분석
- 주요 시장 기업의 경쟁 분석
- 경쟁 포지셔닝 매트릭스
- 주요 발전
- 인수합병(M&A)
- 파트너십 및 협업
- 신제품 발매
- 확장 계획
제5장 시장 추산·예측 : 시스템 유형별, 2021년-2034년
- 주요 동향
- 컨베이어 시스템
- 벨트 컨베이어
- 롤러 콘베이어
- 경사 트레이 선별기
- 기타(루프 컨베이어 등)
- 선별 시스템
- 선형 소터
- 경사 트레이 선별기
- 크로스 벨트 소터
- DCV(Destination coded vehicle) 시스템
- 체크인 및 적재 시스템
- 셀프 백 드롭 유닛
- 수동 체크인 컨베이어
- 흡기 시스템
- 스크리닝 시스템
- 통합 폭발물 감지 시스템(EDS)
- CT 기반 스캐너
- 자동 트레이 반환 시스템(ATRS)
제6장 시장 추산·예측 : 용량별, 2021년-2034년
- 주요 동향
- 2500 bags/hr 미만
- 2500-6000 bags/hr
- 6000 bags/hr 이상
제7장 시장 추산·예측 : 동작 모드별, 2021년-2034년
- 주요 동향
- 자동 시스템
- 반자동 시스템
제8장 시장 추산·예측 : 기술별, 2021년-2034년
- 주요 동향
- 바코드 스캔 시스템
- RFID 기반 시스템
- 기타
제9장 시장 추산·예측 : 최종 용도별, 2021년-2034년
- 주요 동향
- 공항
- 철도 시스템
- 크루즈 터미널
- 군 및 방위
- 기타
제10장 시장 추산·예측 : 지역별, 2021년-2034년
- 주요 동향
- 북미
- 미국
- 캐나다
- 유럽
- 독일
- 영국
- 프랑스
- 이탈리아
- 스페인
- 네덜란드
- 아시아태평양
- 중국
- 인도
- 일본
- 한국
- 호주
- 라틴아메리카
- 브라질
- 멕시코
- 아르헨티나
- 중동 및 아프리카
- 아랍에미리트(UAE)
- 사우디아라비아
- 남아프리카공화국
제11장 기업 개요
- Alstef Group
- BCS Group
- BEUMER Group
- CIMC-TianDa Holdings
- Daifuku Co., Ltd.
- Fives Group
- G&S Airport Conveyor
- Glidepath Group
- Leonardo S.p.A.
- Logan Teleflex
- Pteris Global Ltd.
- Siemens Logistics GmbH
- SITA
- Vanderlande Industries B.V.
The Global Baggage Handling Systems Market was valued at USD 12.9 billion in 2024 and is estimated to grow at a CAGR of 6.8% to reach USD 24.5 billion by 2034. Growth is primarily driven by large-scale airport expansions and modernization projects across Asia, Africa, and the Middle East. Governments and private stakeholders in these regions are prioritizing smart airport infrastructure with a focus on automation and passenger convenience. Meanwhile, legacy airport facilities in the U.S. and Europe are undergoing retrofits, which continue to generate steady aftermarket demand. In 2024, significant infrastructure funding announced by U.S. transportation authorities emphasized upgrades in terminal baggage systems.
With rising air traffic and regulatory demands, airports are transitioning to energy-efficient, modular, and software-enabled systems. Digital technologies, predictive maintenance, and automation are now essential components of the modern baggage-handling architecture. These factors are collectively reshaping system requirements and fueling consistent demand for innovative solutions across both developed and emerging aviation hubs. Smart baggage tracking, enhanced security compliance, and seamless passenger movement are becoming critical benchmarks that drive investment and adoption of advanced baggage handling systems on a global scale.
| Market Scope | |
|---|---|
| Start Year | 2024 |
| Forecast Year | 2025-2034 |
| Start Value | $12.9 Billion |
| Forecast Value | $24.5 Billion |
| CAGR | 6.8% |
The conveying systems segment generated USD 5.4 billion in 2024 and will reach USD 9.8 billion by 2034. Conveyors serve as the backbone of all baggage operations, facilitating luggage transfers between key airport checkpoints-from check-in to screening, sorting, and carousels. Their high operational importance and need for routine maintenance make them the most widely adopted component in both new airport builds and modernization projects. No baggage handling system can function efficiently without a reliable and expansive conveyor infrastructure, which justifies its dominant share in total system expenditure.
In 2024, the airport segment contributed USD 9.3 billion, securing a 72.5% share. Airports continue to be the largest consumers of baggage handling systems due to the intense demands associated with passenger flow, baggage accuracy, and regulatory compliance. Each component of terminal design and passenger routing is planned around BHS installations, making them integral to operational continuity. As air travel increases, airport operators are accelerating their adoption of these systems to manage growing luggage volumes and streamline operations.
U.S. Baggage Handling Systems Market was valued at USD 2.54 billion in 2024 and is expected to grow at a CAGR of 6.1% through 2034 driven by robust federal infrastructure investments and evolving security regulations. Mandates for advanced explosive detection systems and the growing use of RFID and predictive technologies are leading to widespread upgrades in U.S. airports. Baggage systems are shifting from purely mechanical setups to digital-first platforms aligned with smart airport goals. Integrated software systems, automation, and AI-driven tools are becoming standard, helping reduce baggage mishandling while enhancing passenger satisfaction.
Top companies influencing the market include BEUMER Group, Alstef Group, BCS Group, Daifuku Co., Ltd., and CIMC-TianDa Holdings. Leading players in the baggage handling systems market are pursuing a combination of digital transformation, global expansion, and product modularity to strengthen their market positions. Firms are investing heavily in software-integrated platforms that support automation, predictive maintenance, and real-time baggage tracking. Customization and modular system design are key to catering to diverse airport sizes and layouts. Companies are entering long-term partnerships with airport authorities and aviation contractors to secure large-scale installation and service contracts. In emerging markets, localization strategies are enabling players to adapt systems to regional operational needs.
Table of Contents
Chapter 1 Methodology & Scope
- 1.1 Market scope and definition
- 1.2 Research design
- 1.2.1 Research approach
- 1.2.2 Data collection methods
- 1.3 Data mining sources
- 1.3.1 Global
- 1.3.2 Regional/Country
- 1.4 Base estimates and calculations
- 1.4.1 Base year calculation
- 1.4.2 Key trends for market estimation
- 1.5 Primary research and validation
- 1.5.1 Primary sources
- 1.6 Forecast model
- 1.7 Research assumptions and limitations
Chapter 2 Executive Summary
- 2.1 Industry 3600 synopsis
- 2.2 Key market trends
- 2.2.1 System type
- 2.2.2 Mode of operation
- 2.2.3 Technology
- 2.2.4 End use
- 2.3 CXO perspective: strategic imperatives
- 2.3.1 Key decision points for industry executives
- 2.3.2 Critical success factors for market players
- 2.4 Future outlook and strategic recommendations
Chapter 3 Industry Insights
- 3.1 Industry ecosystem analysis
- 3.1.1 Supplier landscape
- 3.1.2 Profit margin
- 3.1.3 Value addition at each stage
- 3.1.4 Factor affecting the value chain
- 3.2 Industry Impact forces
- 3.2.1 Growth drivers
- 3.2.2 Industry pitfalls & challenges
- 3.2.3 Opportunities
- 3.3 Growth potential analysis
- 3.4 Future market trends
- 3.5 Technology and innovation landscape
- 3.5.1 Current technological trends
- 3.5.2 Emerging technologies
- 3.6 Price trends
- 3.6.1 By region
- 3.6.2 By system
- 3.7 Regulatory landscape
- 3.7.1 Standards and compliance requirements
- 3.7.2 Regional regulatory frameworks
- 3.7.3 Certification standards
- 3.8 Porter's analysis
- 3.9 PESTEL analysis
Chapter 4 Competitive Landscape, 2024
- 4.1 Introduction
- 4.2 Company market share analysis
- 4.2.1 By region
- 4.2.1.1 North America
- 4.2.1.2 Europe
- 4.2.1.3 Asia Pacific
- 4.2.1 By region
- 4.3 Company matrix analysis
- 4.4 Competitive analysis of major market players
- 4.5 Competitive positioning matrix
- 4.6 Key developments
- 4.6.1 Mergers & acquisitions
- 4.6.2 Partnerships & collaborations
- 4.6.3 New Product Launches
- 4.6.4 Expansion Plans
Chapter 5 Market Estimates & Forecast, By System Type, 2021 - 2034 (USD Billion) (Thousand Units)
- 5.1 Key trends
- 5.2 Conveying systems
- 5.2.1 Belt conveyors
- 5.2.2 Roller conveyors
- 5.2.3 Tilt tray sorters
- 5.2.4 Others (Loop conveyors, etc.)
- 5.3 Sorting systems
- 5.3.1 Linear sorters
- 5.3.2 Tilt-tray sorters
- 5.3.3 Cross-belt sorters
- 5.3.4 Destination coded vehicle (DCV) system
- 5.4 Check-in and loading systems
- 5.4.1 Self-bag drop units
- 5.4.2 Manual check-in conveyors
- 5.4.3 Induction systems
- 5.5 Screening systems
- 5.5.1 Integrated explosive detection systems (EDS)
- 5.5.2 CT-based scanners
- 5.5.3 Automated tray return systems (ATRS)
Chapter 6 Market Estimates & Forecast, By Capacity, 2021 - 2034 (USD Billion) (Thousand Units)
- 6.1 Key trends
- 6.2 Upto 2500 bags/ hr
- 6.3 2500-6000 bags/hr
- 6.4 Above 6000 bags/hr
Chapter 7 Market Estimates & Forecast, By Mode of Operation, 2021 - 2034 (USD Billion) (Thousand Units)
- 7.1 Key trends
- 7.2 Automatic systems
- 7.3 Semi-automatic systems
Chapter 8 Market Estimates & Forecast, By Technology, 2021 - 2034 (USD Billion) (Thousand Units)
- 8.1 Key trends
- 8.2 Barcode scanning systems
- 8.3 RFID-based systems
- 8.4 Others
Chapter 9 Market Estimates & Forecast, By End Use, 2021 - 2034, (USD Billion) (Thousand Units)
- 9.1 Key trends
- 9.2 Airport
- 9.3 Railway system
- 9.4 Cruise terminal
- 9.5 Military & defense
- 9.6 Others
Chapter 10 Market Estimates & Forecast, By Region, 2021 - 2034, (USD Billion) (Thousand Units)
- 10.1 Key trends
- 10.2 North America
- 10.2.1 U.S.
- 10.2.2 Canada
- 10.3 Europe
- 10.3.1 Germany
- 10.3.2 U.K.
- 10.3.3 France
- 10.3.4 Italy
- 10.3.5 Spain
- 10.3.6 Netherlands
- 10.4 Asia Pacific
- 10.4.1 China
- 10.4.2 India
- 10.4.3 Japan
- 10.4.4 South Korea
- 10.4.5 Australia
- 10.5 Latin America
- 10.5.1 Brazil
- 10.5.2 Mexico
- 10.5.3 Argentina
- 10.6 MEA
- 10.6.1 UAE
- 10.6.2 Saudi Arabia
- 10.6.3 South Africa
Chapter 11 Company Profiles (Business Overview, Financial Data, Product Landscape, Strategic Outlook, SWOT Analysis)
- 11.1 Alstef Group
- 11.2 BCS Group
- 11.3 BEUMER Group
- 11.4 CIMC-TianDa Holdings
- 11.5 Daifuku Co., Ltd.
- 11.6 Fives Group
- 11.7 G&S Airport Conveyor
- 11.8 Glidepath Group
- 11.9 Leonardo S.p.A.
- 11.10 Logan Teleflex
- 11.11 Pteris Global Ltd.
- 11.12 Siemens Logistics GmbH
- 11.13 SITA
- 11.14 Vanderlande Industries B.V.
