


|
시장보고서
상품코드
1782112
탄산화 및 질소화 시스템 시장 : 시장 기회, 성장 촉진요인, 산업 동향 분석, 예측(2025-2034년)Carbonation and Nitrogenation Systems Market Opportunity, Growth Drivers, Industry Trend Analysis, and Forecast 2025 - 2034 |
||||||
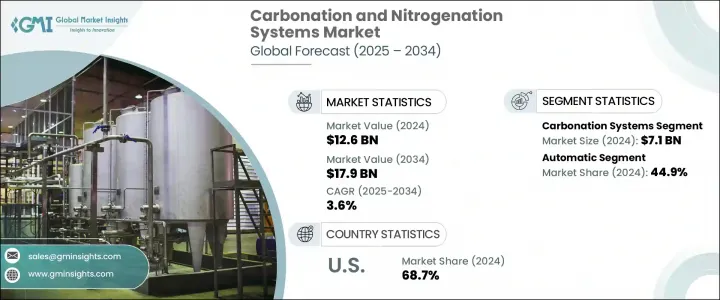
세계의 탄산화 및 질소화 시스템 시장은 2024년에는 126억 달러로 평가되었고, CAGR 3.6%로 성장할 전망이며, 2034년에는 179억 달러에 이를 것으로 추정됩니다.
이 시장은 스파클링, 탄산, 질소 음료에 대한 수요가 가속화되고 있는 식품 및 식품 제조 에코 시스템에서 중요한 역할을 하고 있습니다. 소비자들은 독특한 감각을 제공하는 음료에 점점 더 끌리고 있으며, 가스 주입 시스템은 그러한 품질을 제공하는 핵심이 되고 있습니다. 이러한 시스템은, 일상적인 청량 음료로부터 특수한 웰니스 음료까지, 폭넓은 음료 카테고리에서 사용되고 있어, 텍스처, 맛, 보존 안정성을 향상시키고 있습니다. 또한 기액 혼합을 필요로 하는 프로세스를 지원하는 이러한 시스템은 의약품 제조 및 기타 산업 용도에서도 그 유용성이 확대되고 있습니다.
이 시장의 주요 성장 촉진요인 중 하나는 더 건강하고 프리미엄 음료를 요구하는 소비자 경향의 변화이며, 신흥 시장에서 도시화 및 가처분 소득 증가라는 큰 트렌드이기도 합니다. 그 결과, 제조업체는 신속한 기술 혁신 및 기호의 변화에 대한 대응을 재촉당하고 있으며, 특히 인구밀도가 높은 지역에서는, 바로 마실 수 있는 음료나 외출처에서의 음료 수요가 급증하고 있습니다. 이러한 기대에 부응하기 위해 테크놀로지는 변혁적인 역할을 하고 있습니다.
| 시장 범위 | |
|---|---|
| 시작 연도 | 2024년 |
| 예측 연도 | 2025-2034년 |
| 시작 금액 | 126억 달러 |
| 예측 금액 | 179억 달러 |
| CAGR | 3.6% |
최신 탄산화 및 질소화 장치는 더 이상 기본 기능에 국한되지 않습니다. 오늘날의 시스템은 자동화를 통해 에너지 효율적인 성능, 운영 비용 절감, 높은 확장성을 제공합니다. 디지털 제어 시스템과의 통합이 강화됨에 따라 생산자는 가스 주입 수준을 미세 조정할 수 있어 품질과 일관성이 향상됩니다. 음료 기술 혁신이 진화를 계속하는 가운데, 보다 매끄러운 입맛과 신선도의 향상을 실현한 가스 주입 제제가 새로운 제품의 가능성을 넓혀, 이러한 선진 시스템의 채용에 박차를 가하고 있습니다.
장비 유형별로 시장은 탄산화 및 질소화 시스템으로 나뉩니다. 탄산화 시스템 부문은 인라인 탄산화 기술과 배치식 탄산화 기술을 포함하여 2024년 최대 점유율을 차지했으며, 71억 달러의 매출을 기록했습니다. 이 분야는 탄산음료에 대한 세계 수요가 계속되고 있기 때문에 널리 사용되고 있습니다. 스파클링 워터이든, 플레이버가 있는 건강 음료이든 다른 탄산 음료이든, 탄산 음료의 매력은 여전히 강합니다. 이 시스템은 액체에 탄산 가스를 도입하여 작동합니다. 이 프로세스는 가스 손실 감소, 에너지 절약 강화, 고속 생산 라인으로의 원활한 통합을 가능하게 하는 기술 개선으로 점점 정교해지고 있습니다.
주입, 퍼지, 충전 장치로 구성된 질소화 시스템도 특히 텍스처와 제품의 차별화가 중요한 제제에 있어서 지지를 모으고 있습니다. 그러나 탄산화 시스템은 그 용도 범위의 넓이에서 계속해서 앞서고 있습니다.
자동화 수준별로 분류하면 시장은 수동, 반자동, 자동 시스템으로 분류됩니다. 2024년에는 자동 시스템이 세계 시장 점유율의 44.9%, 금액으로 57억 달러를 차지했으며 지배적인 카테고리로 떠올랐습니다. 이러한 시스템은 복잡한 가스 주입 작업을 최소한의 인적 감시로 수행하도록 설계되어 있습니다. 프로그래머블 로직 컨트롤러, 고급 센서, 사용자 친화적인 디지털 인터페이스를 특징으로 하는 자동 솔루션을 통해 투여량과 압력 수준을 정확하게 제어할 수 있습니다. 이로 인해 제품의 품질뿐만 아니라 작업 효율도 향상되고 수작업을 통한 조정의 필요성이 줄어 인건비가 절감됩니다. 이러한 특징에 의해, 자동 시스템은, 유연성과 라인으로의 신속한 제품 전환을 요구하는 신흥 기업 및 기존의 음료 제조업체에 있어서, 특히 매력적인 것이 되고 있습니다.
이러한 시스템의 확장성을 통해 제조업체는 특히 질소 함유 음료가 인기를 끌고 있는 프리미엄 음료 부문에서 시장 동향에 신속하게 대응할 수 있습니다. 또한 지속가능성을 요구하는 움직임으로써, 디바이스 제조업체는 소비 에너지가 적고, 폐기물의 발생이 적고, 환경에 배려한 생산 워크플로우에 용이하게 통합할 수 있는 장치를 개발하게 되었습니다.
지역별로는 미국이 2024년 북미 시장의 대부분을 차지하며 지역별 점유율의 68.7%를 차지했습니다. 이 호조는 음료 가공 인프라에 대한 다액의 투자 및 급속한 기술 도입에 관련되어 있습니다. 미국의 시설에서는 자동화 솔루션이 표준이 되고 있으며 효율성, 제품의 일관성, 적응성이 소비자의 기대에 부응하기 위해 매우 중요합니다. 게다가 틈새 음료 부문의 출현에 의해, 입맛을 좋게 하거나 탄산 및 질소의 프로파일을 커스터마이즈하거나 할 수 있는 시스템에의 수요가 계속 높아지고 있습니다.
탄산화 및 질소화 시스템 분야의 주요 기업은 시장에서의 프레즌스를 확대하고 제품 라인업을 다양화하기 위해 M&A와 전략적 제휴를 적극적으로 추진하고 있습니다. 이 업계는 경쟁이 치열해 대기업, 중견 제조업체, 전문성이 높은 신흥 기업이 혁신, 커스터마이징, 지속 가능한 제품 개발을 통해 시장 점유율을 다투고 있습니다. 세계 기업이 하이테크 통합 시스템을 시장에 투입하는 한편, 많은 지역 프로바이더는, 특정의 생산 요구에 대응하는 비용 효율이 높은, 지역 적합 솔루션에 중점을 두고 있습니다.
목차
제1장 조사 방법 및 범위
제2장 주요 요약
제3장 업계 인사이트
- 생태계 분석
- 공급자의 상황
- 이익률
- 각 단계에서의 부가가치
- 밸류체인에 영향을 주는 요인
- 업계에 미치는 영향요인
- 성장 촉진요인
- 탄산음료 및 질소음료 수요 증가
- 산업 및 의약품 용도에서 채용 증가
- 기술적 진보
- 업계의 잠재적 위험 및 과제
- 높은 자본 비용 및 운영 비용
- 기술적 복잡성
- 기회
- 성장 촉진요인
- 성장 가능성 분석
- 장래 시장 동향
- 기술 및 혁신의 상황
- 현재의 기술 동향
- 신흥기술
- 가격 동향
- 지역별
- 유형별
- 규제 상황
- 표준 및 컴플라이언스 요건
- 지역 규제 틀
- 인증기준
- Porter's Five Forces 분석
- PESTEL 분석
제4장 경쟁 구도
- 서문
- 기업의 시장 점유율 분석
- 지역별
- 기업 매트릭스 분석
- 주요 시장 기업의 경쟁 분석
- 경쟁 포지셔닝 매트릭스
- 주요 발전
- 합병 및 인수
- 파트너십 및 협업
- 신제품 발매
- 확장 계획
제5장 시장 추계 및 예측 : 디바이스 유형별(2021-2034년)
- 주요 동향
- 탄산화 시스템
- 인라인 탄산화 시스템
- 배치 탄산화 시스템
- 질소화 시스템
- 주입 시스템
- 충전 시스템
- 퍼지 시스템
- 기타
제6장 시장 추계 및 예측 : 자동화 레벨별(2021-2034년)
- 주요 동향
- 수동
- 반자동
- 자동
제7장 시장 추계 및 예측 : 용도별(2021-2034년)
- 주요 동향
- 식품
- 음료
- 의약품
- 화학약품
- 기타
제8장 시장 추계 및 예측 : 유통 채널별(2021-2034년)
- 주요 동향
- 직접
- 간접
제9장 시장 추계 및 예측 : 지역별(2021-2034년)
- 주요 동향
- 북미
- 미국
- 캐나다
- 유럽
- 독일
- 영국
- 프랑스
- 스페인
- 이탈리아
- 아시아태평양
- 중국
- 일본
- 인도
- 호주
- 한국
- 라틴아메리카
- 브라질
- 멕시코
- 아르헨티나
- 중동 및 아프리카
- 남아프리카
- 사우디아라비아
- 아랍에미리트(UAE)
제10장 기업 프로파일
- APV
- Arol SpA
- Feldmeier Equipment Inc.
- GEA Group
- KHS GmbH
- Krones AG
- Linde Engineering
- MBE Technology
- NDC Technologies
- Procomac
- Schaefer Technologies Inc.
- Sidel Group
- Tenco Equipment Inc.
- Tetra Pak
- Zhejiang Shenghui Machinery Co., Ltd.
The Global Carbonation and Nitrogenation Systems Market was valued at USD 12.6 billion in 2024 and is estimated to grow at a CAGR of 3.6% to reach USD 17.9 billion by 2034. This market plays a crucial role in the food and beverage manufacturing ecosystem, where the demand for sparkling, carbonated, and nitrogen-infused beverages continues to accelerate. Consumers are increasingly drawn to drinks that offer unique sensory experiences, and gas infusion systems are at the core of delivering such quality. These systems are used across a broad spectrum of beverage categories-from everyday soft drinks to specialized wellness drinks-enhancing texture, taste, and shelf stability. Additionally, these systems are finding expanding utility across pharmaceutical manufacturing and other industrial applications, supporting processes that require gas-liquid mixing.

One of the key growth drivers behind this market is the shifting consumer inclination toward healthier and more premium beverage options, as well as the broader trend of urbanization and rising disposable incomes in emerging markets. As a result, manufacturers are under pressure to innovate rapidly and adapt to changing preferences, especially in densely populated regions where demand for ready-to-drink and on-the-go beverages is surging. Technology is playing a transformative role in meeting these expectations.
| Market Scope | |
|---|---|
| Start Year | 2024 |
| Forecast Year | 2025-2034 |
| Start Value | $12.6 Billion |
| Forecast Value | $17.9 Billion |
| CAGR | 3.6% |
Modern carbonation and nitrogenation equipment is no longer limited to basic functionality. Today's systems are increasingly automated, offering energy-efficient performance, reduced operational costs, and high scalability. Enhanced integration with digital control systems is further enabling producers to fine-tune gas infusion levels, resulting in better quality and consistency. As beverage innovation continues to evolve, gas-infused formulations with smoother mouthfeel and improved freshness are opening up new product possibilities, spurring the adoption of these advanced systems.
In terms of equipment type, the market is divided into carbonation and nitrogenation systems. The carbonation systems segment-which includes inline and batch carbonation technologies-held the largest share in 2024, generating USD 7.1 billion in revenue. This segment is seeing widespread use due to the continued global demand for carbonated beverages. Whether it's sparkling water, flavored health drinks, or other fizzy refreshments, the appeal of carbonated options remains strong. These systems function by introducing carbon dioxide into liquids, a process that has become increasingly refined with technological improvements that reduce gas loss, enhance energy conservation, and enable seamless integration into high-speed production lines.
Nitrogenation systems-comprising infusion, purging, and filling equipment-are also gaining traction, especially in formulations where texture and product differentiation are critical. However, carbonation systems continue to lead due to their broader application scope.
When segmented by automation level, the market is categorized into manual, semi-automatic, and automatic systems. In 2024, automatic systems emerged as the dominant category, accounting for 44.9% of the global market share with a value of USD 5.7 billion. These systems are engineered to perform complex gas infusion tasks with minimal human oversight. Featuring programmable logic controllers, advanced sensors, and user-friendly digital interfaces, automatic solutions allow precise control over dosing and pressure levels. This enhances not just product quality but also operational efficiency, reducing the need for manual adjustments and lowering labor costs. These features make automatic systems particularly attractive for both emerging startups and established beverage producers who seek flexibility and rapid product switching on their lines.
The scalability of these systems enables manufacturers to respond swiftly to market trends, especially in the premium beverage segment, where nitrogen-infused drinks are gaining popularity. Additionally, the drive for sustainability has prompted equipment makers to develop machines that consume less energy, produce less waste, and integrate easily into environmentally conscious production workflows.
Regionally, the United States accounted for a major portion of the North American market in 2024, contributing 68.7% of the regional share. This strong performance can be linked to significant investments in beverage processing infrastructure and rapid technological adoption. Automated solutions are becoming standard in U.S. facilities, where efficiency, product consistency, and adaptability are crucial to meeting consumer expectations. Furthermore, the emergence of niche beverage segments continues to fuel demand for systems capable of delivering enhanced mouthfeel and customized carbonation or nitrogenation profiles.
Leading companies in the carbonation and nitrogenation systems space are actively pursuing mergers, acquisitions, and strategic collaborations to expand their market presence and diversify product offerings. The industry is marked by intense competition, with major players, mid-sized manufacturers, and specialized startups all vying for market share through innovation, customization, and sustainable product development. While global firms bring high-tech integrated systems to the market, many regional providers focus on cost-effective, locally adapted solutions that meet specific production needs.
Table of Contents
Chapter 1 Methodology and Scope
- 1.1 Market scope and definition
- 1.2 Research design
- 1.2.1 Research approach
- 1.2.2 Data collection methods
- 1.3 Data mining sources
- 1.3.1 Global
- 1.3.2 Regional/Country
- 1.4 Base estimates and calculations
- 1.4.1 Base year calculation
- 1.4.2 Key trends for market estimation
- 1.5 Primary research and validation
- 1.5.1 Primary sources
- 1.6 Forecast model
- 1.7 Research assumptions and limitations
Chapter 2 Executive Summary
- 2.1 Industry 3600 synopsis
- 2.2 Key market trends
- 2.2.1 Regional
- 2.2.2 Equipment type
- 2.2.3 Automation level
- 2.2.4 Application
- 2.2.5 Distribution channel
- 2.3 CXO perspectives: Strategic imperatives
- 2.3.1 Key decision points for industry executives
- 2.3.2 Critical success factors for market players
- 2.4 Future outlook and strategic recommendations
Chapter 3 Industry Insights
- 3.1 Industry ecosystem analysis
- 3.1.1 Supplier landscape
- 3.1.2 Profit margin
- 3.1.3 Value addition at each stage
- 3.1.4 Factor affecting the value chain
- 3.2 Industry impact forces
- 3.2.1 Growth drivers
- 3.2.1.1 Growing demand for carbonated and nitrogenated beverages
- 3.2.1.2 Rising adoption in industrial and pharmaceutical applications
- 3.2.1.3 Technological advancements
- 3.2.2 Industry pitfalls & challenges
- 3.2.2.1 High capital and operating costs
- 3.2.2.2 Technological complexity
- 3.2.3 Opportunities
- 3.2.1 Growth drivers
- 3.3 Growth potential analysis
- 3.4 Future market trends
- 3.5 Technology and innovation landscape
- 3.5.1 Current technological trends
- 3.5.2 Emerging technologies
- 3.6 Price trends
- 3.6.1 By region
- 3.6.2 By type
- 3.7 Regulatory landscape
- 3.7.1 Standards and compliance requirements
- 3.7.2 Regional regulatory frameworks
- 3.7.3 Certification standards
- 3.8 Porter’s analysis
- 3.9 PESTEL analysis
Chapter 4 Competitive Landscape, 2024
- 4.1 Introduction
- 4.2 Company market share analysis
- 4.2.1 By region
- 4.2.1.1 North America
- 4.2.1.2 Europe
- 4.2.1.3 Asia Pacific
- 4.2.1.4 Latin America
- 4.2.1.5 MEA
- 4.2.1 By region
- 4.3 Company matrix analysis
- 4.4 Competitive analysis of major market players
- 4.5 Competitive positioning matrix
- 4.6 Key developments
- 4.6.1 Mergers & acquisitions
- 4.6.2 Partnerships & collaborations
- 4.6.3 New product launches
- 4.6.4 Expansion plans
Chapter 5 Market Estimates and Forecast, By Equipment Type, 2021 - 2034 (USD Billion) (Thousand Units)
- 5.1 Key trends
- 5.2 Carbonation systems
- 5.2.1 Inline carbonation systems
- 5.2.2 Batch carbonation systems
- 5.3 Nitrogenation systems
- 5.3.1 Infusion systems
- 5.3.2 Filling systems
- 5.3.3 Purging systems
- 5.3.4 Others
Chapter 6 Market Estimates and Forecast, By Automation Level, 2021 - 2034 (USD Billion) (Thousand Units)
- 6.1 Key trends
- 6.2 Manual
- 6.3 Semi-automatic
- 6.4 Automatic
Chapter 7 Market Estimates and Forecast, By Application, 2021 - 2034 (USD Billion) (Thousand Units)
- 7.1 Key trends
- 7.2 Food
- 7.3 Beverages
- 7.4 Pharmaceuticals
- 7.5 Chemicals
- 7.6 Others
Chapter 8 Market Estimates and Forecast, By Distribution Channel, 2021 - 2034 (USD Billion) (Thousand Units)
- 8.1 Key trends
- 8.2 Direct
- 8.3 Indirect
Chapter 9 Market Estimates and Forecast, By Region, 2021 - 2034 (USD Billion) (Thousand Units)
- 9.1 Key trends
- 9.2 North America
- 9.2.1 U.S.
- 9.2.2 Canada
- 9.3 Europe
- 9.3.1 Germany
- 9.3.2 UK
- 9.3.3 France
- 9.3.4 Spain
- 9.3.5 Italy
- 9.4 Asia Pacific
- 9.4.1 China
- 9.4.2 Japan
- 9.4.3 India
- 9.4.4 Australia
- 9.4.5 South Korea
- 9.5 Latin America
- 9.5.1 Brazil
- 9.5.2 Mexico
- 9.5.3 Argentina
- 9.6 Middle East and Africa
- 9.6.1 South Africa
- 9.6.2 Saudi Arabia
- 9.6.3 UAE
Chapter 10 Company Profiles
- 10.1 APV
- 10.2 Arol S.p.A.
- 10.3 Feldmeier Equipment Inc.
- 10.4 GEA Group
- 10.5 KHS GmbH
- 10.6 Krones AG
- 10.7 Linde Engineering
- 10.8 MBE Technology
- 10.9 NDC Technologies
- 10.10 Procomac
- 10.11 Schaefer Technologies Inc.
- 10.12 Sidel Group
- 10.13 Tenco Equipment Inc.
- 10.14 Tetra Pak
- 10.15 Zhejiang Shenghui Machinery Co., Ltd.
