
|
시장보고서
상품코드
1782155
항공 전용 가스 터빈 서비스 시장 : 시장 기회, 성장 촉진요인, 산업 동향 분석, 예측(2025-2034년)Aeroderivative Gas Turbine Service Market Opportunity, Growth Drivers, Industry Trend Analysis, and Forecast 2025 - 2034 |
||||||
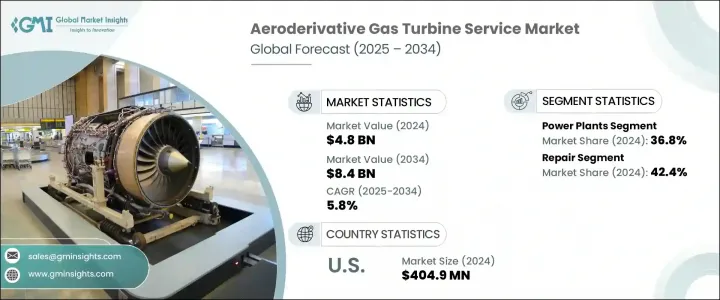
세계의 항공 전용 가스 터빈 서비스 시장 규모는 2024년에는 48억 달러로 평가되었고, CAGR 9.2%로 성장할 전망이며, 2034년에는 84억 달러에 이를 것으로 예측됩니다.
바이오가스나 암모니아와 같은 저탄소 배출 연료에 의한 터빈 효율의 향상이 중시되게 되어, 시장의 기세에 박차가 걸려 있습니다. 항공 전용 터빈은 원래 항공용으로 설계된 것이지만, 현재는 산업용이나 발전용으로 널리 전용되고 있어 유지보수, 오버홀, 수리 등의 정비는 터빈의 수명을 늘리고 피크 시의 효율을 유지하기 위해 필수적입니다. 환경 정책이 강화되고 CO2와 NO2의 배출량 감축이 요구되는 가운데 사업자들은 기존 터빈을 완전히 교체하는 대신 연료에 유연하게 대응할 수 있는 연소기와 저배출 가스 버너 시스템을 적극 도입하고 있습니다.
장기 서비스 계약 및 터빈 임대 계약도 사업자의 재무 위험을 최소화하는 데 중요한 역할을 하고 있으며, 예측 가능한 유지 보수 비용과 시스템 가동 시간을 보장합니다. 많은 터빈 플리트, 특히 2005년 이전에 도입된 터빈의 내용연수는 20년을 넘고 있어 업그레이드 수요의 큰 물결이 밀려오고 있습니다.
| 시장 범위 | |
|---|---|
| 시작 연도 | 2024년 |
| 예측 연도 | 2025-2034년 |
| 시작 금액 | 48억 달러 |
| 예측 금액 | 84억 달러 |
| CAGR | 9.2% |
2024년 발전소 부문의 점유율은 36.8%로 평가되었고, 2034년까지 CAGR 6%로 성장이 예측됩니다. 특히 NOx 규제와 관련된 배출가스 모니터링과 지속적인 규제 준수에 대한 수요가 증가함에 따라 유지보수 간격이 연장되고 서비스 요구가 증가하고 있습니다. 터빈의 빈번한 사이클 운전, 특히 피크 부하 운전은 로터 어셈블리 및 연료 제어 시스템과 같은 부품의 마모를 가속화하고 다양한 지역에서 종합적인 서비스 지원의 필요성을 높입니다.
수리 서비스 분야는 2024년에 42.4%의 점유율을 차지했으며, 2025-2034년 연평균 복합 성장률(CAGR) 5.5%를 보일 것으로 예측됩니다. 플라즈마 코팅, 첨단 적층 성형, 정밀 용접 기술의 채용이 증가하고 있으며, 터빈의 중요한 부품의 가동 수명 연장에 도움이 되고 있습니다. 이는 내부식성 부품 수요가 급증하는 해양, 석유 및 가스 분야에서 특히 중요하며 서비스 포트폴리오를 더욱 강화하고 애프터마켓 수요에 박차를 가하고 있습니다.
미국의 항공 전용 가스 터빈 서비스 시장은 2024년에 89.6%의 점유율을 차지해, 4억 490만 달러를 기록했습니다. 인구 증가 및 피크 부하 증가에 따른 에너지 수요 증가가 대부분의 경우 고정 가격 유지보수 계약 하에서 항공 전용 터빈의 전개를 가속화시키고 있습니다. 국가의 정책 지원과 특히 정부가 지원하는 주요 프로그램 하에서 에너지 전환 이니셔티브를 향한 자금이 신재생 에너지원의 백업 솔루션으로서 필수적인 이러한 터빈에 대한 관심을 높이고 있습니다. 수소 연료 및 듀얼 연료 터빈 프로젝트의 확대도 기술자 훈련, 연소 시스템 업그레이드, 씰 교체 프로그램에 대한 투자를 촉진하여 전문적인 터빈 정비 수요를 강화하고 있습니다.
주요 기업으로는 Siemens Energy, MAN Energy Solutions, GE Vernova, Ansaldo Energia, and Mitsubishi Heavy Industries. 등이 있습니다. 시장 경쟁력을 강화하기 위해 각 회사는 라이프 사이클 지원, 혁신, 현지화에 중점을 둔 다각적 전략을 채택하고 있습니다. 대기업은 터빈의 다운타임을 최소화하고 서비스 대응력을 높이기 위해 디지털 진단과 예지보전 플랫폼에 투자하고 있습니다. 글로벌 서비스 허브를 확대하고 원격 모니터링 기능을 배치해 서비스상의 문제를 신속하게 해결할 수 있습니다. 기업은 또한 장기 서비스 계약으로 사업자와 제휴하여 비용의 예측 가능성과 성능 보증을 제공하고 있습니다. 전문적인 연구개발 투자는 청정에너지 목표에 부합하도록 저NOx 연소기, 내부식성 코팅, 연료 유연성 시스템 개발을 추진하고 있습니다. 하이브리드 시스템과 수소 혼합 시스템의 진화하는 기술적 수요에 대응하기 위해 인재 육성 프로그램이 강화되고 차세대 에너지 인프라에 대한 서비스 대응력이 확보되고 있습니다.
목차
제1장 조사 방법 및 범위
제2장 주요 요약
제3장 업계 인사이트
- 생태계 분석
- 규제 상황
- 업계에 미치는 영향요인
- 성장 촉진요인
- 업계의 잠재적 위험 및 과제
- 성장 가능성 분석
- Porter's Five Forces 분석
- PESTEL 분석
제4장 경쟁 구도
- 서문
- 기업의 시장 점유율 분석 : 지역별
- 북미
- 유럽
- 아시아태평양
- 중동 및 아프리카
- 라틴아메리카
- 전략적 대시보드
- 전략적 노력
- 경쟁 벤치마킹
- 혁신 및 기술의 상황
제5장 시장 규모 및 예측 : 서비스별(2021-2034년)
- 주요 동향
- 유지보수
- 수리
- 오버홀
- 기타
제6장 시장 규모 및 예측 : 서비스 제공업체별(2021-2034년)
- 주요 동향
- OEM
- 비 OEM
제7장 시장 규모 및 예측 : 용도별(2021-2034년)
- 주요 동향
- 발전소
- 석유 및 가스
- 프로세스 플랜트
- 항공
- 해양
- 기타
제8장 시장 규모 및 예측 : 지역별(2021-2034년)
- 주요 동향
- 북미
- 미국
- 캐나다
- 멕시코
- 유럽
- 영국
- 프랑스
- 독일
- 러시아
- 이탈리아
- 네덜란드
- 핀란드
- 그리스
- 덴마크
- 루마니아
- 폴란드
- 스웨덴
- 아시아태평양
- 중국
- 인도
- 호주
- 일본
- 한국
- 인도네시아
- 태국
- 말레이시아
- 중동 및 아프리카
- 사우디아라비아
- 아랍에미리트(UAE)
- 카타르
- 쿠웨이트
- 오만
- 이집트
- 튀르키예
- 바레인
- 이라크
- 요르단
- 레바논
- 남아프리카
- 나이지리아
- 알제리
- 케냐
- 라틴아메리카
- 브라질
- 아르헨티나
- 페루
- 칠레
제9장 기업 프로파일
- Ansaldo Energia
- Centrax Gas Turbines
- Destinus Energy
- EthosEnergy
- GE Vernova
- JSC United Engine
- Kawasaki Heavy Industries
- MAN Energy Solutions
- Mitsubishi Heavy Industries
- MJB International
- MTU Aero Engines
- PROENERGY
- RWG
- Siemens Energy
- Solar Turbines
- Sulzer
- TRS SERVICES
- VERICOR
The Global Aeroderivative Gas Turbine Service Market was valued at USD 4.8 billion in 2024 and is estimated to grow at a CAGR of 9.2% to reach USD 8.4 billion by 2034. Growing emphasis on improving turbine efficiency with lower carbon-emission fuels like biogas and ammonia is fueling market momentum. Aeroderivative turbines, originally engineered for aviation, are now widely adapted for industrial and power generation, and their servicing-including maintenance, overhauls, and repairs-is vital to prolong their lifespan and maintain peak efficiency. As tightening environmental policies demand lower CO2 and NO2 emissions, operators are actively retrofitting existing turbines with fuel-flexible combustors and low-emission burner systems instead of replacing units entirely.

Long-term service contracts and turbine leasing arrangements are also playing a significant role in minimizing financial risks for operators, offering predictable maintenance costs and guaranteed system uptime. Many turbine fleets, especially those deployed before 2005, have surpassed two decades of service life, creating a strong wave of upgrade demand that is expected to peak between 2026 and 2030 as global fleets enter critical mid-to-end-of-life cycles.
| Market Scope | |
|---|---|
| Start Year | 2024 |
| Forecast Year | 2025-2034 |
| Start Value | $4.8 Billion |
| Forecast Value | $8.4 Billion |
| CAGR | 9.2% |
In 2024, the power plant segment contributed a 36.8% share and is forecast to grow at a CAGR of 6% through 2034. Increasing demand for emission monitoring and ongoing regulatory compliance, particularly related to NOx limits, is extending maintenance intervals and intensifying service needs. Frequent cycling of turbines, especially in peak load operations, is accelerating wear in components like rotor assemblies and fuel control systems, driving up the need for comprehensive service support across various geographies.
The repair services segment held a 42.4% share in 2024 and is anticipated to grow at a CAGR of 5.5% from 2025 to 2034. The rising adoption of plasma coatings, advanced additive manufacturing, and precision welding techniques is helping extend the operational life of critical components in turbines. This is particularly important in the marine and oil & gas sectors, where demand for corrosion-resistant parts is surging, further strengthening the service portfolio and fueling aftermarket demand.
United States Aeroderivative Gas Turbine Service Market held an 89.6% share in 2024 and recorded USD 404.9 million. Rising energy demand tied to population growth and peak load increases has accelerated the deployment of aeroderivative turbines, often under fixed-price maintenance agreements. National policy support and funding directed at energy transition initiatives, especially under major government-backed programs, are driving interest in these turbines as essential backup solutions for renewable sources. The expansion of hydrogen-fueled and dual-fuel turbine projects is also encouraging investment in technician training, combustion system upgrades, and seal replacement programs, strengthening the demand for specialized turbine servicing.
Top industry players include Siemens Energy, MAN Energy Solutions, GE Vernova, Ansaldo Energia, and Mitsubishi Heavy Industries. To enhance their competitiveness in the aeroderivative gas turbine service market, companies are adopting multi-pronged strategies focused on lifecycle support, innovation, and localization. Major players are investing in digital diagnostics and predictive maintenance platforms to minimize turbine downtime and boost service responsiveness. Expanding global service hubs and deploying remote monitoring capabilities allow for quicker resolution of service issues. Firms are also partnering with operators on long-term service contracts to provide cost predictability and performance guarantees. Specialized R&D investments are driving the development of low-NOx combustors, corrosion-resistant coatings, and fuel-flexible systems to align with clean energy goals. Workforce training programs are being ramped up to meet the evolving technical demands of hybrid and hydrogen-blended systems, ensuring service readiness for next-gen energy infrastructures.
Table of Contents
Chapter 1 Methodology & Scope
- 1.1 Research design
- 1.2 Market estimates & forecast parameters
- 1.3 Forecast calculation
- 1.4 Data sources
- 1.4.1 Primary
- 1.4.2 Secondary
- 1.4.2.1 Paid
- 1.4.2.2 Public
- 1.5 Market definitions
Chapter 2 Executive Summary
- 2.1 Industry synopsis, 2021 - 2034
Chapter 3 Industry Insights
- 3.1 Industry ecosystem analysis
- 3.2 Regulatory landscape
- 3.3 Industry impact forces
- 3.3.1 Growth drivers
- 3.3.2 Industry pitfalls & challenges
- 3.4 Growth potential analysis
- 3.5 Porter's analysis
- 3.5.1 Bargaining power of suppliers
- 3.5.2 Bargaining power of buyers
- 3.5.3 Threat of new entrants
- 3.5.4 Threat of substitutes
- 3.6 PESTEL analysis
Chapter 4 Competitive Landscape, 2025
- 4.1 Introduction
- 4.2 Company market share analysis, by region, 2024
- 4.2.1 North America
- 4.2.2 Europe
- 4.2.3 Asia Pacific
- 4.2.4 Middle East & Africa
- 4.2.5 Latin America
- 4.3 Strategic dashboard
- 4.4 Strategic initiatives
- 4.5 Competitive benchmarking
- 4.6 Innovation & technology landscape
Chapter 5 Market Size and Forecast, By Service, 2021 - 2034 (USD Million)
- 5.1 Key trends
- 5.2 Maintenance
- 5.3 Repair
- 5.4 Overhaul
- 5.5 Others
Chapter 6 Market Size and Forecast, By Service Provider, 2021 - 2034 (USD Million)
- 6.1 Key trends
- 6.2 OEM
- 6.3 Non-OEM
Chapter 7 Market Size and Forecast, By Application, 2021 - 2034 (USD Million)
- 7.1 Key trends
- 7.2 Power plants
- 7.3 Oil & gas
- 7.4 Process plants
- 7.5 Aviation
- 7.6 Marine
- 7.7 Others
Chapter 8 Market Size and Forecast, By Region, 2021 - 2034 (USD Million)
- 8.1 Key trends
- 8.2 North America
- 8.2.1 U.S.
- 8.2.2 Canada
- 8.2.3 Mexico
- 8.3 Europe
- 8.3.1 UK
- 8.3.2 France
- 8.3.3 Germany
- 8.3.4 Russia
- 8.3.5 Italy
- 8.3.6 Netherlands
- 8.3.7 Finland
- 8.3.8 Greece
- 8.3.9 Denmark
- 8.3.10 Romania
- 8.3.11 Poland
- 8.3.12 Sweden
- 8.4 Asia Pacific
- 8.4.1 China
- 8.4.2 India
- 8.4.3 Australia
- 8.4.4 Japan
- 8.4.5 South Korea
- 8.4.6 Indonesia
- 8.4.7 Thailand
- 8.4.8 Malaysia
- 8.5 Middle East & Africa
- 8.5.1 Saudi Arabia
- 8.5.2 UAE
- 8.5.3 Qatar
- 8.5.4 Kuwait
- 8.5.5 Oman
- 8.5.6 Egypt
- 8.5.7 Turkey
- 8.5.8 Bahrain
- 8.5.9 Iraq
- 8.5.10 Jordan
- 8.5.11 Lebanon
- 8.5.12 South Africa
- 8.5.13 Nigeria
- 8.5.14 Algeria
- 8.5.15 Kenya
- 8.6 Latin America
- 8.6.1 Brazil
- 8.6.2 Argentina
- 8.6.3 Peru
- 8.6.4 Chile
Chapter 9 Company Profiles
- 9.1 Ansaldo Energia
- 9.2 Centrax Gas Turbines
- 9.3 Destinus Energy
- 9.4 EthosEnergy
- 9.5 GE Vernova
- 9.6 JSC United Engine
- 9.7 Kawasaki Heavy Industries
- 9.8 MAN Energy Solutions
- 9.9 Mitsubishi Heavy Industries
- 9.10 MJB International
- 9.11 MTU Aero Engines
- 9.12 PROENERGY
- 9.13 RWG
- 9.14 Siemens Energy
- 9.15 Solar Turbines
- 9.16 Sulzer
- 9.17 TRS SERVICES
- 9.18 VERICOR
