


|
시장보고서
상품코드
1797732
LCR 미터 시장 기회, 성장 촉진요인, 업계 동향 분석 및 예측(2025-2034년)LCR Meters Market Opportunity, Growth Drivers, Industry Trend Analysis, and Forecast 2025 - 2034 |
||||||
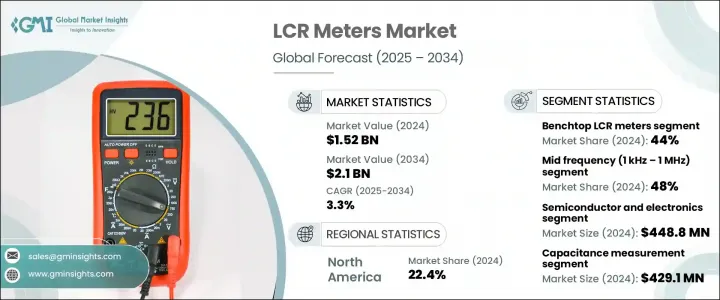
세계의 LCR 미터 시장 규모는 2024년에 15억 2,000만 달러로 평가되었고, CAGR 3.3%를 나타내 2034년에는 21억 달러에 달할 것으로 예측되고 있습니다.
이러한 꾸준한 성장의 배경에는 고효율 전자 시스템의 채용이 증가하고, 소비자용 전자 기기나 IoT 대응 디바이스의 보급이 진행되고 있는 일이 있습니다. 산업이 작고 고성능 전자 제품 개발에 주력하고 있기 때문에 첨단 LCR 측정 도구에 대한 수요가 급증하고 있습니다. LCR 미터의 통합은 부품의 정확성, 신뢰성 및 장기 안정성 테스트에 필수적입니다.

재료 및 회로 설계의 혁신으로 이러한 계측기는 정밀도 향상, 열 안정성 향상, 에너지 사용 감소를 실현합니다. 또한 에너지 효율, 환경 컴플라이언스, RoHS 지원 및 무연 부품으로의 전환과 같은 세계 동향은 다양한 산업에서 LCR 테스트의 중요성을 높입니다.
| 시장 범위 | |
|---|---|
| 시작 연도 | 2024년 |
| 예측 연도 | 2025-2034년 |
| 시작 금액 | 15억 2,000만 달러 |
| 예측 금액 | 21억 달러 |
| CAGR | 3.3% |
스마트 매뉴팩처링, 전자상거래 물류, 자동차 일렉트로닉스의 진화에 따라 제조업체는 소형화 설계 및 에너지 최적화 구성이 진행됨에 따라 품질 관리, 시스템 검증 및 구성 요소 매칭을 위한 첨단 LCR 솔루션에 대한 의존도를 높이고 있습니다. 생산 환경에서의 자동화, 연결성, 실시간 데이터 모니터링으로의 전환에 따라 디지털 품질 보증 워크플로우에 원활하게 통합할 수 있는 고정밀 테스트 장비가 요구되고 있습니다. LCR 미터는 인덕터, 커패시터, 저항기와 같은 수동 부품의 신뢰성을 보장하기 위해 특히 이러한 부품이 소형화되고 더 복잡한 회로 아키텍처에서 사용됨에 따라 중요한 역할을 수행합니다.
벤치탑 LCR 미터 부문은 2024년 6억 6,880만 달러를 창출했습니다. 탁월한 정밀도와 첨단 임피던스 분석으로 알려진 벤치탑 유형은 통신, 자동차, 반도체 등 다양한 산업용 실험실 및 검사 시설에 필수적인 구성 요소입니다. 이 소자들은 광범위한 주파수 범위를 제공하고 엄격한 측정 공차를 유지하기 때문에 다양한 검사 조건 하에서 성능 검증에 매우 적합합니다. 휴대용 모델에 비해 벤치탑형 LCR 미터는 보다 깊은 분석, 보다 우수한 데이터 분해능, 보다 빠른 테스트 사이클 타임을 제공하여 전문가가 매우 복잡한 시스템과 구성 요소의 품질 보증을 보장하는 데 도움이 됩니다.
2024년 커패시턴스 검사 부문은 LCR 미터 시장에서 큰 가치를 얻었고 4억 2,910만 달러에 달했습니다. 커패시터 측정은 회로의 설계와 신뢰성에 직접적인 영향을 미치기 때문에 전자 측정에 필수적인 기능으로 남아 있습니다. 전기통신, 소비자용 전자기기, 자동차용 용도 등 소형화된 디바이스에 복잡한 커패시터를 사용하게 되어 적층 세라믹 커패시터(MLCC)를 분석할 수 있는 정밀 기기 수요가 급증하고 있습니다. 제조업체 각 회사는 초기 설계 단계 및 최종 생산 단계에서 부품의 편차를 식별하고 잠재적 결함을 방지하기 위해 고정밀 LCR 미터를 사용합니다. 이 테스트는 안정적인 전기적 거동을 보장하고 다양한 산업의 성능과 규제 벤치마크를 충족시킬 수 있습니다.
미국의 LCR 미터 시장은 견고한 기술 인프라와 항공우주, 자동차, 일렉트로닉스 등의 부문에서 리더십을 통해 2024년 3억 66만 달러로 평가되었습니다. 반도체 제조, EV 개발, 5G 네트워크 확대에 있어서의 선진적 검사 기기에의 의존의 고조가, 고빈도, 자동화, 측정 정밀도를 제공하는 LCR 미터에 대한 수요를 강화하고 있습니다. 미국은 또한 광범위한 R&D 투자의 이점을 통해 제품 혁신, 시스템 통합 및 품질 관리 워크플로우에서 차세대 LCR 도구의 채택을 추진하고 있습니다. 전자 설계 기준이 점점 더 엄격해짐에 따라 시장은 고급 재료 테스트 및 장치 교정에 최적화된 보다 스마트한 소프트웨어 통합 LCR 미터로 이동하고 있습니다.
LCR 미터 산업 경쟁 구도는 IET Labs, Inc., Keysight Technologies, Hioki EE Corporation, GW Instek, Chrome ATE Inc, Yokogawa Electric Corporation, B& K Precision Corporation, Extech Instruments, Fluke Corporation, Agilent Technologies, Newton 4th Ltd(N4L) EE, Kik Electrical Instrument Corp., TECPEL Co. Ltd., Aplab Limited, Applent Instruments Inc., Victor Instruments, Scientific Mes-Technik Pvt. Ltd., Tonghui Electronics Co., Ltd. 등이 있습니다.
LCR 미터 산업 주요 기업은 시장에서의 존재를 확대하고 포지셔닝을 강화하기 위해 기술 혁신, 전략적 파트너십 및 고객 중심 개발에 주력하고 있습니다. 많은 기업들이 R&D에 투자하고 자동 검사 기능과 데이터 분석 기능을 강화한 컴팩트한 다기능 미터를 도입하고 있습니다. 또한 OEM, 연구기관 및 반도체 제조업체와 제휴하여 특정 검사 요구에 맞는 통합 솔루션을 제공합니다.
목차
제1장 조사 방법과 범위
제2장 주요 요약
제3장 산업 고찰
- 생태계 분석
- 공급자의 상황
- 이익률
- 비용 구조
- 각 단계에서의 부가가치
- 밸류체인에 영향을 주는 요인
- 파괴적 혁신
- 산업에 미치는 영향요인
- 성장 촉진요인
- 선진 일렉트로닉스(EV, 5G, IoT) 수요 증가
- 계측·자동화 기술의 진보
- 제품의 신뢰성과 품질 관리에 대한 관심 증가
- 반도체와 항공우주 부문에서의 연구개발 증가
- 스마트 제조 및 인더스트리 4.0 확대
- 산업의 잠재적 리스크 및 과제
- 지속 가능한 재료의 높은 비용
- 재활용 인프라의 갭
- 성장 촉진요인
- 성장 가능성 분석
- 규제 상황
- 북미
- 유럽
- 아시아태평양
- 라틴아메리카
- 중동 및 아프리카
- Porter's Five Forces 분석
- PESTEL 분석
- 기술과 혁신의 상황
- 현재의 기술 동향
- 신흥기술
- 가격 동향
- 과거의 가격 분석(2021-2024년)
- 가격 동향의 요인
- 지역별 가격 차이
- 가격 예측(2025-2034년)
- 가격 전략
- 새로운 비즈니스 모델
- 컴플라이언스 요건
- 지속가능성 대책
- 지속 가능한 재료의 평가
- 탄소발자국 분석
- 순환형 경제의 실현
- 지속가능성 인증 및 기준
- 지속가능성 ROI 분석
- 세계 소비자 감정 분석
- 특허 분석
제4장 경쟁 구도
- 서론
- 기업의 시장 점유율 분석
- 지역별
- 북미
- 유럽
- 아시아태평양
- 라틴아메리카
- 중동 및 아프리카
- 시장 집중 분석
- 지역별
- 주요 진출기업의 경쟁 벤치마킹
- 재무실적의 비교
- 수익
- 이익률
- 연구개발
- 제품 포트폴리오 비교
- 제품 라인업의 넓이
- 기술
- 파괴적 혁신
- 지리적 존재의 비교
- 세계 실적 분석
- 서비스 네트워크의 범위
- 지역에 의한 시장 침투율
- 경쟁 포지셔닝 매트릭스
- 리더
- 과제자
- 팔로워
- 틈새 진출기업
- 전략적 전망 매트릭스
- 재무실적의 비교
- 주요 개발(2021-2024년)
- 합병과 인수
- 파트너십 및 협업
- 기술적 진보
- 확대 및 투자 전략
- 지속가능성에 대한 노력
- 디지털 변혁의 대처
- 신흥기업/스타트업기업경쟁 구도
제5장 시장 추정·예측 : 유형별(2021-2034년)
- 주요 동향
- 핸드헬드 LCR 미터
- 벤치탑 LCR 미터
- 휴대용 LCR 미터
- 모듈형/자동 LCR 미터
제6장 시장 추정·예측 : 측정 파라미터별(2021-2034년)
- 주요 동향
- L(인덕턴스)
- C(커패시턴스)
- R(저항)
- Q(품질 계수)
- D(손실 계수)
- 임피던스
- 위상각도
- 어드미턴스(Y), 컨덕턴스(G), 서셉턴스(B)
제7장 시장 추정·예측 : 주파수 범위 유형별(2021-2034년)
- 주요 동향
- 저주파(1kHz 이하)
- 중주파(1kHz-1MHz)
- 고주파(1MHz 이상)
제8장 시장 추정·예측 : 최종 이용 산업별(2021-2034년)
- 주요 동향
- 제조
- 자동차
- 헬스케어
- 반도체 일렉트로닉스
- 항공우주 및 방위
- 학술 및 연구기관
- 유틸리티
- 기타(예: 재생에너지, IoT 디바이스 제조업체)
제9장 시장 추정·예측 : 지역별(2021-2034년)
- 주요 동향
- 북미
- 미국
- 캐나다
- 유럽
- 독일
- 영국
- 프랑스
- 스페인
- 이탈리아
- 네덜란드
- 아시아태평양
- 중국
- 인도
- 일본
- 호주
- 한국
- 라틴아메리카
- 브라질
- 멕시코
- 아르헨티나
- 중동 및 아프리카
- 사우디아라비아
- 남아프리카
- 아랍에미리트(UAE)
제10장 기업 프로파일
- Keysight Technologies
- Hioki EE Corporation
- Chroma ATE Inc.
- IET Labs, Inc.
- GW Instek(Good Will Instrument Co., Ltd.)
- B& K Precision Corporation
- Yokogawa Electric Corporation
- Fluke Corporation
- Agilent Technologies
- Extech Instruments
- Scientific Mes-Technik Pvt. Ltd.
- Newton4th Ltd(N4L)
- Kikusui Electronics Corporation
- Preen AC Power Corp.
- Applent Instruments Inc.
- DER EE Electrical Instrument Corp.
- TECPEL Co., Ltd.
- Victor Instruments(Shenzhen Victor Hi-Tech Co. Ltd.)
- Tonghui Electronics Co., Ltd.
- Aplab Limited
The Global LCR Meters Market was valued at USD 1.52 billion in 2024 and is estimated to grow at a CAGR of 3.3% to reach USD 2.1 billion by 2034. This steady growth is being fueled by the rising adoption of high-efficiency electronic systems and the increasing penetration of consumer electronics and IoT-enabled devices. As industries continue to focus on developing compact, high-performance electronics, the demand for advanced LCR measurement tools is surging. The integration of LCR meters is becoming vital in testing components for precision, reliability, and long-term stability.
Innovations in materials and circuit design are enabling these instruments to offer enhanced accuracy, better thermal stability, and lower energy usage. Additionally, global trends such as energy efficiency, environmental compliance, and the shift toward RoHS-compliant and lead-free components are reinforcing the importance of LCR testing across multiple industries.
| Market Scope | |
|---|---|
| Start Year | 2024 |
| Forecast Year | 2025-2034 |
| Start Value | $1.52 Billion |
| Forecast Value | $2.1 Billion |
| CAGR | 3.3% |
As smart manufacturing, e-commerce logistics, and automotive electronics evolve, manufacturers increasingly depend on advanced LCR solutions for quality control, system validation, and component matching in increasingly miniaturized designs and energy-optimized configurations. The shift toward automation, connectivity, and real-time data monitoring in production environments demands highly accurate testing equipment that can seamlessly integrate into digital quality assurance workflows. LCR meters play a critical role in ensuring the reliability of passive components like inductors, capacitors, and resistors, especially as these parts become smaller and are used in more complex circuit architectures.
The benchtop LCR meters segment generated USD 668.8 million in 2024. Known for their exceptional precision and advanced impedance analysis, benchtop models are a critical component in laboratories and testing facilities across various industries, including telecommunications, automotive, and semiconductors. These devices offer broader frequency ranges and maintain tight measurement tolerances, making them highly suitable for validating performance under diverse testing conditions. Compared to portable models, benchtop LCR meters provide deeper analysis, better data resolution, and faster test cycle times, helping professionals ensure quality assurance in highly complex systems and components.
In 2024, the capacitance testing segment captured significant value in the LCR meters market, reaching USD 429.1 million. Capacitance measurement continues to be a vital function in electronic testing as it directly affects the design and reliability of circuits. With growing use of complex capacitors in miniaturized devices across telecom, consumer electronics, and automotive applications, demand for precision instruments capable of analyzing multilayer ceramic capacitors (MLCCs) has surged. Manufacturers rely on high-accuracy LCR meters to identify deviations and prevent potential failures in components during early design or final production stages. This testing ensures stable electrical behavior, helping meet performance and regulatory benchmarks across various industry verticals.
United States LCR Meters Market was valued at USD 300.66 million in 2024, driven by robust technological infrastructure and leadership across sectors like aerospace, automotive, and electronics. The growing reliance on advanced testing instruments in semiconductor production, EV development, and 5G network expansion has reinforced the demand for LCR meters that offer high frequency, automation, and measurement accuracy. The U.S. also benefits from extensive R&D investments, which are pushing the adoption of next-gen LCR tools in product innovation, system integration, and quality control workflows. As electronic design standards become increasingly stringent, the market is shifting toward smarter, software-integrated LCR meters optimized for advanced material testing and device calibration.
The competitive landscape of the LCR Meters Industry includes a wide range of players, such as IET Labs, Inc., Keysight Technologies, Hioki E.E. Corporation, GW Instek, Chroma ATE Inc., Yokogawa Electric Corporation, B&K Precision Corporation, Extech Instruments, Fluke Corporation, Agilent Technologies, Newton4th Ltd (N4L), Kikusui Electronics Corporation, Preen AC Power Corp., DER EE Electrical Instrument Corp., TECPEL Co., Ltd., Aplab Limited, Applent Instruments Inc., Victor Instruments, Scientific Mes-Technik Pvt. Ltd., and Tonghui Electronics Co., Ltd.
To expand their presence and strengthen market positioning, key companies in the LCR meters industry are focusing on innovation, strategic partnerships, and customer-centric development. Many are investing in R&D to introduce compact, multi-functional meters with automated testing capabilities and enhanced data analysis. Companies are also forming alliances with OEMs, research institutes, and semiconductor manufacturers to offer integrated solutions tailored to specific testing needs.
Table of Contents
Chapter 1 Methodology and Scope
- 1.1 Market scope and definition
- 1.2 Research design
- 1.2.1 Research approach
- 1.2.2 Data collection methods
- 1.3 Data mining sources
- 1.3.1 Global
- 1.3.2 Regional/Country
- 1.4 Base estimates and calculations
- 1.4.1 Base year calculation
- 1.4.2 Key trends for market estimation
- 1.5 Primary research and validation
- 1.5.1 Primary sources
- 1.6 Forecast model
- 1.7 Research assumptions and limitations
Chapter 2 Executive Summary
- 2.1 Industry snapshot
- 2.2 Key market trends
- 2.2.1 Market type trends
- 2.2.2 Material trends
- 2.2.3 Application trends
- 2.2.4 Regional
- 2.3 TAM Analysis, 2025-2034 (USD Million & Units)
- 2.4 CXO perspectives: Strategic imperatives
- 2.4.1 Executive decision points
- 2.4.2 critical success factors
- 2.5 Future outlook and strategic recommendations
Chapter 3 Industry Insights
- 3.1 Industry ecosystem analysis
- 3.1.1 Supplier Landscape
- 3.1.2 Profit Margin
- 3.1.3 Cost structure
- 3.1.4 Value addition at each stage
- 3.1.5 Factor affecting the value chain
- 3.1.6 Disruptions
- 3.2 Industry impact forces
- 3.2.1 Growth drivers
- 3.2.1.1 Rising demand for advanced electronics (EVs, 5G, IoT)
- 3.2.1.2 Advancements in measurement and automation technologies
- 3.2.1.3 Growing focus on product reliability and quality control
- 3.2.1.4 Increasing R&D in semiconductors and aerospace sectors
- 3.2.1.5 Expansion of smart manufacturing and Industry 4.0
- 3.2.2 Industry pitfalls and challenges
- 3.2.2.1 High costs of sustainable materials
- 3.2.2.2 Recycling infrastructure gaps
- 3.2.1 Growth drivers
- 3.3 Growth potential analysis
- 3.4 Regulatory landscape
- 3.4.1 North America
- 3.4.2 Europe
- 3.4.3 Asia Pacific
- 3.4.4 Latin America
- 3.4.5 Middle East & Africa
- 3.5 Porter's analysis
- 3.6 PESTEL analysis
- 3.7 Technology and innovation landscape
- 3.7.1 Current technological trends
- 3.7.2 Emerging technologies
- 3.8 Price trends
- 3.8.1 Historical price analysis (2021-2024)
- 3.8.2 Price trend drivers
- 3.8.3 Regional price variations
- 3.8.4 Price forecast (2025-2034)
- 3.9 Pricing strategies
- 3.10 Emerging business models
- 3.11 Compliance requirements
- 3.12 Sustainability measures
- 3.12.1 Sustainable materials assessment
- 3.12.2 Carbon footprint analysis
- 3.12.3 Circular economy implementation
- 3.12.4 Sustainability certifications and standards
- 3.12.5 Sustainability roi analysis
- 3.13 Global consumer sentiment analysis
- 3.14 Patent analysis
Chapter 4 Competitive Landscape, 2024
- 4.1 Introduction
- 4.2 Company market share analysis
- 4.2.1 By region
- 4.2.1.1 North America
- 4.2.1.2 Europe
- 4.2.1.3 Asia Pacific
- 4.2.1.4 Latin America
- 4.2.1.5 Middle East & Africa
- 4.2.2 Market Concentration Analysis
- 4.2.1 By region
- 4.3 Competitive benchmarking of key players
- 4.3.1 Financial performance comparison
- 4.3.1.1 Revenue
- 4.3.1.2 Profit margin
- 4.3.1.3 R&D
- 4.3.2 Product portfolio comparison
- 4.3.2.1 Product range breadth
- 4.3.2.2 Technology
- 4.3.2.3 Innovation
- 4.3.3 Geographic presence comparison
- 4.3.3.1 Global footprint analysis
- 4.3.3.2 Service network coverage
- 4.3.3.3 Market penetration by region
- 4.3.4 Competitive positioning matrix
- 4.3.4.1 Leaders
- 4.3.4.2 Challengers
- 4.3.4.3 Followers
- 4.3.4.4 Niche players
- 4.3.5 Strategic outlook matrix
- 4.3.1 Financial performance comparison
- 4.4 Key developments, 2021-2024
- 4.4.1 Mergers and acquisitions
- 4.4.2 Partnerships and collaborations
- 4.4.3 Technological advancements
- 4.4.4 Expansion and investment strategies
- 4.4.5 Sustainability initiatives
- 4.4.6 Digital transformation initiatives
- 4.5 Emerging/ startup competitors landscape
Chapter 5 Market Estimates and Forecast, By Type, 2021 - 2034 (USD Million & Units)
- 5.1 Key trends
- 5.2 Handheld LCR Meters
- 5.3 Benchtop LCR Meters
- 5.4 Portable LCR Meters
- 5.5 Modular/Automatic LCR Meters
Chapter 6 Market Estimates and Forecast, By Measurement Parameters, 2021 - 2034 (USD Million & Units)
- 6.1 Key trends
- 6.2 L (Inductance)
- 6.3 C (Capacitance)
- 6.4 R (Resistance)
- 6.5 Q (Quality Factor)
- 6.6 D (Dissipation Factor)
- 6.7 Impedance
- 6.8 Phase Angle
- 6.9 Admittance (Y), Conductance (G), Susceptance (B)
Chapter 7 Market Estimates and Forecast, By Frequency Range Type, 2021 - 2034 (USD Million & Units)
- 7.1 Key trends
- 7.2 Low Frequency (< 1 kHz)
- 7.3 Mid Frequency (1 kHz - 1 MHz)
- 7.4 High Frequency (> 1 MHz)
Chapter 8 Market Estimates and Forecast, By End Use Industry, 2021 - 2034 (USD Million & Units)
- 8.1 Key trends
- 8.2 Manufacturing
- 8.3 Automotive
- 8.4 Healthcare
- 8.5 Semiconductors & electronics
- 8.6 Aerospace & defense
- 8.7 Academic & research institutions
- 8.8 Utilities
- 8.9 Others (e.g., renewable energy, iot device manufacturers)
Chapter 9 Market Estimates and Forecast, By Region, 2021 - 2034 (USD Million & Units)
- 9.1 Key trends
- 9.2 North America
- 9.2.1 U.S.
- 9.2.2 Canada
- 9.3 Europe
- 9.3.1 Germany
- 9.3.2 UK
- 9.3.3 France
- 9.3.4 Spain
- 9.3.5 Italy
- 9.3.6 Netherlands
- 9.4 Asia Pacific
- 9.4.1 China
- 9.4.2 India
- 9.4.3 Japan
- 9.4.4 Australia
- 9.4.5 South Korea
- 9.5 Latin America
- 9.5.1 Brazil
- 9.5.2 Mexico
- 9.5.3 Argentina
- 9.6 Middle East and Africa
- 9.6.1 Saudi Arabia
- 9.6.2 South Africa
- 9.6.3 UAE
Chapter 10 Company Profiles
- 10.1 Keysight Technologies
- 10.2 Hioki E.E. Corporation
- 10.3 Chroma ATE Inc.
- 10.4 IET Labs, Inc.
- 10.5 GW Instek (Good Will Instrument Co., Ltd.)
- 10.6 B&K Precision Corporation
- 10.7 Yokogawa Electric Corporation
- 10.8 Fluke Corporation
- 10.9 Agilent Technologies
- 10.10 Extech Instruments
- 10.11 Scientific Mes-Technik Pvt. Ltd.
- 10.12 Newton4th Ltd (N4L)
- 10.13 Kikusui Electronics Corporation
- 10.14 Preen AC Power Corp.
- 10.15 Applent Instruments Inc.
- 10.16 DER EE Electrical Instrument Corp.
- 10.17 TECPEL Co., Ltd.
- 10.18 Victor Instruments (Shenzhen Victor Hi-Tech Co. Ltd.)
- 10.19 Tonghui Electronics Co., Ltd.
- 10.20 Aplab Limited
