|
시장보고서
상품코드
1801883
해수 양식 시장 기회, 성장 촉진요인, 산업 동향 분석 및 예측(2025-2034년)Saltwater Aquaculture Market Opportunity, Growth Drivers, Industry Trend Analysis, and Forecast 2025 - 2034 |
||||||
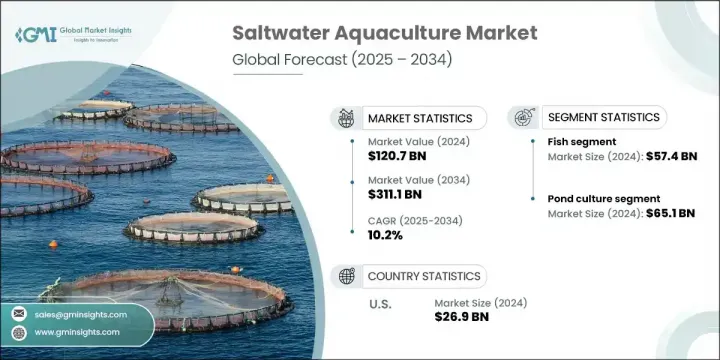
세계의 해수 양식 시장은 2024년에는 1,207억 달러로 평가되었고, CAGR10.2%로 성장하여 2034년에는 3,111억 달러에 이를 것으로 추정되고 있습니다.
이러한 성장은 지속 가능한 해양 식량 시스템을 촉진하기 위한 정부의 강력한 지원과 진보적인 정책 조정에 의해 촉진되고 있습니다. 각국은 광범위한 식량 안보 및 기후 적응 전략의 일환으로 해양 양식을 우선순위에 두고 있으며, 미래 대응 가능한 식량 생산의 중요한 축으로 자리매김하고 있습니다. 해상 가두리 양식, 재순환식 양식 시스템(RAS), 종합다영양식 양식(IMTA) 등 기술 전반에 걸친 지속적인 기술 혁신이 시장의 역량을 확대해왔습니다. 이러한 시스템은 수율을 높이고, 환경에 미치는 영향을 최소화하며, 과거에는 해양 양식에 적합하지 않다고 여겨졌던 지역에 대한 접근을 가능하게 합니다.

연방 정부 기관의 지원으로 생산자들은 현재 대체 사료, 부화장 개발, 부화장 개발, 개선된 지역 계획에 중점을 둔 연구를 통해 혜택을 누리고 있습니다. 이러한 발전으로 기존 양식업은 정밀한 양식 모델로 변모하고 있으며, 확장 가능하고 지속 가능한 생산이 가능해졌습니다. 그러나 이러한 발전에도 불구하고 양식업자들은 환경 보호 및 구역 설정과 관련된 복잡한 규제 문제에 직면해 있습니다. 이러한 연방, 주, 지방의 규제는 생태계를 보호하는 데 필수적인 반면, 특히 신규 시장 진출기업에게는 인허가 기간이 길어지고 운영비용이 상승하는 경우가 많습니다.
| 시장 범위 | |
|---|---|
| 개시 연도 | 2024년 |
| 예측 연도 | 2025-2034년 |
| 개시 금액 | 1,207억 달러 |
| 예측 금액 | 3,111억 달러 |
| CAGR | 10.2% |
2024년 어류 부문의 매출은 574억 달러로 2034년까지 9.7%의 연평균 복합 성장률(CAGR)을 보일 것으로 예측됩니다. 농어, 참치, 연어 등의 어종은 높은 영양가, 요리에의 적응성, 광범위한 가용성 등으로 인해 소비자 시장을 계속 독점하고 있습니다. 연체동물이나 갑각류에 비해 많은 어종들은 사료 요구율이 높아 생산비 절감과 양식업자의 수익 극대화가 가능합니다. 업계 전문가들은 양식업의 우위는 질병 관리, 부화장 효율화, 해상 가두리 시스템 등 기술적 개선을 통한 탄탄한 기반에 기인한다고 말합니다. 수산물, 특히 틸라피아와 연어는 효율적인 콜드체인과 널리 받아들여진 인증 프로토콜 덕분에 세계에서 가장 많이 거래되는 양식 상품 중 하나로 자리 잡았습니다.
연못 양식 부문은 2024년 651억 달러로 54%의 점유율을 기록하며 해수 양식 생산 방식 중 1위로 부상했습니다. 해상 케이지나 RAS와 같은 하이테크 시스템에 비해 자본 투자가 적기 때문에 신흥 경제국이나 중소규모의 생산자 사이에서 선호되는 방식입니다. 연못을 설치하면 수질 관리와 먹이주기 일정을 더 간단하게 할 수 있어 첨단 양식 기술을 사용할 수 없는 지역에서 더 실용적입니다. 정부에서 지원하는 양식업은 확장성, 비용 효율성, 지느러미 어류, 연체동물, 갑각류 등 다양한 어종을 양식할 수 있는 능력으로 인해 연못 시스템을 선호하는 경우가 많습니다. 이러한 적응성을 통해 생산자는 환경의 변화와 시장 수요의 변화에 대응할 수 있습니다.
미국 해수양식 2024년 시장 규모는 269억 달러로 2034년까지 연평균 9.2% 성장할 것으로 예측됩니다. 미국 시장의 성장은 정부 지원 연구, 지속 가능한 양식 수산물에 대한 소비자 수요 증가, 양식 기술의 꾸준한 기술 혁신의 조합에 의해 주도되고 있습니다. 시장은 또한 해조류, 조개류, 농어 등의 종으로 확대되고 있으며, 보다 효율적인 사료 시스템과 질병 관리 도구의 지원을 받고 있습니다. 앞으로 미국은 해양 생산, 육상 재순환 시스템, 고급 부가가치 수산물 개발에 더욱 집중할 것으로 예측됩니다.
세계 해수 양식 시장의 주요 기업으로는 Marine Harvest ASA(Mowi),Yalelo Zambia,Cooke Aquaculture Inc,Cermaq Group AS,Grieg Seafood ASA,P/F Bakkafrost,PHARMAQ( Zoetis), Leroy Seafood Group ASA, SalMar ASA, Huon Aquaculture Group Ltd. 해수양식 시장의 업계 선두주자들은 세계 시장에서의 입지를 굳히기 위해 다각적인 전략을 채택하고 있습니다. 각 업체들은 AI를 활용한 모니터링, RAS, 해양양식 등 차세대 양식기술에 우선적으로 투자하여 생산량 향상과 생태계에 미치는 영향을 줄이기 위해 노력하고 있습니다. 또한, 새로운 소비자층을 개척하고 공급망 관리를 강화하기 위해 전략적 인수와 지역 확장을 추진하고 있습니다. 기업들은 부화장에서부터 수확, 소매에 이르기까지 수직적으로 통합된 사업을 통해 가치 제안을 강화하고 있으며, 이를 통해 품질 보증과 비용 관리를 향상시키고 있습니다.
목차
제1장 조사 방법과 범위
제2장 주요 요약
제3장 산업 인사이트
- 생태계 분석
- 공급업체 상황
- 이익률
- 각 단계에서의 부가가치
- 밸류체인에 영향을 미치는 요인
- 파괴적 변화
- 산업에 대한 영향요인
- 성장 촉진요인
- 산업 잠재적 리스크와 과제
- 기회
- 성장 가능성 분석
- 향후 시장 동향
- 기술과 혁신 상황
- 현재 기술 동향
- 신기술
- 가격 동향
- 지역별·제품 유형
- 규제 프레임워크
- 규격과 인증
- 환경 규제
- 수출입 규제
- Porter의 Five Forces 분석
- PESTEL 분석
- 소비자 행동 분석
- 구입 패턴
- 선호도 분석
- 소비자 행동 지역차이
- E-Commerce가 구매 결정에 미치는 영향
제4장 경쟁 구도
- 서론
- 기업의 시장 점유율 분석
- 지역별
- 기업 매트릭스 분석
- 주요 시장 기업의 경쟁 분석
- 경쟁 포지셔닝 매트릭스
- 인수합병(M&A)
- 파트너십 및 협업
- 신제품 발매
- 확대 계획
제5장 시장 추정·예측 : 양식 유형별, 2021-2034년
- 주요 동향
- 어류
- 갑각류
- 연체동물
- 해조
- 수생식물
- 기타(개구리, 뱀장어, 기타)
제6장 시장 추정·예측 : 양식 시스템별, 2021-2034년
- 주요 동향
- 펜 양식
- 연못 양식
- 부유식 케이지 양식
- 순환형 양식 시스템(RAS)
- 통합 다영양 단계 양식(IMTA)
- 기타
제7장 시장 추정·예측 : 환경별, 2021-2034년
- 주요 동향
- 해수
- 기수
- 혼합수 시스템
제8장 시장 추정·예측 : 최종 용도별, 2021-2034년
- 주요 동향
- 푸드서비스
- 소매
- 의약품 및 식이보충제
- 화장품 및 퍼스널케어
- 기타
제9장 시장 추정·예측 : 유통 채널별, 2021-2034년
- 주요 동향
- 직접 판매
- 간접 판매
제10장 시장 추정·예측 : 지역별, 2021-2034년
- 주요 동향
- 북미
- 미국
- 캐나다
- 유럽
- 독일
- 영국
- 프랑스
- 이탈리아
- 스페인
- 네덜란드
- 아시아태평양
- 중국
- 인도
- 일본
- 한국
- 호주
- 라틴아메리카
- 브라질
- 멕시코
- 아르헨티나
- 중동 및 아프리카
- 아랍에미리트(UAE)
- 사우디아라비아
- 남아프리카공화국
제11장 기업 개요
- Aller Aqua
- Cermaq Group AS
- Cooke Aquaculture Inc.
- GeneSeas Aquacultura Ltda.
- Grieg Seafood ASA
- Huon Aquaculture Group Ltd.
- Innovasea
- Leroy Seafood Group ASA
- Marine Harvest ASA(Mowi)
- Nippon Suisan Kaisha, Ltd.
- Nueva Pescanova
- P/F Bakkafrost
- PHARMAQ(Zoetis)
- SalMar ASA
- Yalelo Zambia
The Global Saltwater Aquaculture Market was valued at USD 120.7 billion in 2024 and is estimated to grow at a CAGR of 10.2% to reach USD 311.1 billion by 2034. This growth is being fueled by strong government support and progressive policy alignment aimed at boosting sustainable marine food systems. Countries are prioritizing marine aquaculture as part of broader food security and climate adaptation strategies, helping to establish it as a critical pillar in future-ready food production. Continued innovation across technologies such as offshore cage farming, recirculating aquaculture systems (RAS), and integrated multi-trophic aquaculture (IMTA) has expanded the market's capabilities. These systems are increasing yields, minimizing environmental footprint, and unlocking access to areas once deemed unsuitable for marine farming.
With the support of federal agencies, producers now benefit from research focused on feed alternatives, hatchery development, and improved zone planning. These advances are transforming traditional operations into precision aquaculture models, allowing for scalable yet sustainable production. However, despite the progress, aquaculture operators still contend with complex regulatory challenges tied to environmental protection and zoning. These layers of federal, state, and local regulation-while critical to preserving ecosystems-often extend permitting timelines and raise operational costs, especially for new entrants.
| Market Scope | |
|---|---|
| Start Year | 2024 |
| Forecast Year | 2025-2034 |
| Start Value | $120.7 Billion |
| Forecast Value | $311.1 Billion |
| CAGR | 10.2% |
In 2024, the fish segment generated USD 57.4 billion and is forecasted to grow at a CAGR of 9.7% through 2034. Species such as sea bass, tuna, and salmon continue to dominate consumer markets thanks to their nutritional value, culinary adaptability, and widespread availability. Compared to mollusks and crustaceans, many fish species offer better feed conversion ratios, reducing production costs and maximizing returns for farmers. Industry experts have attributed fish farming's dominance to a strong foundation of technological improvements in disease control, hatchery efficiency, and offshore cage systems. Fish products, particularly tilapia and salmon, have also gained global traction due to efficient cold chains and widely accepted certification protocols, making them among the top-traded aquaculture goods worldwide.
The pond culture segment generated USD 65.1 billion and a 54% share in 2024, emerged as the top method for saltwater aquaculture production. The lower capital investment compared to high-tech systems such as offshore cages or RAS makes it a preferred approach in emerging economies and among small-to-medium-scale producers. Pond setups allow for simpler water quality control and feeding schedules, making them more practical in areas lacking access to advanced aquaculture technologies. Government-supported aquaculture initiatives often favor pond systems for their scalability, cost-effectiveness, and ability to support diverse species including finfish, mollusks, and crustaceans. This adaptability allows producers to react to both environmental changes and shifting market demands.
United States Saltwater Aquaculture Market was valued at USD 26.9 billion in 2024 and is anticipated to grow at a CAGR of 9.2% through 2034. Growth in the US market is being driven by a combination of government-funded research, increasing consumer demand for sustainably farmed seafood, and steady innovation in aquaculture technologies. The market is also benefiting from expansion into species like seaweed, shellfish, and sea bass, supported by more efficient feed systems and disease management tools. Looking ahead, the US is expected to lean further into offshore production, land-based recirculating systems, and development of premium value-added seafood products.
Leading companies in the Global Saltwater Aquaculture Market include Marine Harvest ASA (Mowi), Yalelo Zambia, Cooke Aquaculture Inc., Nippon Suisan Kaisha, Ltd., Cermaq Group AS, Grieg Seafood ASA, P/F Bakkafrost, PHARMAQ (Zoetis), Leroy Seafood Group ASA, SalMar ASA, Huon Aquaculture Group Ltd., GeneSeas Aquacultura Ltda., Innovasea, Nueva Pescanova, and Aller Aqua. Industry leaders in the saltwater aquaculture market are adopting multi-pronged strategies to solidify their global footprint. Companies are prioritizing investment in next-generation aquaculture technologies like AI-powered monitoring, RAS, and offshore farming to boost yield and reduce ecological impact. Strategic acquisitions and regional expansions are also underway to tap into new consumer bases and strengthen supply chain control. Firms are enhancing value propositions through vertically integrated operations-from hatchery to harvest to retail-which allows for improved quality assurance and cost management.
Table of Contents
Chapter 1 Methodology & Scope
- 1.1 Market scope and definition
- 1.2 Research design
- 1.2.1 Research approach
- 1.2.2 Data collection methods
- 1.3 Data mining sources
- 1.3.1 Global
- 1.3.2 Regional/Country
- 1.4 Base estimates and calculations
- 1.4.1 Base year calculation
- 1.4.2 Key trends for market estimation
- 1.5 Primary research and validation
- 1.5.1 Primary sources
- 1.6 Forecast model
- 1.7 Research assumptions and limitations
Chapter 2 Executive Summary
- 2.1 Industry 3600 synopsis
- 2.2 Key market trends
- 2.2.1 Species cultured
- 2.2.2 Culture systems
- 2.2.3 Environment
- 2.2.4 End use
- 2.2.5 Distribution channel
- 2.2.6 Regional
- 2.3 CXO perspective: Strategic imperatives
- 2.3.1 Key decision points for industry executives
- 2.3.2 Critical success factors for market players
- 2.4 Future outlook and strategic recommendations
Chapter 3 Industry Insights
- 3.1 Industry ecosystem analysis
- 3.1.1 Supplier landscape
- 3.1.2 Profit margin
- 3.1.3 Value addition at each stage
- 3.1.4 Factor affecting the value chain
- 3.1.5 Disruptions
- 3.2 Industry Impact forces
- 3.2.1 Growth drivers
- 3.2.2 Industry pitfalls & challenges
- 3.2.3 Opportunities
- 3.3 Growth potential analysis
- 3.4 Future market trends
- 3.5 Technology and innovation landscape
- 3.5.1 Current technological trends
- 3.5.2 Emerging technologies
- 3.6 Price trends
- 3.6.1 By region and product type
- 3.7 Regulatory framework
- 3.7.1 Standards and certifications
- 3.7.2 Environmental regulations
- 3.7.3 Import export regulations
- 3.8 Porter’s analysis
- 3.9 PESTEL analysis
- 3.10 Consumer behavior analysis
- 3.10.1 Purchasing patterns
- 3.10.2 Preference analysis
- 3.10.3 Regional variations in consumer behavior
- 3.10.4 Impact of e-commerce on buying decisions
Chapter 4 Competitive Landscape, 2024
- 4.1 Introduction
- 4.2 Company market share analysis
- 4.2.1 By region
- 4.2.1.1 North America
- 4.2.1.2 Europe
- 4.2.1.3 Asia Pacific
- 4.2.1.4 Latin America
- 4.2.1.5 Middle East and Africa
- 4.2.1 By region
- 4.3 Company matrix analysis
- 4.4 Competitive analysis of major market players
- 4.5 Competitive positioning matrix
- 4.6 Key developments
- 4.6.1 Mergers & acquisitions
- 4.6.2 Partnerships & collaborations
- 4.6.3 New Product Launches
- 4.6.4 Expansion Plans
Chapter 5 Market Estimates & Forecast, By Species Cultured, 2021 - 2034 (USD Billion) (Million Tons)
- 5.1 Key trends
- 5.2 Fish
- 5.3 Crustaceans
- 5.4 Mollusks
- 5.5 Seaweed
- 5.6 Aquatic plants
- 5.7 Others (Frogs, Eels, etc.)
Chapter 6 Market Estimates & Forecast, By Culture Systems, 2021 - 2034 (USD Billion) (Million Tons)
- 6.1 Key trends
- 6.2 Pen culture
- 6.3 Pond culture
- 6.4 Floating cage culture
- 6.5 Recirculating aquaculture systems (RAS)
- 6.6 Integrated multi-trophic aquaculture (IMTA)
- 6.7 Others
Chapter 7 Market Estimates & Forecast, By Environment, 2021 - 2034 (USD Billion) (Million Tons)
- 7.1 Key trends
- 7.2 Marine water
- 7.3 Brackish water
- 7.4 Mixed water systems
Chapter 8 Market Estimates & Forecast, By End Use, 2021 - 2034, (USD Billion) (Million Tons)
- 8.1 Key trends
- 8.2 Food Services
- 8.3 Retail
- 8.4 Pharmaceutical and nutraceuticals
- 8.5 Cosmetics and personal care
- 8.6 Others
Chapter 9 Market Estimates & Forecast, By Distribution Channel, 2021 - 2034, (USD Billion) (Million Tons)
- 9.1 Key trends
- 9.2 Direct sales
- 9.3 Indirect sales
Chapter 10 Market Estimates & Forecast, By Region, 2021 - 2034, (USD Billion) (Million Tons)
- 10.1 Key trends
- 10.2 North America
- 10.2.1 U.S.
- 10.2.2 Canada
- 10.3 Europe
- 10.3.1 Germany
- 10.3.2 U.K.
- 10.3.3 France
- 10.3.4 Italy
- 10.3.5 Spain
- 10.3.6 Netherlands
- 10.4 Asia Pacific
- 10.4.1 China
- 10.4.2 India
- 10.4.3 Japan
- 10.4.4 South Korea
- 10.4.5 Australia
- 10.5 Latin America
- 10.5.1 Brazil
- 10.5.2 Mexico
- 10.5.3 Argentina
- 10.6 MEA
- 10.6.1 UAE
- 10.6.2 Saudi Arabia
- 10.6.3 South Africa
Chapter 11 Company Profiles (Business Overview, Financial Data, Product Landscape, Strategic Outlook, SWOT Analysis)
- 11.1 Aller Aqua
- 11.2 Cermaq Group AS
- 11.3 Cooke Aquaculture Inc.
- 11.4 GeneSeas Aquacultura Ltda.
- 11.5 Grieg Seafood ASA
- 11.6 Huon Aquaculture Group Ltd.
- 11.7 Innovasea
- 11.8 Leroy Seafood Group ASA
- 11.9 Marine Harvest ASA (Mowi)
- 11.10 Nippon Suisan Kaisha, Ltd.
- 11.11 Nueva Pescanova
- 11.12 P/F Bakkafrost
- 11.13 PHARMAQ (Zoetis)
- 11.14 SalMar ASA
- 11.15 Yalelo Zambia