


|
시장보고서
상품코드
1871204
생분해성 식품 센서 시장 : 기회, 성장 요인, 업계 동향 분석 및 예측(2025-2034년)Biodegradable Food Sensors Market Opportunity, Growth Drivers, Industry Trend Analysis, and Forecast 2025 - 2034 |
||||||
세계의 생분해성 식품 센서 시장은 2024년 2억 2,810만 달러로 평가되었으며, 2034년까지 연평균 복합 성장률(CAGR) 17.8%로 성장하여 약 12억 달러에 이를 것으로 예측됩니다.
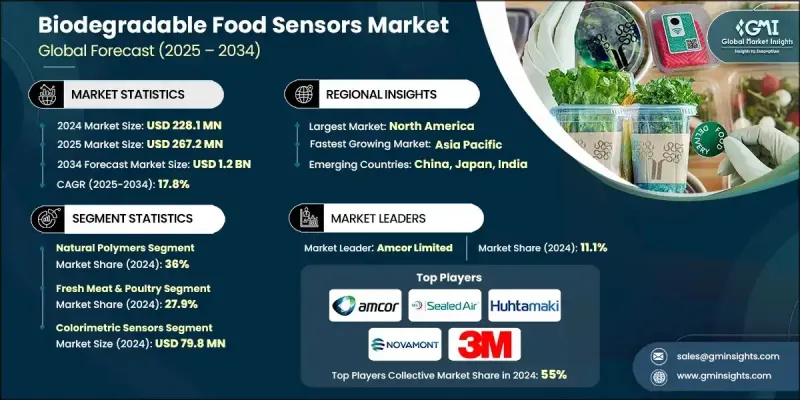
식품 유래 질병에 대한 소비자의 의식의 고조와 품질 열화에 대한 우려가 첨단 실시간 신선도 감시 시스템의 이용을 가속화하고 있습니다. 이러한 생분해성 센서는 암모니아, 황화수소, 휘발성 아민 등 부패와 관련된 휘발성 화합물의 지속적인 검출을 가능하게 합니다. 보다 안전한 식품제품에 대한 수요 증가가 특히 고기나 해산물 등의 고위험 분야에 있어서, 복수의 카테고리에서의 채용을 추진하고 있습니다. 또한 플라스틱 폐기물 감축과 기후 변화 완화를 위한 세계적인 노력이 생분해성 포장재로의 이행을 촉진하여 시장에 몰입하고 있습니다. 규제 강화와 지속가능성 목표가 높아짐에 따라 식품안전성 확보를 강화하는 친환경 센서 기술 투자가 기업에 촉구되고 있습니다. 특히 엄격한 지속가능성 정책이 도입된 유럽과 북미에서는 환경 의식 증가가 주요 성장 요인이 되고 있습니다. 미국 식품의약국(FDA)의 지침과 유럽연합(EU)의 스마트 포장에 관한 노력 등 정부의 지원적인 규제가 생분해성 센서 용도에 있어서 시장 확대와 기술 혁신에 유리한 환경을 마련하고 있습니다.
| 시장 범위 | |
|---|---|
| 시작 연도 | 2024년 |
| 예측 연도 | 2025-2034년 |
| 시작 금액 | 2억 2,810만 달러 |
| 예측 금액 | 12억 달러 |
| CAGR | 17.8% |
천연 폴리머 기반 재료 부문은 2024년 36%의 점유율을 차지했습니다. 이 카테고리에는 키토산, 셀룰로오스, 전분, 알긴산염 등의 생분해성 기재가 포함되어 있으며, 모두 우수한 생체적합성과 환경 안전성이 알려져 있습니다. 셀룰로오스 기반 센서는 뛰어난 기계적 강도, 가공 유연성, 재생가능한 자원으로부터 용이한 가용성으로 이 부문을 지배합니다. 높은 성능을 발휘하는 지속 가능한 천연 유래 소재로의 전환이 진행되고 있는 것이, 이 카테고리에서의 급속한 성장을 지지하는 주요 요인입니다.
수산물 및 양식 분야는 2024년 23.2%의 점유율을 차지해 5,290만 달러에 달했습니다. 이 시스템은 황화수소와 암모니아와 같은 부패 가스를 감지하고 해산물의 신선도를 모니터링하는 데 널리 사용됩니다. 여러 지역에서는 센서 성능 교정 기준이 현지 식품 안전 규정을 준수하고 부패 임계값의 정확한 감지와 소비자 보호 개선을 실현하고 있습니다.
미국의 생분해성 식품 센서 시장은 2024년에 6,480만 달러의 규모를 기록했으며, 2034년까지 3억 4,870만 달러에 이를 것으로 예측됩니다. 이 지역의 성장은 강력한 연구 인프라, 지속 가능한 기술에 대한 정부 자금 지원, 클린 테크 혁신에 대한 적극적인 투자에 의해 지원됩니다. 북미는 강력한 학술 연계, 벤처 캐피탈 지원, 지속가능성 정책의 추진에 의해 고성능 생분해성 센서 기술에 있어서의 혁신의 거점으로 계속되고 있습니다.
세계의 생분해성 식품센서 시장을 견인하는 주요 기업으로는 Sealed Air Corporation, BASF SE, Vericool, FreshSurety, Amcor Limited, Transparent Path, NatureWorks LLC, Huhtamaki Oyj, Total Corbion PLA, 3M Company, Novamont S.p.A., BT9 등이 있습니다. 생분해성 식품 센서 시장의 주요 기업은 세계 존재감을 강화하기 위해 여러 전략을 채택하고 있습니다. 각 회사는 지속가능성의 요구에 따라 고성능, 완전 생분해성 센서 재료를 설계하기 위해 연구 개발에 많은 투자를 실시했습니다. 제품 혁신과 시장 침투를 가속화하기 위해 포장 제조업체, 연구 기관, 식품 생산자와의 전략적 제휴 및 파트너십을 추진 중입니다. 또한 많은 기업들이 합병, 인수, 합작사업을 통해 지리적 범위를 확대하여 신흥 시장 진출을 도모하고 있습니다. 또한 소비자 신뢰를 구축하기 위해 규제 준수와 에코 인증 취득에 중점을 두고 있습니다.
자주 묻는 질문
목차
제1장 조사 방법과 범위
제2장 주요 요약
제3장 업계 인사이트
- 생태계 분석
- 공급자의 상황
- 이익률
- 각 단계에서의 부가가치
- 밸류체인에 영향을 주는 요인
- 혁신
- 업계에 미치는 영향요인
- 성장 촉진요인
- 업계의 잠재적 위험 및 과제
- 시장 기회
- 성장 가능성 분석
- 규제 상황
- 북미
- 유럽
- 아시아태평양
- 라틴아메리카
- 중동 및 아프리카
- Porter's Five Forces 분석
- PESTEL 분석
- 가격 동향
- 지역별
- 장래 시장 동향
- 기술과 혁신의 상황
- 현재의 기술 동향
- 신흥기술
- 특허 상황
- 무역 통계(HS코드)(참고: 무역 통계는 주요 국가에서만 제공됨)
- 주요 수입국
- 주요 수출국
- 지속가능성과 환경면
- 지속가능한 대처
- 폐기물 감축 전략
- 생산에 있어서의 에너지 효율
- 환경에 배려한 대처
- 탄소발자국에 관한 고려 사항
제4장 경쟁 구도
- 소개
- 기업의 시장 점유율 분석
- 지역별
- 북미
- 유럽
- 아시아태평양
- 라틴아메리카
- 중동 및 아프리카
- 지역별
- 기업 매트릭스 분석
- 주요 시장 기업의 경쟁 분석
- 경쟁 포지셔닝 매트릭스
- 주요 발전
- 인수합병
- 제휴 및 협업
- 신제품 발매
- 확대 계획
제5장 시장 규모와 예측 : 소재 베이스별, 2021-2034년
- 주요 동향
- 천연 고분자
- 키토산계 센서
- 알긴산염계
- 셀룰로오스 및 유도체
- 전분계 재료
- 바이오 베이스 플라스틱
- PLA(폴리유산) 시스템
- PHA(폴리하이드록시알카노에이트)
- PCL(폴리카프로락톤)
- 바이오폴리에틸렌
- 단백질계 재료
- 젤라틴계 센서
- 콜라겐계 재료
- 콩 단백질
- 유청 단백질
- 복합재료
- 천연섬유 강화
- 나노셀룰로오스 강화
제6장 시장 규모와 예측 : 용도별, 2021-2034년
- 주요 동향
- 생고기 및 닭고기
- 부패 검출 시스템
- 병원균 모니터링
- 온도 이상 검출기
- 수산물 및 양식업
- 신선도 지표
- 세균 증식 모니터링
- 콜드체인 응용
- 신선식품
- 숙도 모니터링
- 에틸렌 검출
- 수분 관리
- 유제품
- pH 모니터링 시스템
- 세균 오염 검출
- 보존 기간 연장
- 가공식품
- 포장 무결성 모니터링
- 유통기한 표시기
제7장 시장 규모와 예측 : 센서 기술 유형별, 2021-2034년
- 주요 동향
- 비색 센서
- 전기화학 센서
- 광학 센서
- 가스 센서
- 바이오센서
- 기타
제8장 시장 규모와 예측 : 지역별, 2021-2034년
- 주요 동향
- 북미
- 미국
- 캐나다
- 유럽
- 영국
- 독일
- 프랑스
- 이탈리아
- 스페인
- 기타 유럽
- 아시아태평양
- 중국
- 인도
- 일본
- 한국
- 호주
- 기타 아시아태평양
- 라틴아메리카
- 브라질
- 멕시코
- 아르헨티나
- 기타 라틴아메리카
- 중동 및 아프리카
- 남아프리카
- 사우디아라비아
- 아랍에미리트(UAE)
- 기타 중동 및 아프리카
제9장 기업 프로파일
- Amcor Limited
- Sealed Air Corporation
- Huhtamaki
- 3M Company
- NatureWorks
- Novamont
- Total Corbion
- BASF
- Transparent Path
- Vericool
- FreshSurety
- BT9
The Global Biodegradable Food Sensors Market was valued at USD 228.1 million in 2024 and is estimated to grow at a CAGR of 17.8% to reach around USD 1.2 Billion by 2034.

Growing consumer awareness of foodborne illnesses and concerns about quality degradation are accelerating the use of advanced real-time freshness monitoring systems. These biodegradable sensors enable continuous detection of volatile compounds linked with spoilage, such as ammonia, hydrogen sulfide, and volatile amines. Rising demand for safer food products is propelling adoption across multiple categories, particularly in high-risk areas like meat and seafood. The market also benefits from global efforts to curb plastic waste and mitigate climate change, encouraging the transition to biodegradable packaging alternatives. Heightened regulatory pressures and sustainability goals are motivating companies to invest in eco-friendly sensor technologies that enhance food safety assurance. Environmental awareness continues to be a major growth driver, particularly across Europe and North America, where stringent sustainability policies are increasingly being implemented. Supportive government regulations, including guidance from the FDA and the European Union's initiatives on smart packaging, are creating favorable conditions for market expansion and technological innovation in biodegradable sensor applications.
| Market Scope | |
|---|---|
| Start Year | 2024 |
| Forecast Year | 2025-2034 |
| Start Value | $228.1 Million |
| Forecast Value | $1.2 Billion |
| CAGR | 17.8% |
The natural polymer-based materials segment held a 36% share in 2024. This category includes biodegradable substrates such as chitosan, cellulose, starch, and alginate, all known for their excellent biocompatibility and environmental safety. Cellulose-based sensors dominate this segment due to their superior mechanical strength, flexibility in processing, and easy availability from renewable resources. The increasing shift toward sustainable, naturally sourced materials that deliver strong performance is a key factor supporting rapid growth within this category.
The seafood and aquaculture segment held a 23.2% share and reached USD 52.9 million in 2024. These systems are widely used to monitor fish freshness by detecting spoilage gases like hydrogen sulfide and ammonia. In several regions, calibration targets for sensor performance are aligned with local food safety regulations, ensuring accurate detection of spoilage thresholds and improving consumer protection.
United States Biodegradable Food Sensors Market generated USD 64.8 million in 2024 and is projected to reach USD 348.7 million by 2034. The region's growth is supported by strong research infrastructure, government funding for sustainable technologies, and active investment in cleantech innovation. North America continues to be a hub for breakthroughs in high-performance biodegradable sensor technologies, driven by strong academic collaboration, venture capital support, and favorable sustainability policies.
Prominent companies shaping the Global Biodegradable Food Sensors Market include Sealed Air Corporation, BASF SE, Vericool, FreshSurety, Amcor Limited, Transparent Path, NatureWorks LLC, Huhtamaki Oyj, Total Corbion PLA, 3M Company, Novamont S.p.A., and BT9. Leading players in the Biodegradable Food Sensors Market are adopting multiple strategies to strengthen their global presence. Companies are investing heavily in research and development to design high-performance, fully biodegradable sensor materials that align with sustainability mandates. Strategic collaborations and partnerships with packaging manufacturers, research institutions, and food producers are being pursued to accelerate product innovation and market penetration. Many firms are also expanding their geographic reach through mergers, acquisitions, and joint ventures to tap into emerging markets. Furthermore, organizations are emphasizing regulatory compliance and eco-certifications to build consumer trust.
Table of Contents
Chapter 1 Methodology & Scope
- 1.1 Market scope and definition
- 1.2 Research design
- 1.2.1 Research approach
- 1.2.2 Data collection methods
- 1.3 Data mining sources
- 1.3.1 Global
- 1.3.2 Regional/Country
- 1.4 Base estimates and calculations
- 1.4.1 Base year calculation
- 1.4.2 Key trends for market estimation
- 1.5 Primary research and validation
- 1.5.1 Primary sources
- 1.6 Forecast model
- 1.7 Research assumptions and limitations
Chapter 2 Executive Summary
- 2.1 Industry 360° synopsis
- 2.2 Key market trends
- 2.2.1 Material base
- 2.2.2 Application
- 2.2.3 Sensor technology type
- 2.3 TAM analysis, 2025-2034
- 2.4 CXO perspectives: Strategic imperatives
- 2.4.1 Executive decision points
- 2.4.2 Critical success factors
- 2.5 Outlook and strategic recommendations
Chapter 3 Industry Insights
- 3.1 Industry ecosystem analysis
- 3.1.1 Supplier landscape
- 3.1.2 Profit margin
- 3.1.3 Value addition at each stage
- 3.1.4 Factor affecting the value chain
- 3.1.5 Disruptions
- 3.2 Industry impact forces
- 3.2.1 Growth drivers
- 3.2.2 Industry pitfalls and challenges
- 3.2.3 Market opportunities
- 3.3 Growth potential analysis
- 3.4 Regulatory landscape
- 3.4.1 North America
- 3.4.2 Europe
- 3.4.3 Asia Pacific
- 3.4.4 Latin America
- 3.4.5 Middle East & Africa
- 3.5 Porter's analysis
- 3.6 PESTEL analysis
- 3.6.1 Technology and innovation landscape
- 3.6.2 Current technological trends
- 3.6.3 Emerging technologies
- 3.7 Price trends
- 3.7.1 By region
- 3.8 Future market trends
- 3.9 Technology and innovation landscape
- 3.9.1 Current technological trends
- 3.9.2 Emerging technologies
- 3.10 Patent landscape
- 3.11 Trade statistics (HS code) (Note: the trade statistics will be provided for key countries only)
- 3.11.1 Major importing countries
- 3.11.2 Major exporting countries
- 3.12 Sustainability and environmental aspects
- 3.12.1 Sustainable practices
- 3.12.2 Waste reduction strategies
- 3.12.3 Energy efficiency in production
- 3.12.4 Eco-friendly initiatives
- 3.13 Carbon footprint considerations
Chapter 4 Competitive Landscape, 2024
- 4.1 Introduction
- 4.2 Company market share analysis
- 4.2.1 By region
- 4.2.1.1 North America
- 4.2.1.2 Europe
- 4.2.1.3 Asia Pacific
- 4.2.1.4 Latin America
- 4.2.1.5 Middle East & Africa
- 4.2.1 By region
- 4.3 Company matrix analysis
- 4.4 Competitive analysis of major market players
- 4.5 Competitive positioning matrix
- 4.6 Key developments
- 4.6.1 Mergers & acquisitions
- 4.6.2 Partnerships & collaborations
- 4.6.3 New product launches
- 4.6.4 Expansion plans
Chapter 5 Market Size and Forecast, By Material Base, 2021-2034 (USD Million) (Kilo Tons)
- 5.1 Key trends
- 5.2 Natural polymers
- 5.2.1 Chitosan-based sensors
- 5.2.2 Alginate systems
- 5.2.3 Cellulose & derivatives
- 5.2.4 Starch-based materials
- 5.3 Bio-based plastics
- 5.3.1 PLA (polylactic acid) systems
- 5.3.2 PHA (polyhydroxyalkanoates)
- 5.3.3 PCL (polycaprolactone)
- 5.3.4 Bio-polyethylene
- 5.4 Protein-based materials
- 5.4.1 Gelatin-based sensors
- 5.4.2 Collagen systems
- 5.4.3 Soy protein
- 5.4.4 Whey protein
- 5.5 Composite materials
- 5.5.1 Natural fiber reinforced
- 5.5.2 Nanocellulose enhanced
Chapter 6 Market Size and Forecast, By Application, 2021-2034 (USD Million) (Kilo Tons)
- 6.1 Key trends
- 6.2 Fresh meat & poultry
- 6.2.1 Spoilage detection systems
- 6.2.2 Pathogen monitoring
- 6.2.3 Temperature abuse indicators
- 6.3 Seafood & aquaculture
- 6.3.1 Freshness indicators
- 6.3.2 Bacterial growth monitoring
- 6.3.3 Cold chain applications
- 6.4 Fresh produce
- 6.4.1 Ripeness monitoring
- 6.4.2 Ethylene detection
- 6.4.3 Moisture management
- 6.5 Dairy products
- 6.5.1 pH monitoring systems
- 6.5.2 Bacterial contamination detection
- 6.5.3 Shelf-life extension
- 6.6 Processed foods
- 6.6.1 Package integrity monitoring
- 6.6.2 Shelf-life indicators
Chapter 7 Market Size and Forecast, By Sensor Technology Type, 2021-2034 (USD Million) (Kilo Tons)
- 7.1 Key trends
- 7.2 Colorimetric sensors
- 7.3 Electrochemical sensors
- 7.4 Optical sensors
- 7.5 Gas sensors
- 7.6 Biosensors
- 7.7 Others
Chapter 8 Market Size and Forecast, By Region, 2021-2034 (USD Million) (Kilo Tons)
- 8.1 Key trends
- 8.2 North America
- 8.2.1 U.S.
- 8.2.2 Canada
- 8.3 Europe
- 8.3.1 UK
- 8.3.2 Germany
- 8.3.3 France
- 8.3.4 Italy
- 8.3.5 Spain
- 8.3.6 Rest of Europe
- 8.4 Asia Pacific
- 8.4.1 China
- 8.4.2 India
- 8.4.3 Japan
- 8.4.4 South Korea
- 8.4.5 Australia
- 8.4.6 Rest of Asia Pacific
- 8.5 Latin America
- 8.5.1 Brazil
- 8.5.2 Mexico
- 8.5.3 Argentina
- 8.5.4 Rest of Latin America
- 8.6 Middle East & Africa
- 8.6.1 South Africa
- 8.6.2 Saudi Arabia
- 8.6.3 UAE
- 8.6.4 Rest of Middle East & Africa
Chapter 9 Company Profiles
- 9.1 Amcor Limited
- 9.2 Sealed Air Corporation
- 9.3 Huhtamaki
- 9.4 3M Company
- 9.5 NatureWorks
- 9.6 Novamont
- 9.7 Total Corbion
- 9.8 BASF
- 9.9 Transparent Path
- 9.10 Vericool
- 9.11 FreshSurety
- 9.12 BT9
