
|
시장보고서
상품코드
1885909
VaaS(Vehicle as a Service) 시장 : 기회, 성장 요인, 업계 동향 분석 및 예측(2025-2034년)Vehicle as a Service Market Opportunity, Growth Drivers, Industry Trend Analysis, and Forecast 2025 - 2034 |
||||||
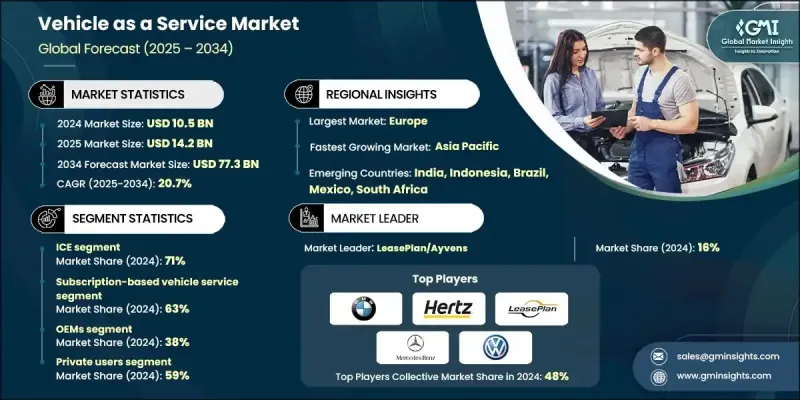
세계의 VaaS(Vehicle as a Service) 시장은 2024년에 105억 달러로 평가되었고, 2034년까지 연평균 복합 성장률(CAGR)은 20.7%를 나타낼 것으로 예측되며 773억 달러로 성장할 전망입니다.

소비자와 기업들은 장기 계약, 보험, 유지 보수, 높은 구매 비용 등 소유에 따르는 부담 없이 차량을 이용할 수 있는 방식을 점점 더 우선시하고 있습니다. 구독 및 사용량 기반 요금제 모델은 유연한 주문형 이동 솔루션을 제공함으로써 이러한 수요를 충족시키고 있습니다. 도시화 확대, 기술 친화적 인구 증가, 디지털 플랫폼 통합 심화는 특히 대도시 지역에서 서비스 채택을 촉진하고 있습니다. 전기차(EV)로의 글로벌 전환은 운영 비용 절감, 환경적 이점, 정부 인센티브 가능성 등을 제공하는 전기차 차량군 덕분에 VaaS 성장을 더욱 가속화하고 있습니다. 기업들은 또한 서비스형 차량(Fleet-as-a-Service) 모델을 활용하여 운영 복잡성을 줄이고 자본 지출을 피하면서, 유지보수, 보험, 차량 관리 업무를 아웃소싱하는 동시에 차량 접근성을 확보하고 있습니다. 도시 모빌리티가 진화함에 따라 VaaS는 비용 효율성, 지속 가능성, 편의성을 위한 전략적 도구로 부상하고 있습니다.
| 시장 범위 | |
|---|---|
| 시작 연도 | 2024년 |
| 예측 연도 | 2025-2034년 |
| 시작 금액 | 105억 달러 |
| 예측 금액 | 773억 달러 |
| CAGR | 20.7% |
구독형 차량 서비스 부문은 2024년에 63%의 점유율을 차지하고 2034년까지 연평균 복합 성장률(CAGR)은 20.2%를 보일 것으로 예측됩니다. 구독 모델은 유연하고 번들링된 약정 없는 차량 이용을 제공하여 소비자와 기업 모두에게 매력적입니다. 사용량 기반 서비스는 수요 알고리즘으로 최적화된 이용당 요금제를 통해 가끔 이용하는 사용자를 대상으로 합니다. 통합 모빌리티 플랫폼은 이제 VaaS(Vehicle as a Service)를 대중교통 및 마이크로모빌리티 솔루션과 결합하여 원활한 다중 모드 계획 및 통합 결제를 가능하게 합니다.
자동차 OEM 부문은 2024년에 38%의 점유율을 차지하고 2034년까지 연평균 복합 성장률(CAGR)은 20.1%를 보일 것으로 예측됩니다. OEM 각사는 브랜드 신뢰성, 딜러 네트워크, 차량 공급력을 활용하여 모빌리티 서비스의 전개를 진행하고 있습니다. 오토텍 플랫폼은 디지털 퍼스트 솔루션을 통한 성장을 이끌어 차량 액세스 효율성과 고객 경험 향상을 도모하고 있습니다.
미국의 VaaS(Vehicle as a Service) 시장은 2024년 27억 4,000만 달러에 달했습니다. 소유권 없이 모빌리티를 선호하는 소비자 증가로 구독형 및 사용량 기반 요금제가 확대되고 있습니다. 이러한 옵션은 차량 접근 장벽을 낮추고 차량 유형 선택의 유연성을 제공하며 차량 활용도를 최적화하는 동시에 공급업체에게 반복 수익 창출과 고객 참여도 증대를 가져옵니다.
자주 묻는 질문
목차
제1장 조사 방법
- 시장 범위와 정의
- 조사 설계
- 조사 접근
- 데이터 수집 방법
- 데이터 마이닝 소스
- 세계
- 지역별/국가별
- 기본 추정치와 계산
- 기준연도 계산
- 시장 추정의 주요 동향
- 1차 조사와 검증
- 1차 정보
- 예측 모델
- 조사의 전제조건과 제한 사항
제2장 주요 요약
제3장 업계 인사이트
- 생태계 분석
- 공급자의 상황
- 이익률
- 비용 구조
- 각 단계의 부가가치
- 밸류체인에 영향을 주는 요인
- 혁신
- 업계에 미치는 영향요인
- 성장 촉진요인
- 소유보다 유연한 모빌리티를 선호하는 경향
- 전기자동차의 보급 확대와 차량 전동화
- 기업용 차량 수요 증가
- 커넥티드 차량 및 텔레매틱스의 진전
- 업계의 잠재적 위험 및 과제
- 고액의 자본 투자
- 규제 및 보험에 관한 과제
- 시장 기회
- 신흥도시 시장의 사업 확대
- 스마트 시티 및 MaaS 플랫폼과의 통합
- 보험 및 유지 보수를 포함한 번들 서비스
- 전기자동차 및 상용차용 전문 솔루션
- 성장 촉진요인
- 성장 가능성 분석
- 규제 상황
- 북미
- 유럽
- 아시아태평양
- 라틴아메리카
- 중동 및 아프리카
- Porter's Five Forces 분석
- PESTEL 분석
- 기술과 혁신 동향
- 현재의 기술 동향
- 텔레매틱스와 IoT의 통합
- 인공지능과 예측 분석
- 자율주행 시스템(SAE 레벨 3-5)
- 신흥기술
- 디지털 키 및 키리스 액세스 기술
- 스마트 계약 및 결제를 위한 블록체인
- 5G 연결성과 V2X 통신
- 현재의 기술 동향
- 가격 동향
- 가격 모델의 명확성
- 분 단위 vs 시간 단위 vs 일 단위 가격 설정
- 구독 요금 체계와 숨겨진 비용
- 동적/서지 가격 설정에 대한 인식
- 포괄 요금 vs 항목별 요금
- 가격 감응도
- 총 소유비용(TCO)
- 서비스 유형별 가격 설정 모델
- 비용 비교 : 소유 모델 대 VaaS(차량 서비스로 제공)
- 동적 가격 설정/서지 가격 설정 메커니즘
- 구독 계층의 평가
- 지역별 가격 변동
- 가격 모델의 명확성
- 비용 내역 분석
- 특허 분석
- 지속가능성과 환경면
- 지속가능한 실천
- 폐기물 감축 전략
- 생산의 에너지 효율
- 환경에 배려한 대처
- 탄소발자국에 관한 고려 사항
- 소비자 행동과 채택 패턴
- 인구통계 분석
- VaaS 도입의 동기
- 도입 장벽
- 이용 빈도와 이동 패턴
- 멀티모달 모빌리티 행동
- 브랜드 충성도로 환승
- 디지털 전환과 데이터 분석
- 텔레매틱스 및 IoT 데이터
- 예측 분석과 머신러닝
- 빅 데이터 인프라
- 데이터 프라이버시와 보안
- API 이코노미와 통합
- 고객 획득 및 유지의 경제성
- 고객 획득 비용(CAC)
- 고객평생가치(LTV)
- 유닛 이코노믹스와 수익성
- 고객 이반과 유지
- 충성도 프로그램
- 보조금 의존도
- 공급망의 취약성과 위험
- 차량 조달 위험
- EV 배터리의 위험
- 충전 인프라의 위험
- 기술 및 소프트웨어 리스크
- 유지보수 및 서비스 위험
- 지정학적 및 규제 리스크
제4장 경쟁 구도
- 소개
- 기업의 시장 점유율 분석
- 북미
- 유럽
- 아시아태평양
- 라틴아메리카
- 중동 및 아프리카
- 주요 시장 기업의 경쟁 분석
- 경쟁 포지셔닝 매트릭스
- 전략적 전망 매트릭스
- 주요 발전
- 합병 및 인수
- 제휴 및 협업
- 신제품 발매
- 사업 확대 계획과 자금 조달
- 제품 및 서비스 벤치마킹
- 서비스 모델 비교
- 가격 체계 분석
- 기술 플랫폼의 기능
- 고객 경험과 사용자 인터페이스
- 차량 차량의 구성과 품질
- 벤더 선정 기준
제5장 시장 추계 및 예측 : 엔진별(2021-2034년)
- 주요 동향
- 전기자동차(EV)
- 배터리식 전기자동차(BEV)
- 플러그인 하이브리드 전기자동차(PHEV)
- 내연 기관차
- 가솔린
- 디젤
제6장 시장 추계 및 예측 : 서비스 모델별(2021-2034년)
- 주요 동향
- 구독형 차량 서비스
- 종량 과금제/사용량 기반의 차량 서비스
- 서비스형 차량 관리(FaaS)
- 서비스형 전기차(EV-as-a-service)
- 통합형 서비스형 모빌리티(MaaS)
제7장 시장 추계 및 예측 : 서비스 제공업체별(2021-2034년)
- 주요 동향
- 자동차 OEM 업체
- 자동차 판매점/딜러 그룹
- 자동차 기술 스타트업 및 모빌리티 기업
- 자동차 구독 소프트웨어 제공업체/플랫폼 제공업체
- 임대 및 금융 서비스 회사
제8장 시장 추계 및 예측 : 최종 용도별(2021-2034년)
- 주요 동향
- 기업 사용자
- 개인 사용자
제9장 시장 추계 및 예측 : 차량별(2021-2034년)
- 주요 동향
- 승용차
- 해치백
- 세단
- SUV
- 상용차
- LCV
- MCV
- 대형 상용차(HCV)
- 이륜차
- 특수 차량 및 실용 차량
제10장 시장 추계 및 예측 : 지역별(2021-2034년)
- 주요 동향
- 북미
- 미국
- 캐나다
- 유럽
- 독일
- 영국
- 프랑스
- 이탈리아
- 스페인
- 북유럽 국가
- 러시아
- 아시아태평양
- 중국
- 인도
- 일본
- 한국
- ANZ
- 베트남
- 인도네시아
- 라틴아메리카
- 브라질
- 멕시코
- 아르헨티나
- 중동 및 아프리카
- 남아프리카
- 사우디아라비아
- 아랍에미리트(UAE)
제11장 기업 프로파일
- 세계적 기업
- ARI Fleet Management
- BMW
- Care by Volvo
- Element Fleet Management
- Hertz
- 현대
- LeasePlan/Ayvens
- Mercedes-Benz
- Penske Truck Leasing
- Ryder System
- Sixt
- Turo
- Volkswagen
- Waymo
- Wheels
- Zipcar
- 지역 기업
- Emkay
- Lime
- Merchants Fleet
- Mike Albert Fleet Solutions
- PacLease
- 신흥 기업
- Finn Auto
- Porsche Drive
The Global Vehicle as a Service Market was valued at USD 10.5 billion in 2024 and is estimated to grow at a CAGR of 20.7% to reach USD 77.3 billion by 2034.
Consumers and businesses are increasingly prioritizing access to vehicles without the burdens of ownership, such as long-term commitments, insurance, maintenance, and high purchase costs. Subscription and pay-per-use models are meeting these needs by providing flexible, on-demand mobility solutions. Rising urbanization, tech-savvy populations, and the increasing integration of digital platforms are driving adoption, especially in metropolitan areas. The global push toward electric vehicles (EVs) is further accelerating VaaS growth, as EV fleets offer lower operational costs, environmental benefits, and potential government incentives. Organizations are also leveraging Fleet-as-a-Service models to reduce operational complexity and avoid capital expenditure, gaining access to vehicles while outsourcing maintenance, insurance, and fleet management. As urban mobility evolves, VaaS is emerging as a strategic tool for cost efficiency, sustainability, and convenience.
| Market Scope | |
|---|---|
| Start Year | 2024 |
| Forecast Year | 2025-2034 |
| Start Value | $10.5 Billion |
| Forecast Value | $77.3 Billion |
| CAGR | 20.7% |
The subscription-based vehicle service segment held a 63% share in 2024 and is expected to grow at a CAGR of 20.2% through 2034. Subscription models provide flexible, bundled, and commitment-free vehicle access, appealing to both consumers and businesses. Pay-per-use services target occasional users, offering cost-per-trip pricing optimized by demand algorithms. Integrated mobility platforms now combine VaaS with public transit and micromobility solutions, enabling seamless multimodal planning and unified payments.
The automotive OEMs segment held a 38% share in 2024 and is forecast to grow at a CAGR of 20.1% through 2034. OEMs are capitalizing on brand trust, dealer networks, and vehicle supply to launch mobility services. Auto-tech platforms are driving growth with digital-first solutions, streamlining vehicle access, and enhancing customer experience.
U.S. Vehicle as a Service Market reached USD 2.74 billion in 2024. Growing consumer preference for mobility without ownership is boosting subscription and pay-per-use models. These options reduce barriers to vehicle access, offer flexibility in vehicle type selection, and optimize fleet utilization, while generating recurring revenue and increasing customer engagement for providers.
Key players in the Vehicle as a Service Market include BMW, Hyundai, Mercedes-Benz, Volkswagen, Sixt, Hertz, LeasePlan/Ayvens, and Care by Volvo. To strengthen their position, companies in the Vehicle as a Service Market are focusing on expanding subscription and pay-per-use offerings, integrating EVs into fleets, and leveraging digital platforms for seamless customer experience. They are building strategic alliances with automotive manufacturers, tech firms, and mobility providers to scale operations and enhance service coverage. Fleet optimization, predictive maintenance, and dynamic pricing models are being adopted to maximize profitability, while investments in EV infrastructure and sustainability programs reinforce long-term growth. Companies are also using targeted marketing campaigns, loyalty programs, and personalized service options to attract and retain customers, ensuring a stronger market foothold and competitive advantage.
Table of Contents
Chapter 1 Methodology
- 1.1 Market scope and definition
- 1.2 Research design
- 1.2.1 Research approach
- 1.2.2 Data collection methods
- 1.3 Data mining sources
- 1.3.1 Global
- 1.3.2 Regional/Country
- 1.4 Base estimates and calculations
- 1.4.1 Base year calculation
- 1.4.2 Key trends for market estimation
- 1.5 Primary research and validation
- 1.5.1 Primary sources
- 1.6 Forecast model
- 1.7 Research assumptions and limitations
Chapter 2 Executive Summary
- 2.1 Industry 3600 synopsis
- 2.2 Key market trends
- 2.2.1 Regional
- 2.2.2 Engine
- 2.2.3 Service model
- 2.2.4 Service provider
- 2.2.5 End use
- 2.2.6 Vehicle
- 2.3 TAM analysis, 2025-2034
- 2.4 CXO perspectives: Strategic imperatives
- 2.4.1 Executive decision points
- 2.4.2 Critical success factors
- 2.5 Future outlook
- 2.6 Strategic recommendations
Chapter 3 Industry Insights
- 3.1 Industry ecosystem analysis
- 3.1.1 Supplier landscape
- 3.1.2 Profit margin
- 3.1.3 Cost structure
- 3.1.4 Value addition at each stage
- 3.1.5 Factor affecting the value chain
- 3.1.6 Disruptions
- 3.2 Industry impact forces
- 3.2.1 Growth drivers
- 3.2.1.1 Preference for flexible mobility over ownership
- 3.2.1.2 Growing EV adoption and fleet electrification
- 3.2.1.3 Rising corporate fleet demand
- 3.2.1.4 Connected vehicle and telematics advancements
- 3.2.2 Industry pitfalls and challenges
- 3.2.2.1 High capital investment
- 3.2.2.2 Regulatory and insurance challenges
- 3.2.3 Market opportunities
- 3.2.3.1 Expansion in emerging urban markets
- 3.2.3.2 Integration with smart cities and MaaS platforms
- 3.2.3.3 Bundled services with insurance and maintenance
- 3.2.3.4 Specialized EV and commercial vehicle solutions
- 3.2.1 Growth drivers
- 3.3 Growth potential analysis
- 3.4 Regulatory landscape
- 3.4.1 North America
- 3.4.2 Europe
- 3.4.3 Asia Pacific
- 3.4.4 Latin America
- 3.4.5 Middle East & Africa
- 3.5 Porter's analysis
- 3.6 PESTEL analysis
- 3.7 Technology and innovation landscape
- 3.7.1 Current technological trends
- 3.7.1.1 Telematics & IoT integration
- 3.7.1.2 Artificial intelligence & predictive analytics
- 3.7.1.3 Autonomous driving systems (SAE Level 3-5)
- 3.7.2 Emerging technologies
- 3.7.2.1 Digital key & keyless access technologies
- 3.7.2.2 Blockchain for smart contracts & payments
- 3.7.2.3 5G connectivity & V2X communication
- 3.7.1 Current technological trends
- 3.8 Price trends
- 3.8.1 Pricing model clarity
- 3.8.1.1 Per-minute vs hourly vs daily pricing
- 3.8.1.2 Subscription tiers & hidden fees
- 3.8.1.3 Dynamic/surge pricing perceptions
- 3.8.1.4 All-inclusive vs itemized pricing
- 3.8.2 Price sensitivity
- 3.8.3 Total cost of ownership (TCO)
- 3.8.4 Pricing models by service type
- 3.8.5 Cost comparison: ownership vs VaaS
- 3.8.6 Dynamic/surge pricing mechanisms
- 3.8.7 Subscription tier evaluation
- 3.8.8 Pricing variations across regions
- 3.8.1 Pricing model clarity
- 3.9 Cost breakdown analysis
- 3.10 Patent analysis
- 3.11 Sustainability and environmental aspects
- 3.11.1 Sustainable practices
- 3.11.2 Waste reduction strategies
- 3.11.3 Energy efficiency in production
- 3.11.4 Eco-friendly initiatives
- 3.11.5 Carbon footprint considerations
- 3.12 Consumer behavior & adoption patterns
- 3.12.1 Demographic analysis
- 3.12.2 Motivations for VaaS adoption
- 3.12.3 Barriers to adoption
- 3.12.4 Usage frequency & trip patterns
- 3.12.5 Multi-modal mobility behavior
- 3.12.6 Brand loyalty & switching
- 3.13 Digital transformation & data analytics
- 3.13.1 Telematics & IoT data
- 3.13.2 Predictive Analytics & ML
- 3.13.3 Big data infrastructure
- 3.13.4 Data privacy & security
- 3.13.5 API economy & integration
- 3.14 Customer acquisition & retention economics
- 3.14.1 Customer Acquisition Cost (CAC)
- 3.14.2 Customer Lifetime Value (LTV)
- 3.14.3 Unit economics & profitability
- 3.14.4 Churn & retention
- 3.14.5 Loyalty programs
- 3.14.6 Subsidy dependency
- 3.15 Supply chain vulnerabilities & risks
- 3.15.1 Vehicle procurement risks
- 3.15.2 EV battery risks
- 3.15.3 Charging infrastructure risks
- 3.15.4 Technology & software risks
- 3.15.5 Maintenance & service risks
- 3.15.6 Geopolitical & regulatory risks
Chapter 4 Competitive Landscape, 2024
- 4.1 Introduction
- 4.2 Company market share analysis
- 4.2.1 North America
- 4.2.2 Europe
- 4.2.3 Asia Pacific
- 4.2.4 LATAM
- 4.2.5 MEA
- 4.3 Competitive analysis of major market players
- 4.4 Competitive positioning matrix
- 4.5 Strategic outlook matrix
- 4.6 Key developments
- 4.6.1 Mergers & acquisitions
- 4.6.2 Partnerships & collaborations
- 4.6.3 New product launches
- 4.6.4 Expansion plans and funding
- 4.7 Product and service benchmarking
- 4.7.1 Service model comparison
- 4.7.2 Pricing structure analysis
- 4.7.3 Technology platform capabilities
- 4.7.4 Customer experience and user interface
- 4.7.5 Vehicle fleet composition and quality
- 4.8 Vendor selection criteria
Chapter 5 Market Estimates & Forecast, By Engine, 2021 - 2034 ($Mn)
- 5.1 Key trends
- 5.2 Electric vehicles (EVs)
- 5.2.1 Battery electric vehicles (BEVs)
- 5.2.2 Plug-in hybrid electric vehicles (PHEVs)
- 5.3 Internal combustion engine (ICE) vehicles
- 5.3.1 Gasoline
- 5.3.2 Diesel
Chapter 6 Market Estimates & Forecast, By Service Model, 2021 - 2034 ($Mn)
- 6.1 Key trends
- 6.2 Subscription-based vehicle service
- 6.3 Pay-per-use / usage-based vehicle service
- 6.4 Fleet-as-a-service (FaaS)
- 6.5 EV-as-a-service
- 6.6 Integrated mobility-as-a-service (MaaS)
Chapter 7 Market Estimates & Forecast, By Service Provider, 2021 - 2034 ($Mn)
- 7.1 Key trends
- 7.2 Automotive OEMs
- 7.3 Auto dealerships / dealer groups
- 7.4 Auto-tech startups & mobility companies
- 7.5 Car subscription software providers / platform providers
- 7.6 Leasing & financial services companies
Chapter 8 Market Estimates & Forecast, By End Use, 2021 - 2034 ($Mn)
- 8.1 Key trends
- 8.2 Enterprise users
- 8.3 Private users
Chapter 9 Market Estimates & Forecast, By Vehicle, 2021 - 2034 ($Mn)
- 9.1 Key trends
- 9.2 Passenger cars
- 9.2.1 Hatchback
- 9.2.2 Sedan
- 9.2.3 SUV
- 9.3 Commercial vehicles
- 9.3.1 LCV
- 9.3.2 MCV
- 9.3.3 HCV
- 9.4 Two-wheelers
- 9.5 Specialty & utility vehicles
Chapter 10 Market Estimates & Forecast, By Region, 2021 - 2034 ($Mn)
- 10.1 Key trends
- 10.2 North America
- 10.2.1 US
- 10.2.2 Canada
- 10.3 Europe
- 10.3.1 Germany
- 10.3.2 UK
- 10.3.3 France
- 10.3.4 Italy
- 10.3.5 Spain
- 10.3.6 Nordics
- 10.3.7 Russia
- 10.4 Asia Pacific
- 10.4.1 China
- 10.4.2 India
- 10.4.3 Japan
- 10.4.4 South Korea
- 10.4.5 ANZ
- 10.4.6 Vietnam
- 10.4.7 Indonesia
- 10.5 Latin America
- 10.5.1 Brazil
- 10.5.2 Mexico
- 10.5.3 Argentina
- 10.6 MEA
- 10.6.1 South Africa
- 10.6.2 Saudi Arabia
- 10.6.3 UAE
Chapter 11 Company Profiles
- 11.1 Global companies
- 11.1.1 ARI Fleet Management
- 11.1.2 BMW
- 11.1.3 Care by Volvo
- 11.1.4 Element Fleet Management
- 11.1.5 Hertz
- 11.1.6 Hyundai
- 11.1.7 LeasePlan/Ayvens
- 11.1.8 Mercedes-Benz
- 11.1.9 Penske Truck Leasing
- 11.1.10 Ryder System
- 11.1.11 Sixt
- 11.1.12 Turo
- 11.1.13 Volkswagen
- 11.1.14 Waymo
- 11.1.15 Wheels
- 11.1.16 Zipcar
- 11.2 Regional players
- 11.2.1 Emkay
- 11.2.2 Lime
- 11.2.3 Merchants Fleet
- 11.2.4 Mike Albert Fleet Solutions
- 11.2.5 PacLease
- 11.3 Emerging players
- 11.3.1 Finn Auto
- 11.3.2 Porsche Drive

