


|
시장보고서
상품코드
1892839
사이클링 파워 미터 시장 기회, 성장 촉진요인, 업계 동향 분석 및 예측(2026-2035년)Cycling Power Meter Market Opportunity, Growth Drivers, Industry Trend Analysis, and Forecast 2026 - 2035 |
||||||
세계의 사이클링 파워 미터 시장은 2025년에 4억 1,820만 달러로 평가되었으며, 2035년까지 CAGR 6.1%로 성장하여 7억 4,010만 달러에 달할 것으로 예측됩니다.

피트니스, 지구력 훈련, 성능 최적화에 대한 관심이 높아지면서 레크리에이션 목적의 라이더부터 경기용 라이더에 이르기까지 사이클링 파워미터의 보급이 지속적으로 증가하고 있습니다. 사이클리스트들은 효율성 향상, 부상 위험 감소, 체계적인 트레이닝 프로그램 유지를 위해 정확한 부하 모니터링을 우선순위로 삼고 있습니다. 피트니스 문화 확산과 함께 조직화된 이벤트 및 장거리 대회에 참가하는 개인이 증가함에 따라 신뢰할 수 있는 파워 측정 도구에 대한 수요가 꾸준히 증가하고 있습니다. 빠른 기술 혁신은 시장의 매력을 더욱 가속화하여 이 기술이 엘리트 운동선수를 넘어 폭넓은 사용자층에 도달할 수 있도록 하고 있습니다. 강화된 소재, 개선된 보정 시스템, 수명 연장된 배터리로 제품의 신뢰성과 사용 편의성을 향상시켰습니다. 이러한 발전은 측정 가능한 성능 향상을 뒷받침하는 정확한 실시간 데이터에 대한 소비자의 기대치가 변화하고 있음을 반영합니다. 기술이 더욱 접근하기 쉽고 사용자 친화적으로 발전함에 따라 파워미터는 전문 트레이닝 도구에서 열성적인 사이클리스트를 위한 주류 성능 액세서리로 꾸준히 이동하고 있습니다.
| 시장 범위 | |
|---|---|
| 시작 연도 | 2025년 |
| 예측 연도 | 2026-2035 |
| 시작 가치 | 4억 1,820만 달러 |
| 예측 금액 | 7억 4,010만 달러 |
| CAGR | 6.1% |
페달형 파워미터 부문은 2025년 48.9%의 점유율을 차지했으며, 2035년까지 연평균 4.4%의 성장률을 기록할 것으로 전망됩니다. 그 장점은 설치의 편의성, 휴대성, 그리고 여러 대의 자전거와 호환이 가능하다는 점입니다. 양면 페달 옵션은 상세한 생체역학적 지식을 제공하며, 현재 기술 혁신은 정확도 향상, 배터리 수명 연장, 스택 높이 감소에 초점을 맞추고 있습니다. 성숙 시장에서의 보급률은 안정화되는 추세지만, 다차종 소유 라이더층의 지속적인 관심으로 수요는 유지되고 있습니다.
로드 사이클링 카테고리는 2025년 60%의 점유율을 차지했으며, 2035년까지 3억 6,050만 달러에 달할 것으로 전망됩니다. 로드 라이더는 훈련에 있어 일관된 파워 데이터에 크게 의존하고 있으며, 예측 가능한 주행 환경과 확립된 성능 프레임워크의 혜택을 누리고 있습니다. 프로 수준의 인지도는 브랜드 인지도 유지에 기여하고 있으며, 앞으로의 성장은 접근하기 쉽고 간소화된 파워 솔루션을 원하는 레크리에이션 사이클리스트들에게서 기대되고 있습니다.
미국 자전거 파워미터 시장은 2025년 1억 7,500만 달러로 평가됐습니다. 이 나라의 다양한 지형, 광범위한 사이클링 커뮤니티, 경기 및 지구력 대회에 대한 폭넓은 참여는 지속적인 수요를 뒷받침하고 있습니다. 사계절 내내 주행할 수 있는 기회와 성숙한 사이클링 문화로 인해 미국은 북미 전역의 파워미터 보급의 중심지 역할을 하고 있습니다.
자주 묻는 질문
목차
제1장 조사 방법
- 시장 범위와 정의
- 조사 설계
- 조사 접근법
- 데이터 수집 방법
- 데이터 마이닝 소스
- 세계
- 지역별/국가별
- 기본 추정치와 계산
- 기준 연도 계산
- 시장 추정의 주요 동향
- 1차 조사와 검증
- 1차 정보
- 예측 모델
- 조사 가정과 제한사항
제2장 주요 요약
제3장 업계 인사이트
- 생태계 분석
- 공급업체 상황
- 이익률 분석
- 비용 구조
- 각 단계의 부가가치
- 밸류체인에 영향을 미치는 요인
- 디스럽션
- 업계에 대한 영향요인
- 성장 촉진요인
- 성과주의형 트레이닝 보급 확대
- 센서 정확도와 연결성의 진보
- 경기용 자전거 이벤트 확대
- 가처분 소득 증가와 프리미엄 피트니스 지출 확대
- 스마트 트레이닝 및 AI 분석과의 통합
- 업계의 잠재적 리스크와 과제
- 높은 초기 비용과 유지 관리 부담
- 기술적 복잡성과 사용자의 낮은 인지도
- 시장 기회
- 스마트 실내 트레이닝 기기에 대한 수요 증가
- 신흥 자전거 시장에 대한 진출
- 경량화 및 모듈화 설계 개발
- 지속가능성에 초점을 맞춘 제조 방법 성장
- 성장 가능성 분석
- 규제 상황
- 세계 규제 개요
- 북미의 규제 프레임워크
- 유럽의 규제 프레임워크
- 아시아태평양의 규제 프레임워크
- 라틴아메리카의 규제 프레임워크
- 중동 및 아프리카의 규제 프레임워크
- 안전기준과 인증
- 사이버 보안 및 데이터 프라이버시 규제
- 환경·배출 규제
- 규제 준수 비용 분석
- 세계 규제 개요
- Porters 분석
- PESTEL 분석
- 기술과 혁신 동향
- 현재 기술 동향
- 페달식 파워 미터
- 크랭크식 파워 미터
- 허브 기반 전력계
- 체인링/스파이더 기반 파워 미터
- 신기술
- AI를 활용한 예측형 트레이닝 시스템
- 광학식/레이저 구동계 센서
- 파워 계측 기능을 내장한 스마트 사이클링 슈즈
- 전기자전거용 통합형 파워 미터
- 현재 기술 동향
- 가격 동향
- 지역별
- 제품별
- 생산 통계
- 생산 거점
- 소비 거점
- 수출과 수입
- 가격 분석과 시장 경제학
- 가격 동향 개요
- 차종별 가격 책정
- 지역별 가격차이
- 총소유비용(TCO) 분석
- 정부 인센티브 및 보조금에 의한 영향
- 향후 가격 전망
- 비용 내역 분석
- 제조 비용 구조
- 연구개발비 분석
- 규제 준수 비용
- 유통·물류 비용
- 마케팅 및 판매비용
- 보증·애프터서비스 비용
- 비용 절감 로드맵
- 특허 분석
- 지속가능성과 환경면
- 지속가능한 실천
- 폐기물 절감 전략
- 생산의 에너지 효율
- 친환경적인 대처
- 탄소발자국에 관한 고려사항
- 최종사용자 행동 분석
- 소비자 채용 패턴
- 브랜드 로열티와 교체 행동
- 향후 행동 동향
- 리스크 평가·경감 프레임워크
- 기술 리스크
- 규제·컴플라이언스 리스크
- 공급망 리스크
- 시장·경쟁 리스크
- 재무 리스크
- 리스크 우선순위 지정 매트릭스
- 향후 전망과 기회
제4장 경쟁 구도
- 소개
- 기업의 시장 점유율 분석
- 북미
- 유럽
- 아시아태평양
- 라틴아메리카
- 중동 및 아프리카
- 주요 시장 기업 경쟁 분석
- 경쟁 포지셔닝 매트릭스
- 전략적 전망 매트릭스
- 주요 발전
- 인수합병
- 제휴·협업
- 신제품 발매
- 사업 확대 계획과 자금 조달
제5장 시장 추정 및 예측 : 전력계별, 2022-2035
- 주요 동향
- 페달 기반
- 크랭크 기반
- 허브 기반
- 바텀 브래킷
- 기타
제6장 시장 추정 및 예측 : 용도별, 2022-2035
- 주요 동향
- 로드 사이클링
- 산악 자전거
- 실내 트레이닝
- 기타
제7장 시장 추정 및 예측 : 유통 채널별, 2022-2035
- 주요 동향
- 온라인
- 오프라인
제8장 시장 추정 및 예측 : 기술별, 2022-2035
- 주요 동향
- 센서
- 전력 측정
- 전원
- 데이터 연결성
- ANT+
- Bluetooth Smart/BLE
제9장 시장 추정 및 예측 : 지역별, 2022-2035
- 주요 동향
- 북미
- 미국
- 캐나다
- 유럽
- 독일
- 영국
- 프랑스
- 이탈리아
- 스페인
- 러시아
- 북유럽 국가
- 포르투갈
- 크로아티아
- 아시아태평양
- 중국
- 인도
- 일본
- 호주
- 한국
- 싱가포르
- 태국
- 인도네시아
- 베트남
- 라틴아메리카
- 브라질
- 멕시코
- 아르헨티나
- 중동 및 아프리카
- 남아프리카공화국
- 사우디아라비아
- 아랍에미리트
- 튀르키예
제10장 기업 개요
- 세계 기업
- Garmin
- SRAM/Quarq
- Stages Cycling
- Favero
- SRM
- Power2 Max
- Innovations
- Wahoo Fitness
- Shimano
- Campagnolo
- Pioneer Electronics
- 지역 기업
- Magene
- Sigeyi
- XCADEY
- INPEAK
- Elite
- Bryton
- Polar Electro
- Easton Cycling
- Specialized
- Praxis Works
- Giant
- TBS Group
- PowerTap
- 신흥 기업
- BMC Switzerland
- bePRO(Healthcare Tech)
- CycleOps(Saris)
- Arofly
- Xplova
- IQSquare
- WatTeam
The Global Cycling Power Meter Market was valued at USD 418.2 million in 2025 and is estimated to grow at a CAGR of 6.1% to reach USD 740.1 million by 2035.
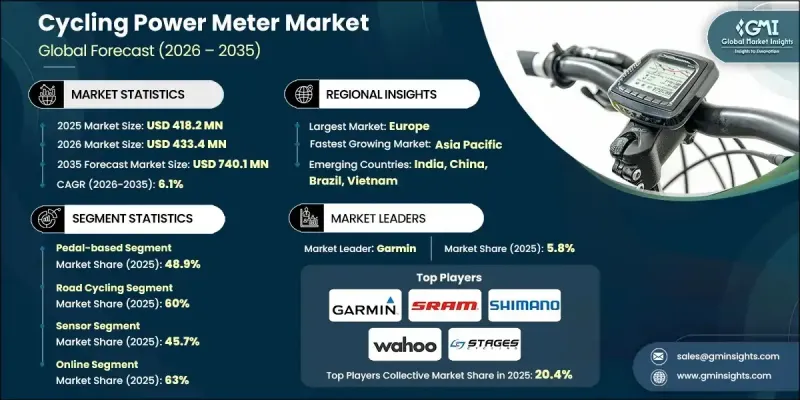
Rising interest in fitness, endurance training, and performance optimization continues to drive widespread adoption of cycling power meters among both recreational and competitive riders. Cyclists are prioritizing accurate workload monitoring to enhance efficiency, reduce injury risks, and maintain structured training programs. As fitness culture expands and more individuals participate in organized events and long-distance competitions, the demand for reliable power measurement tools grows steadily. Rapid innovation is further accelerating market appeal, enabling the technology to reach a broader user base beyond elite athletes. Enhanced materials, improved calibration systems, and longer-lasting batteries have strengthened product reliability and usability. These advancements mirror shifting consumer expectations for precise, real-time data that supports measurable performance improvement. With technology becoming more accessible and user-friendly, power meters are steadily transitioning from a specialized training tool to a mainstream performance accessory for dedicated cyclists.
| Market Scope | |
|---|---|
| Start Year | 2025 |
| Forecast Year | 2026-2035 |
| Start Value | $418.2 Million |
| Forecast Value | $740.1 Million |
| CAGR | 6.1% |
The pedal-based power meter segment held 48.9% share in 2025 and is expected to grow at a CAGR of 4.4% through 2035. Its dominance is attributed to straightforward installation, portability, and compatibility across multiple bikes. Dual-sided pedal options provide detailed biomechanical insights, and current innovation focuses on enhanced accuracy, longer battery performance, and reduced stack height. Although adoption levels in established markets are stabilizing, continued interest among multi-bike riders sustains demand.
The road cycling category accounted for a 60% share in 2025 and is projected to reach USD 360.5 million by 2035. Road riders rely heavily on consistent power data for training, benefiting from predictable riding environments and established performance frameworks. Professional-level visibility helps maintain brand awareness, and future growth is expected to come from recreational cyclists seeking accessible, simplified power solutions.
US Cycling Power Meter Market was valued at USD 107.5 million in 2025. The country's diverse terrain, extensive cycling communities, and widespread participation in competitive and endurance events continue to support sustained demand. With year-round riding opportunities and a mature cycling culture, the US remains a central hub for power meter adoption across North America.
Key players in the Global Cycling Power Meter Market include 4iiii Innovations, Favero, Garmin, Pioneer Cycle Sports, Power2max, Shimano, SRAM, Stages Cycling, and Wahoo. Companies within the Cycling Power Meter Market are using several strategies to strengthen their competitive position. Many brands are prioritizing continual sensor refinement to improve accuracy and responsiveness, ensuring consistent performance across varied riding environments. Manufacturers are expanding compatibility with major cycling ecosystems, including head units, training apps, and smart indoor platforms, to enhance user integration. Partnerships with professional athletes, teams, and coaches serve as influential marketing tools that boost product credibility among consumers. Firms are also improving durability, reducing device weight, and extending battery life to meet the expectations of high-performance users.
Table of Contents
Chapter 1 Methodology
- 1.1 Market scope and definition
- 1.2 Research design
- 1.2.1 Research approach
- 1.2.2 Data collection methods
- 1.3 Data mining sources
- 1.3.1 Global
- 1.3.2 Regional/Country
- 1.4 Base estimates and calculations
- 1.4.1 Base year calculation
- 1.4.2 Key trends for market estimation
- 1.5 Primary research and validation
- 1.5.1 Primary sources
- 1.6 Forecast model
- 1.7 Research assumptions and limitations
Chapter 2 Executive Summary
- 2.1 Industry 360° synopsis, 2022 - 2035
- 2.2 Key market trends
- 2.2.1 Regional
- 2.2.2 Power meter type
- 2.2.3 Application
- 2.2.4 Distribution channel
- 2.2.5 Technology
- 2.3 TAM Analysis, 2026-2035
- 2.4 CXO perspectives: Strategic imperatives
- 2.4.1 Executive decision points
- 2.4.2 Critical success factors
- 2.5 Future outlook and strategic recommendations
Chapter 3 Industry Insights
- 3.1 Industry ecosystem analysis
- 3.1.1 Supplier landscape
- 3.1.2 Profit margin analysis
- 3.1.3 Cost structure
- 3.1.4 Value addition at each stage
- 3.1.5 Factor affecting the value chain
- 3.1.6 Disruptions
- 3.2 Industry impact forces
- 3.2.1.1 Growth drivers
- 3.2.1.2 Growing adoption of performance-based training
- 3.2.1.3 Advancements in sensor accuracy and connectivity
- 3.2.1.4 Expansion of competitive cycling events
- 3.2.1.5 Rising disposable income and premium fitness spending
- 3.2.1.6 Integration with smart training and AI analytics
- 3.2.2 Industry pitfalls and challenges
- 3.2.2.1 High initial cost and maintenance burden
- 3.2.2.2 Technical complexity and low user awareness
- 3.2.3 Market opportunities
- 3.2.3.1 Rising demand for smart indoor training equipment
- 3.2.3.2 Expansion into emerging cycling markets
- 3.2.3.3 Development of lightweight and modular designs
- 3.2.3.4 Growth in sustainability-focused manufacturing approaches
- 3.3 Growth potential analysis
- 3.4 Regulatory landscape
- 3.4.1 Global regulatory overview
- 3.4.1.1 North America regulatory framework
- 3.4.1.2 Europe regulatory framework
- 3.4.1.3 Asia Pacific regulatory framework
- 3.4.1.4 Latin America regulatory framework
- 3.4.1.5 Middle East & Africa regulatory framework
- 3.4.2 Safety standards & certifications
- 3.4.3 Cybersecurity & data privacy regulations
- 3.4.4 Environmental & emissions regulations
- 3.4.5 Regulatory compliance cost analysis
- 3.4.1 Global regulatory overview
- 3.5 Porter's analysis
- 3.6 PESTEL analysis
- 3.7 Technology and innovation landscape
- 3.7.1 Current technological trends
- 3.7.1.1 Pedal-based power meters
- 3.7.1.2 Crank-based power meters
- 3.7.1.3 Hub-based power meters
- 3.7.1.4 Chainring/Spider-based power meters
- 3.7.2 Emerging technologies
- 3.7.2.1 AI-powered predictive training systems
- 3.7.2.2 Optical/laser drivetrain sensors
- 3.7.2.3 Smart cycling shoes with integrated power measurement
- 3.7.2.4 E-bike integrated power meters
- 3.7.1 Current technological trends
- 3.8 Price trends
- 3.8.1 By region
- 3.8.2 By product
- 3.9 Production statistics
- 3.9.1 Production hubs
- 3.9.2 Consumption hubs
- 3.9.3 Export and import
- 3.10 Pricing analysis & market economics
- 3.10.1 Pricing trends overview
- 3.10.2 Pricing by vehicle type
- 3.10.3 Regional pricing variations
- 3.10.4 Total cost of ownership (TCO) analysis
- 3.10.5 Government incentives & subsidies impact
- 3.10.6 Future pricing outlook
- 3.11 Cost breakdown analysis
- 3.11.1 Manufacturing cost structure
- 3.11.2 R&D cost analysis
- 3.11.3 Regulatory compliance costs
- 3.11.4 Distribution & logistics costs
- 3.11.5 Marketing & sales costs
- 3.11.6 Warranty & aftersales costs
- 3.11.7 Cost reduction roadmap
- 3.12 Patent analysis
- 3.13 Sustainability and environmental aspects
- 3.13.1 Sustainable practices
- 3.13.2 Waste reduction strategies
- 3.13.3 Energy efficiency in production
- 3.13.4 Eco-friendly Initiatives
- 3.13.5 Carbon footprint considerations
- 3.14 End use behavior analysis
- 3.14.1 Consumer adoption patterns
- 3.14.2 Brand loyalty & switching behavior
- 3.14.3 Future behavior trends
- 3.15 Risk assessment & mitigation framework
- 3.15.1 Technology risks
- 3.15.2 Regulatory & compliance risks
- 3.15.3 Supply chain risks
- 3.15.4 Market & competitive risks
- 3.15.5 Financial risks
- 3.15.6 Risk prioritization matrix
- 3.16 Future outlook & opportunities
Chapter 4 Competitive Landscape, 2025
- 4.1 Introduction
- 4.2 Company market share analysis
- 4.2.1 North America
- 4.2.2 Europe
- 4.2.3 Asia Pacific
- 4.2.4 LATAM
- 4.2.5 MEA
- 4.3 Competitive analysis of major market players
- 4.4 Competitive positioning matrix
- 4.5 Strategic outlook matrix
- 4.6 Key developments
- 4.6.1 Mergers & acquisitions
- 4.6.2 Partnerships & collaborations
- 4.6.3 New Product Launches
- 4.6.4 Expansion Plans and funding
Chapter 5 Market Estimates & Forecast, By Power Meter, 2022-2035 (USD Mn, Units)
- 5.1 Key trends
- 5.1.1 Pedal-based
- 5.1.2 Crank-based
- 5.1.3 Hub-based
- 5.1.4 Bottom bracket
- 5.1.5 Others
Chapter 6 Market Estimates & Forecast, By Application, 2022 - 2035 (USD Mn, Units)
- 6.1 Key trends
- 6.2 Road cycling
- 6.3 Mountain biking
- 6.4 Indoor training
- 6.5 Others
Chapter 7 Market Estimates & Forecast, By Distribution Channel, 2022 - 2035 (USD Mn, Units)
- 7.1 Key trends
- 7.2 Online
- 7.3 Offline
Chapter 8 Market Estimates & Forecast, By Technology, 2022 - 2035 (USD Mn, Units)
- 8.1 Key trends
- 8.2 Sensor
- 8.3 Power Measurement
- 8.4 Power Source
- 8.5 Data Connectivity
- 8.5.1 ANT+
- 8.5.2 Bluetooth Smart / BLE
Chapter 9 Market Estimates & Forecast, By Region, 2022 - 2035 (USD Mn, Units)
- 9.1 Key trends
- 9.2 North America
- 9.2.1 US
- 9.2.2 Canada
- 9.3 Europe
- 9.3.1 Germany
- 9.3.2 UK
- 9.3.3 France
- 9.3.4 Italy
- 9.3.5 Spain
- 9.3.6 Russia
- 9.3.7 Nordics
- 9.3.8 Portugal
- 9.3.9 Croatia
- 9.4 Asia Pacific
- 9.4.1 China
- 9.4.2 India
- 9.4.3 Japan
- 9.4.4 Australia
- 9.4.5 South Korea
- 9.4.6 Singapore
- 9.4.7 Thailand
- 9.4.8 Indonesia
- 9.4.9 Vietnam
- 9.5 Latin America
- 9.5.1 Brazil
- 9.5.2 Mexico
- 9.5.3 Argentina
- 9.6 MEA
- 9.6.1 South Africa
- 9.6.2 Saudi Arabia
- 9.6.3 UAE
- 9.6.4 Turkey
Chapter 10 Company Profiles
- 10.1 Global Players
- 10.1.1 Garmin
- 10.1.2 SRAM / Quarq
- 10.1.3 Stages Cycling
- 10.1.4 Favero
- 10.1.5 SRM
- 10.1.6. Power2 Max
- 10.1.7 Innovations
- 10.1.8 Wahoo Fitness
- 10.1.9 Shimano
- 10.1.10 Campagnolo
- 10.1.11 Pioneer Electronics
- 10.2 Regional Players
- 10.2.1 Magene
- 10.2.2 Sigeyi
- 10.2.3 XCADEY
- 10.2.4 INPEAK
- 10.2.5 Elite
- 10.2.6 Bryton
- 10.2.7 Polar Electro
- 10.2.8 Easton Cycling
- 10.2.9 Specialized
- 10.2.10 Praxis Works
- 10.2.11 Giant
- 10.2.12 TBS Group
- 10.2.13 PowerTap
- 10.3 Emerging Technology Innovators
- 10.3.1 BMC Switzerland
- 10.3.2 bePRO (Healthcare Tech)
- 10.3.3 CycleOps (Saris)
- 10.3.4 Arofly
- 10.3.5 Xplova
- 10.3.6 IQSquare
- 10.3.7 WatTeam
