
|
시장보고서
상품코드
1892880
오퍼레이터 훈련 시뮬레이터 시장 기회, 성장 촉진요인, 업계 동향 분석 및 예측(2026-2035년)Operator Training Simulator (OTS) Market Opportunity, Growth Drivers, Industry Trend Analysis, and Forecast 2026 - 2035 |
||||||
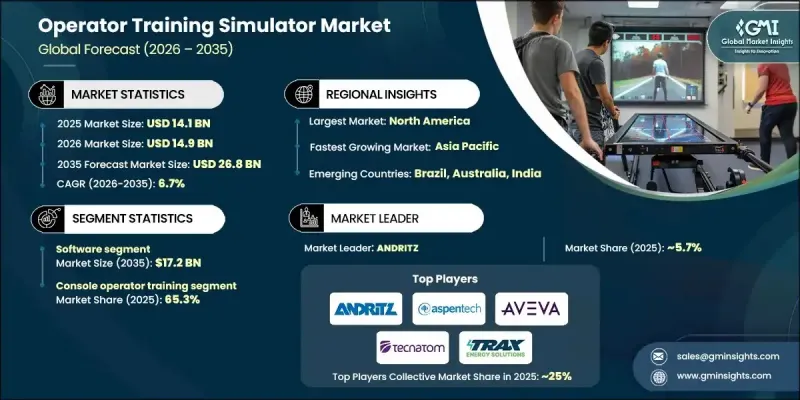
세계의 오퍼레이터 훈련 시뮬레이터 시장은 2025년에 141억 달러로 평가되었으며, 2035년까지 CAGR 6.7%로 성장하여 268억 달러에 달할 것으로 예측됩니다.

가상현실(VR), 증강현실(AR)과 같은 몰입형 기술은 실제 상황을 충실하게 재현한 인터랙티브한 3차원 환경을 제공함으로써 기존 직원 교육에 변화를 가져오고 있습니다. 이러한 기술을 통해 학습자는 주변 환경과 능동적으로 상호작용하면서 지식의 정착도를 높이고 위험한 작업 중 위험을 줄일 수 있습니다. 작업자 훈련 시뮬레이터는 실수가 심각한 결과를 초래할 수 있는 고위험 산업에서 특히 중요합니다. VR과 AR은 안전성을 향상시킬 뿐만 아니라, 기존 훈련의 물류 문제를 극복하고, 시간과 비용을 절감하며, 위험한 환경에 대한 노출을 줄이는 데 기여합니다. 산업 분야에서 보다 진보된 디지털 솔루션이 채택됨에 따라 몰입형 운영자 교육 플랫폼에 대한 수요가 지속적으로 증가하여 전체 세계 시장의 성장을 주도하고 있습니다.
| 시장 범위 | |
|---|---|
| 시작 연도 | 2025년 |
| 예측 연도 | 2026-2035 |
| 시작 가치 | 141억 달러 |
| 예측 금액 | 268억 달러 |
| CAGR | 6.7% |
소프트웨어 분야는 2025년 86억 달러의 시장 규모를 기록했으며, 2035년에는 172억 달러에 달할 것으로 전망됩니다. 첨단 시뮬레이션 엔진, 고화질 그래픽, 인터랙티브 인터페이스를 통해 물리적 힘과 운영 프로세스를 재현할 수 있어 소프트웨어 솔루션이 시장을 독점하고 있습니다. 몰입형 시뮬레이션 경험에 대한 수요가 증가함에 따라 혁신적인 VR 및 AR 소프트웨어 솔루션의 개발이 가속화되고 있습니다.
콘솔 오퍼레이터 훈련 부문은 2024년 92억 달러로 전체 시장의 약 65.3%를 차지했습니다. 이 부문이 지배적인 지위를 유지하고 있는 배경에는 고위험 작업의 대부분이 중앙제어실에서 이루어지고, 운영자가 여러 시스템을 모니터링하고 데이터를 분석하여 신속한 판단을 내려야 하는 점 등이 있습니다. 시뮬레이터 훈련을 통해 작업자는 비상사태에 적절히 대응하고, 시정 조치를 취하며, 복잡한 시스템을 안전하게 관리할 수 있습니다.
미국의 오퍼레이터 훈련 시뮬레이터 시장은 2025년에 41억 달러로 평가되며 2026년부터 2035 년까지 7%의 CAGR로 성장할 것으로 예상됩니다. 미국의 엄격한 작업장 안전 규정은 비상 대응 및 운영상의 위험을 시뮬레이션하는 고급 작업자 훈련 솔루션에 대한 수요를 주도하고 있습니다. 안전 증진을 위한 규제 이니셔티브와 정부 프로그램은 기업이 고충실도 시뮬레이터 플랫폼을 도입할 수 있는 강력한 동기가 되고 있습니다.
자주 묻는 질문
목차
제1장 조사 방법과 범위
제2장 주요 요약
제3장 업계 인사이트
- 생태계 분석
- 공급업체 상황
- 이익률
- 각 단계의 부가가치
- 밸류체인에 영향을 미치는 요인
- 업계에 대한 영향요인
- 성장 촉진요인
- 업계의 잠재적 리스크와 과제
- 기회
- 성장 가능성 분석
- 향후 시장 동향
- 가격 동향
- 지역과 구성요소
- 원재료 비용
- 원재료 공급의 실태와 인식 격차
- 공급업체 가격 상승 검증
- 규제 프레임워크
- 지역별
- Porter's Five Forces 분석
- PESTEL 분석
제4장 경쟁 구도
- 소개
- 기업의 시장 점유율 분석
- 지역별
- 기업 매트릭스 분석
- 주요 시장 기업 경쟁 분석
- 경쟁 포지셔닝 매트릭스
- 제품 포트폴리오 벤치마크
- 주요 발전
- 인수합병
- 제휴·협업
- 신제품 발매
- 확대 계획
제5장 시장 추정 및 예측 : 구성요소별, 2022-2035
- 주요 동향
- 하드웨어
- 소프트웨어
- 제어 시뮬레이션
- 프로세스 시뮬레이션
- 몰입형 시뮬레이션
- 서비스
- 컨설팅
- 설치 및 환경 시뮬레이션
- 보수·서포트
제6장 시장 추정 및 예측 : 시뮬레이션 환경별, 2022-2035
- 주요 동향
- 콘솔 오퍼레이터 훈련
- 현장 오퍼레이터 훈련
제7장 시장 추정 및 예측 : 최종 용도별, 2022-2035
- 주요 동향
- 항공우주 및 방위
- 화학제품
- 에너지·전력
- 헬스케어
- 산업용
- 석유 및 가스
- 펄프·제지
- 기타
제8장 시장 추정 및 예측 : 유통 채널별, 2022-2035
- 주요 동향
- 직접 판매
- 간접 판매
제9장 시장 추정 및 예측 : 지역별, 2022-2035
- 주요 동향
- 북미
- 미국
- 캐나다
- 유럽
- 독일
- 영국
- 프랑스
- 이탈리아
- 스페인
- 아시아태평양
- 중국
- 인도
- 일본
- 한국
- 호주
- 라틴아메리카
- 브라질
- 멕시코
- 아르헨티나
- 중동 및 아프리카
- 아랍에미리트
- 사우디아라비아
- 남아프리카공화국
제10장 기업 개요
- ABB Ltd.
- ANDRITZ
- Aspen Technology Inc.
- AVEVA Group Limited
- Designing Digitally Inc.
- DNV AS
- DuPont
- EON Reality
- ESI Group
- Hyperion Group
- Schneider Electric
- Siemens
- Tecnatom
- TRAX Energy Solutions
- Yokogawa Electric Corporation
The Global Operator Training Simulator Market was valued at USD 14.1 billion in 2025 and is estimated to grow at a CAGR of 6.7% to reach USD 26.8 billion by 2035.
Immersive technologies such as Virtual Reality (VR) and Augmented Reality (AR) are transforming traditional employee training by providing interactive, three-dimensional environments that closely replicate real-world conditions. These technologies allow learners to engage with their surroundings, improving knowledge retention and reducing risk during hazardous operations. Operator training simulators are particularly critical for high-stakes industries where mistakes can have serious consequences. In addition to safety, VR and AR help overcome logistical challenges of conventional training, reducing time, cost, and exposure to dangerous conditions. As industries adopt more advanced digital solutions, the demand for immersive operator training platforms continues to rise, driving the overall growth of the market globally.
| Market Scope | |
|---|---|
| Start Year | 2025 |
| Forecast Year | 2026-2035 |
| Start Value | $14.1 Billion |
| Forecast Value | $26.8 Billion |
| CAGR | 6.7% |
The software segment held USD 8.6 billion in 2025 and is expected to reach USD 17.2 billion by 2035. Software solutions dominate the market due to their ability to replicate physical forces and operational processes through sophisticated simulation engines, high-fidelity graphics, and interactive interfaces. The demand for engaging and hands-on simulated experiences accelerates the development of innovative VR and AR software solutions.
The console operator training segment generated USD 9.2 billion in 2024, representing approximately 65.3% of the market. This segment remains dominant as most high-risk operations occur in centralized control rooms where operators monitor multiple systems, analyze data, and make rapid decisions. Simulator training ensures operators can respond correctly in emergencies, take corrective actions, and manage complex systems safely.
U.S. Operator Training Simulator Market was valued at USD 4.1 billion in 2025 and is anticipated to grow at a CAGR of 7% from 2026 to 2035. Stringent workplace safety regulations in the U.S. drive demand for advanced operator training solutions that simulate emergency responses and operational hazards. Regulatory initiatives and government programs promoting safety create strong incentives for companies to implement high-fidelity simulator platforms.
Key players in the Operator Training Simulator Market include Schneider Electric, Aspen Technology Inc., ABB Ltd., DNV AS, EON Reality, AVEVA Group Limited, TRAX Energy Solutions, Hyperion Group, Siemens, Tecnatom, Yokogawa Electric Corporation, Designing Digitally Inc., DuPont, and ESI Group. Market leaders focus on strategies such as continuous R&D to enhance software realism and simulation accuracy. Companies invest in VR and AR technology, expand platform capabilities for multiple industry applications, and integrate cloud-based solutions for remote training. Collaborations with industrial partners, customization of training modules, and after-sales support improve client retention. In addition, firms emphasize compliance with safety regulations, develop predictive analytics features, and adopt subscription-based or service-oriented pricing models to strengthen their market presence and maintain long-term competitiveness.
Table of Contents
Chapter 1 Methodology & Scope
- 1.1 Market scope and definition
- 1.2 Research design
- 1.2.1 Research approach
- 1.2.2 Data collection methods
- 1.3 Data mining sources
- 1.3.1 Global
- 1.3.2 Regional/Country
- 1.4 Base estimates and calculations
- 1.4.1 Base year calculation
- 1.4.2 Key trends for market estimation
- 1.5 Primary research and validation
- 1.5.1 Primary sources
- 1.6 Forecast model
- 1.7 Research assumptions and limitations
Chapter 2 Executive Summary
- 2.1 Industry 360° synopsis
- 2.2 Key market trends
- 2.2.1 Regional trends
- 2.2.2 Component trends
- 2.2.3 Simulation environment trends
- 2.2.4 End Use trends
- 2.2.5 Distribution channel trends
- 2.3 CXO perspective: Strategic imperatives
- 2.3.1 Key decision points for industry executives
- 2.3.2 Critical success factors for market players
- 2.4 Future outlook and strategic recommendations
- 2.5 Strategic recommendations
- 2.5.1 Supply chain diversification strategy
- 2.5.2 Product portfolio enhancement
- 2.5.3 Partnership and alliance opportunities
- 2.5.4 Cost management and pricing strategy
- 2.6 Decision framework
- 2.6.1 Investment priority matrix
- 2.6.2 ROI analysis
Chapter 3 Industry Insights
- 3.1 Industry ecosystem analysis
- 3.1.1 Supplier landscape
- 3.1.2 Profit margin
- 3.1.3 Value addition at each stage
- 3.1.4 Factor affecting the value chain
- 3.2 Industry impact forces
- 3.2.1 Growth drivers
- 3.2.2 Industry pitfalls & challenges
- 3.2.3 Opportunities
- 3.3 Growth potential analysis
- 3.4 Future market trends
- 3.5 Price trends
- 3.5.1 Region and component
- 3.5.2 Raw material cost
- 3.5.3 Real vs. perceived capacity constraints in supply of raw materials
- 3.5.4 Supplier price increase validation
- 3.6 Regulatory framework
- 3.6.1 By region
- 3.7 Porter's five forces analysis
- 3.8 PESTEL analysis
Chapter 4 Competitive Landscape, 2025
- 4.1 Introduction
- 4.2 Company market share analysis
- 4.2.1 By region
- 4.3 Company matrix analysis
- 4.4 Competitive analysis of major market players
- 4.5 Competitive positioning matrix
- 4.6 Product portfolio benchmarking
- 4.7 Key developments
- 4.7.1 Mergers & acquisitions
- 4.7.2 Partnerships & collaborations
- 4.7.3 New product launches
- 4.7.4 Expansion Plans
Chapter 5 Market Estimates & Forecast, By Component, 2022 - 2035 (USD Billion)
- 5.1 Key trends
- 5.2 Hardware
- 5.3 Software
- 5.3.1 Control simulation
- 5.3.2 Process simulation
- 5.3.3 Immersive simulation
- 5.4 Services
- 5.4.1 Consulting
- 5.4.2 Installation & environmental simulation
- 5.4.3 Maintenance & support
Chapter 6 Market Estimates & Forecast, By Simulation Environment, 2022 - 2035 (USD Billion)
- 6.1 Key trends
- 6.2 Console operator training
- 6.3 Field operator training
Chapter 7 Market Estimates & Forecast, By End Use, 2022 - 2035 (USD Billion)
- 7.1 Key trends
- 7.2 Aerospace & defense
- 7.3 Chemical
- 7.4 Energy & power
- 7.5 Healthcare
- 7.6 Industrial
- 7.7 Oil & gas
- 7.8 Pulp & paper
- 7.9 Others
Chapter 8 Market Estimates & Forecast, By Distribution Channel, 2022 - 2035, (USD Billion)
- 8.1 Key trends
- 8.2 Direct sales
- 8.3 Indirect sales
Chapter 9 Market Estimates & Forecast, By Region, 2022 - 2035, (USD Billion)
- 9.1 Key trends
- 9.2 North America
- 9.2.1 U.S.
- 9.2.2 Canada
- 9.3 Europe
- 9.3.1 Germany
- 9.3.2 U.K.
- 9.3.3 France
- 9.3.4 Italy
- 9.3.5 Spain
- 9.4 Asia Pacific
- 9.4.1 China
- 9.4.2 India
- 9.4.3 Japan
- 9.4.4 South Korea
- 9.4.5 Australia
- 9.5 Latin America
- 9.5.1 Brazil
- 9.5.2 Mexico
- 9.5.3 Argentina
- 9.6 MEA
- 9.6.1 UAE
- 9.6.2 Saudi Arabia
- 9.6.3 South Africa
Chapter 10 Company Profiles (Business Overview, Financial Data, Product Landscape, Strategic Outlook, SWOT Analysis)
- 10.1 ABB Ltd.
- 10.2 ANDRITZ
- 10.3 Aspen Technology Inc.
- 10.4 AVEVA Group Limited
- 10.5 Designing Digitally Inc.
- 10.6 DNV AS
- 10.7 DuPont
- 10.8 EON Reality
- 10.9 ESI Group
- 10.10 Hyperion Group
- 10.11 Schneider Electric
- 10.12 Siemens
- 10.13 Tecnatom
- 10.14 TRAX Energy Solutions
- 10.15 Yokogawa Electric Corporation