


|
시장보고서
상품코드
1892894
전기 트랜스포터 시장 기회, 성장 촉진요인, 업계 동향 분석 및 예측(2026-2035년)Electric Transporters Market Opportunity, Growth Drivers, Industry Trend Analysis, and Forecast 2026 - 2035 |
||||||
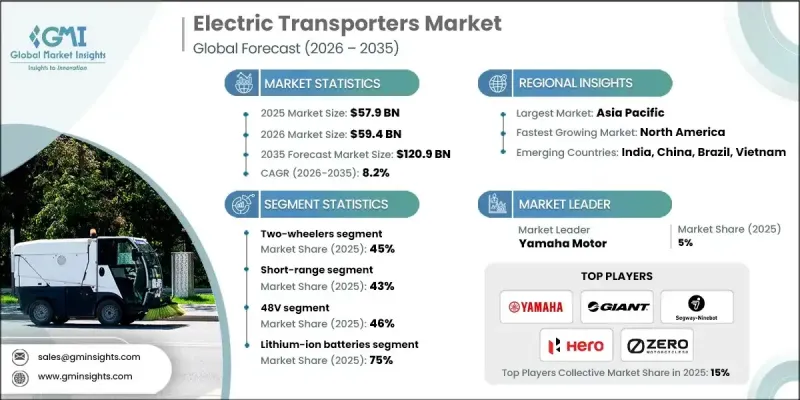
세계의 전기 트랜스포터 시장은 2025년에 579억 달러로 평가되었으며, 2035년까지 연평균 복합 성장률(CAGR) 8.2%를 나타내 1,209억 달러에 이를 것으로 예측됩니다.
연료비 상승과 기존 에너지 시장의 지속적인 불안정화로 인해 기업은 꾸준히 전기 이동성으로 전환하고 있습니다. 원유 가격이 배럴당 80달러에 더 가까워지고 5달러 상승이 예상되는 가운데 전기 트랜스포터는 연료비와 유지보수 수요를 모두 줄이는 비용 효율적인 대안이 되고 있습니다. 특히 전력요금이 안정된 지역과 재생가능 에너지에 대한 접근성이 좋은 지역에서는 이러한 차량의 총소유비용(TCO)이 점점 더 유리한 선택이 되고 있습니다. 주요 도시의 급속한 인구 증가는 도시 도로망에 대한 부담을 지속적으로 증가시키고 있으며, 10억 명 이상이 여전히 신뢰할 수 있는 전천후 도로가 부족합니다. 교통 정체가 악화되는 가운데 컴팩트한 전기 수송 차량 수요가 높아지고 있습니다. 확대하는 전자상거래는 라스트마일 배송에 이용되는 전기화물 운송 차량 수요를 가속화하고 있으며, 표준화된 데이터 형식과 통신 프로토콜에 있어서 기술적 진보가 플랫폼 간의 상호 운용성을 향상시키고 있습니다. 규제의 명확화가 진행되어 안전성과 호환성을 강화하는 세계의 대처도, 소비자용 및 상업용의 이용 사례에 있어서 보급을 가속시키는 일조가 되고 있습니다.
| 시장 범위 | |
|---|---|
| 시작 연도 | 2025년 |
| 예측 연도 | 2026-2035년 |
| 시작 가치 | 579억 달러 |
| 예측 금액 | 1,209억 달러 |
| CAGR | 8.2% |
이륜차 부문은 2025년에 45%의 점유율을 차지했고 2026년부터 2035년에 걸쳐 CAGR 8.5%를 나타낼 것으로 예측됩니다. 이 부문은 상대적으로 작은 배터리 시스템을 필요로 하기 때문에 전동화를 주도하고 있으며, 업계 전반의 배터리 비용이 계속 감소하면서 경쟁력 있는 가격을 유지하는 데 도움이 됩니다.
단거리 부문은 2025년에 43%의 점유율을 차지했고 2035년까지 8.6%라는 최고 성장률로 확대될 것으로 예상되고 있습니다. 이 차량은 100km 미만의 일상적인 도시 이동을 가정하여 설계되었으며 기존 충전 인프라를 활용합니다. 저비용, 경량 설계, 기동성, 주차 용이성 등의 특징이 마이크로모빌리티나 라스트마일 배송에 주력하는 통근자나 기업에 지지되고 있습니다.
아시아태평양의 전기 트랜스포터 시장은 2025년에 73%의 점유율을 얻었으며, 2025년부터 2034년까지 연평균 복합 성장률(CAGR) 7.8%를 나타낼 것으로 추정됩니다. 중국에서의 활발한 생산 활동과 인도 및 동남아시아 시장에서의 보급 확대가 이 지역의 우위성을 계속 지지하고 있습니다. 중국은 세계 전기 트랜스포터 판매량의 약 78%를 차지하며, 이는 광범위한 소비자 수용, 정부 주도 시책, 대규모 산업 기반에 의해 지원되고 있습니다.
자주 묻는 질문
목차
제1장 조사 방법
제2장 주요 요약
제3장 업계 인사이트
- 생태계 분석
- 공급업체 현황
- 이익률 분석
- 비용 구조
- 각 단계별 부가가치
- 밸류체인에 영향을 주는 요인
- 파괴적 혁신
- 업계에 미치는 영향요인
- 성장 촉진요인
- 도시화와 교통 정체
- 환경 문제와 규제면에서의 지원
- 전자상거래와 물류 성장
- 전지 기술의 진보와 비용 저하
- 연료 가격 상승과 운영 비용 절감
- 업계의 잠재적 위험 및 과제
- 충전 인프라의 부족과 항속 거리에 대한 불안
- 높은 초기 비용과 회수 기간의 길이
- 시장 기회
- 라스트마일 배송 솔루션 확대
- 배터리 교환 및 급속 충전 인프라 개발
- 스마트 시티 및 도시 모빌리티 구상과의 통합
- 물류 및 대중 교통에서 함대 전동화
- 기술 혁신과 모듈식 차량 설계
- 성장 가능성 분석
- 규제 상황
- 세계 규제 개관
- 북미의 규제 프레임워크
- 유럽의 규제 프레임워크
- 아시아태평양의 규제 프레임워크
- 라틴아메리카의 규제 프레임 워크
- 중동 및 아프리카에서의 규제 프레임워크
- 안전기준과 인증
- 사이버 보안 및 데이터 프라이버시 규제
- 환경·배출 규제
- 규제 준수 비용 분석
- 세계 규제 개관
- Porter's Five Forces 분석
- PESTEL 분석
- 기술 및 혁신 현황
- 현재 기술 동향
- 배터리 기술
- 전기 모터 기술
- 파워 일렉트로닉스 및 제어 시스템
- 커넥티비티와 텔레매틱스
- 충전 인프라
- 신흥 기술
- 차세대 전지 기술
- 선진 충전 기술
- 자율주행 및 ADAS 기능
- 고도의 접속성(신흥)
- 차량에서 전력망으로의 기술(V2G)
- 현재 기술 동향
- 가격 동향
- 지역별
- 제품별
- 생산 통계
- 생산 거점
- 소비 허브
- 수출과 수입
- 가격 분석과 시장 경제학
- 가격 동향의 개요
- 차량 유형별 가격 설정
- 지역별 가격 차이
- 배터리 비용이 차량 가격에 미치는 영향
- 총소유비용(TCO) 분석
- 정부의 인센티브 및 보조금에 의한 영향
- 공유 마이크로모빌리티 가격 설정 모델
- 가격 탄력성 분석
- 장래의 가격 전망
- 코스트 내역 분석
- 제조 비용 구조
- R&D 비용 분석
- 규제 준수 비용
- 유통 및 물류 비용
- 마케팅 및 판매 비용
- 운영 비용(공유 모빌리티)
- 충전 인프라 비용
- 보증 및 애프터 판매 비용
- 비용 절감 로드맵
- 특허 분석
- 지속가능성과 환경적 측면
- 지속가능한 실천
- 폐기물 감축 전략
- 생산에 있어서 에너지 효율
- 환경에 배려한 대처
- 탄소발자국에 관한 고려 사항
- 최종 사용자 행동 분석
- 소비자의 채용 패턴
- 이용 패턴과 이동 특성
- 이동수단의 선택과 대체분석
- 구매 결정 요인
- 공유 모빌리티 이용자의 행동 특성
- 함대 운영자의 의사 결정
- 교통기관의 조달 행동
- 안전성 인식과 위험 의식
- 브랜드 충성도와 전환 행동
- 장래의 행동 동향
- 리스크 평가 및 경감 프레임워크
- 기술 위험
- 규제 및 컴플라이언스 리스크
- 공급 체인 위험
- 시장 및 경쟁 리스크
- 재무위험
- 운영 리스크(공유 모빌리티)
- 평판 및 브랜드 리스크
- 환경 및 기후위험
- 보험 및 배상 책임 리스크
- 위험 우선순위 행렬
- 전망과 기회
- 신기술 동향
- 규제의 진화와 영향
- 비즈니스 모델의 혁신
- 투자 기회
- 전략적 제안
- 리스크 분석 및 경감 전략
- 시나리오 분석
제4장 경쟁 구도
- 서론
- 기업의 시장 점유율 분석
- 북미
- 유럽
- 아시아태평양
- 라틴아메리카
- 중동 및 아프리카
- 주요 시장 기업의 경쟁 분석
- 경쟁 포지셔닝 매트릭스
- 전략적 전망 매트릭스
- 주요 발전
- 인수합병
- 파트너십 및 협력
- 신제품 출시
- 사업 확대 계획과 자금 조달
제5장 시장 추계·예측 : 전기자동차별(2022-2035년)
- 이륜차
- 전기 자전거
- 전기 스쿠터
- 전기 오토바이
- 삼륜차
- 개인 이동 수단
- 스케이트보드
- 호버보드
제6장 시장 추계·예측 : 전압별(2022-2035년)
- 24V
- 36V
- 48V
- 48V 초과
제7장 시장 추계·예측 : 배터리별(2022-2035년)
- 리튬 이온
- 납산
- 니켈-금속 수소화물
- 고체 상태
제8장 시장 추계·예측 : 범위별(2022-2035년)
- 단거리(도시, 일일 100km 이하)
- 중거리(지역간, 일일 100-300km)
- 장거리(300km 이상)
제9장 시장 추계·예측 : 용도별(2022-2035년)
- 마이크로 모빌리티
- 라이드셰어링
- 화물 운송
- 대중교통
- 개인용 레저
- 기타
제10장 시장 추계·예측 : 최종 용도별(2022-2035년)
- 개인 구매
- 상업 기업
- 정부 및 비영리 구매자
- 산업 및 물류
- 기타
제11장 시장 추계·예측 : 지역별(2022-2035년)
- 북미
- 미국
- 캐나다
- 유럽
- 독일
- 영국
- 프랑스
- 이탈리아
- 스페인
- 러시아
- 북유럽 국가
- 포르투갈
- 크로아티아
- 아시아태평양
- 중국
- 인도
- 일본
- 호주
- 한국
- 싱가포르
- 태국
- 인도네시아
- 베트남
- 라틴아메리카
- 브라질
- 멕시코
- 아르헨티나
- 중동 및 아프리카
- 남아프리카
- 사우디아라비아
- 아랍에미리트(UAE)
- 튀르키예
제12장 기업 프로파일
- 세계 기업
- Accell
- Bosch eBike Systems
- BYD Company
- CATL(Contemporary Amperex Technology)
- Energica Motor Company
- NIU Technologies
- Proterra
- Segway Ninebot
- Yadea
- Zero Motorcycles
- 지역 기업
- Giant Manufacturing
- Harley-Davidson
- Nova Bus
- Stromer
- Gazelle
- Tern Bicycles
- Gogoro
- Ather Energy
- Hero Motorcorp
- Piaggio
- 신기술 혁신 기업
- Lime
- Aventon Bikes
- Tier Mobility
- BMW Motorrad
- Yamaha Motor
The Global Electric Transporters Market was valued at USD 57.9 billion in 2025 and is estimated to grow at a CAGR of 8.2% to reach USD 120.9 billion by 2035.

Businesses are steadily shifting toward electric mobility due to rising fuel costs and ongoing instability in conventional energy markets. As oil prices move toward USD 80 per barrel with an expected USD 5 per barrel increase, electric transporters are becoming cost-efficient alternatives that reduce both fuel spending and maintenance needs. These vehicles increasingly present a favorable total cost of ownership, particularly in regions with dependable electricity rates or strong access to renewable power. Rapid population growth in major cities continues to strain urban road networks, and more than 1 billion people still lack reliable all-weather roads. As traffic congestion worsens, compact electric transporters are gaining momentum. Expanding e-commerce is accelerating demand for electric cargo transporters used in last-mile delivery, while technological progress in standardized data formats and communication protocols is improving platform interoperability. Advancing regulatory clarity and global efforts to strengthen safety and compatibility are also helping accelerate adoption across consumer and commercial use cases.
| Market Scope | |
|---|---|
| Start Year | 2025 |
| Forecast Year | 2026-2035 |
| Start Value | $57.9 Billion |
| Forecast Value | $120.9 Billion |
| CAGR | 8.2% |
The two-wheeler segment held a 45% share in 2025 and is expected to grow at a CAGR of 8.5% from 2026 to 2035. This segment leads electrification because it requires relatively small battery systems, which helps sustain competitive pricing as industry-wide battery costs continue to decrease.
The short-range segment accounted for a 43% share in 2025 and is projected to grow at the highest rate of 8.6% through 2035. These vehicles are designed for daily urban trips under 100 km and make use of readily available charging infrastructure. Their lower cost, lightweight design, maneuverability, and ease of parking appeal to commuters and companies focused on micro-mobility and last-mile delivery.
Asia Pacific Electric Transporters Market captured 73% share in 2025 and is expected to grow at a CAGR of 7.8% throughout 2025-2034. Strong production activity in China and rising adoption in markets across India and Southeast Asia continue to influence regional dominance. China represents approximately 78% of global electric transporter sales volume, supported by widespread consumer acceptance, government-backed initiatives, and large-scale industry capacity.
Major companies in the Global Electric Transporters Market include Ather Energy, BMW Motorrad, Giant, Harley-Davidson, Hero MotoCorp, Niu Technologies, Segway Ninebot, Yadea Technology, Yamaha Motor, and Zero Motorcycles. Leading manufacturers are expanding their Electric Transporters Market presence by strengthening battery efficiency, improving motor performance, and prioritizing affordable product lines for urban users. Many companies are investing in modular platforms that allow them to scale models across multiple price tiers while optimizing production costs. Collaboration with charging infrastructure providers remains a core strategy as firms work to ensure convenient access to energy for users. Businesses are also forming alliances with fleet operators to increase adoption in commercial delivery applications. Continuous research in lightweight materials, safety systems, and digital connectivity helps brands differentiate their offerings. Manufacturers are further enhancing their reach by expanding global distribution networks and aligning with regional regulatory frameworks to accelerate certification and market entry.
Table of Contents
Chapter 1 Methodology
- 1.1 Market scope and definition
- 1.2 Research design
- 1.2.1 Research approach
- 1.2.2 Data collection methods
- 1.3 Data mining sources
- 1.3.1 Global
- 1.3.2 Regional/Country
- 1.4 Base estimates and calculations
- 1.4.1 Base year calculation
- 1.4.2 Key trends for market estimation
- 1.5 Primary research and validation
- 1.5.1 Primary sources
- 1.6 Forecast model
- 1.7 Research assumptions and limitations
Chapter 2 Executive Summary
- 2.1 Industry 3600 synopsis, 2022 - 2035
- 2.2 Key market trends
- 2.2.1 Regional
- 2.2.2 Electric Vehicle
- 2.2.3 Voltage
- 2.2.4 Battery
- 2.2.5 Range
- 2.2.6 Application
- 2.2.7 End Use
- 2.3 TAM Analysis, 2026-2035
- 2.4 CXO perspectives: Strategic imperatives
- 2.4.1 Executive decision points
- 2.4.2 Critical success factors
- 2.5 Future outlook and strategic recommendations
Chapter 3 Industry Insights
- 3.1 Industry ecosystem analysis
- 3.1.1 Supplier landscape
- 3.1.2 Profit margin analysis
- 3.1.3 Cost structure
- 3.1.4 Value addition at each stage
- 3.1.5 Factor affecting the value chain
- 3.1.6 Disruptions
- 3.2 Industry impact forces
- 3.2.1.1 Growth drivers
- 3.2.1.2 Urbanization and traffic congestion
- 3.2.1.3 Environmental concerns and regulatory support
- 3.2.1.4 Growth in e-commerce and logistics
- 3.2.1.5 Advances in battery technology and declining costs
- 3.2.1.6 Rising fuel prices and lower operating costs
- 3.2.2 Industry pitfalls and challenges
- 3.2.2.1 Limited charging infrastructure and range anxiety
- 3.2.2.2 High upfront costs and long payback period
- 3.2.3 Market opportunities
- 3.2.3.1 Expansion of last-mile delivery solutions
- 3.2.3.2 Development of battery-swapping and fast-charging infrastructure
- 3.2.3.3 Integration with smart city and urban mobility initiatives
- 3.2.3.4 Fleet electrification for logistics and public transport
- 3.2.3.5 Technological innovation and modular vehicle design
- 3.3 Growth potential analysis
- 3.4 Regulatory landscape
- 3.4.1 Global regulatory overview
- 3.4.1.1 North America regulatory framework
- 3.4.1.2 Europe regulatory framework
- 3.4.1.3 Asia Pacific regulatory framework
- 3.4.1.4 Latin America regulatory framework
- 3.4.1.5 Middle East & Africa regulatory framework
- 3.4.2 Safety standards & certifications
- 3.4.3 Cybersecurity & data privacy regulations
- 3.4.4 Environmental & emissions regulations
- 3.4.5 Regulatory compliance cost analysis
- 3.4.1 Global regulatory overview
- 3.5 Porter's analysis
- 3.6 PESTEL analysis
- 3.7 Technology and innovation landscape
- 3.7.1 Current technological trends
- 3.7.1.1 Battery technologies
- 3.7.1.2 Electric motor technologies
- 3.7.1.3 Power electronics & control systems
- 3.7.1.4 Connectivity & telematics
- 3.7.1.5 Charging infrastructure
- 3.7.2 Emerging technologies
- 3.7.2.1 Next-generation battery technologies
- 3.7.2.2 Advanced charging technologies
- 3.7.2.3 Autonomous & ADAS features
- 3.7.2.4 Advanced connectivity (emerging)
- 3.7.2.5 Vehicle-to-grid (V2G) technologies
- 3.7.1 Current technological trends
- 3.8 Price trends
- 3.8.1 By region
- 3.8.2 By product
- 3.9 Production statistics
- 3.9.1 Production hubs
- 3.9.2 Consumption hubs
- 3.9.3 Export and import
- 3.10 Pricing analysis & market economics
- 3.10.1 Pricing trends overview
- 3.10.2 Pricing by vehicle type
- 3.10.3 Regional pricing variations
- 3.10.4 Battery cost impact on vehicle pricing
- 3.10.5 Total cost of ownership (TCO) analysis
- 3.10.6 Government incentives & subsidies impact
- 3.10.7 Shared micromobility pricing models
- 3.10.8 Pricing elasticity analysis
- 3.10.9 Future pricing outlook
- 3.11 Cost breakdown analysis
- 3.11.1 Manufacturing cost structure
- 3.11.2 R&D cost analysis
- 3.11.3 Regulatory compliance costs
- 3.11.4 Distribution & logistics costs
- 3.11.5 Marketing & sales costs
- 3.11.6 Operational costs (shared mobility)
- 3.11.7 Charging infrastructure costs
- 3.11.8 Warranty & aftersales costs
- 3.11.9 Cost reduction roadmap
- 3.12 Patent analysis
- 3.13 Sustainability and environmental aspects
- 3.13.1 Sustainable practices
- 3.13.2 Waste reduction strategies
- 3.13.3 Energy efficiency in production
- 3.13.4 Eco-friendly Initiatives
- 3.13.5 Carbon footprint considerations
- 3.14 End use behavior analysis
- 3.14.1 Consumer adoption patterns
- 3.14.2 Usage patterns & trip characteristics
- 3.14.3 Mode choice & substitution analysis
- 3.14.4 Purchase decision factors
- 3.14.5 Shared mobility user behavior
- 3.14.6 Fleet operator decision-making
- 3.14.7 Transit agency procurement behavior
- 3.14.8 Safety perception & risk awareness
- 3.14.9 Brand loyalty & switching behavior
- 3.14.10 Future behavior trends
- 3.15 Risk assessment & mitigation framework
- 3.15.1 Technology risks
- 3.15.2 Regulatory & compliance risks
- 3.15.3 Supply chain risks
- 3.15.4 Market & competitive risks
- 3.15.5 Financial risks
- 3.15.6 Operational risks (shared mobility)
- 3.15.7 Reputational & brand risks
- 3.15.8 Environmental & climate risks
- 3.15.9 Insurance & liability risks
- 3.15.10 Risk prioritization matrix
- 3.16 Future outlook & opportunities
- 3.16.1 Emerging technology trends
- 3.16.2 Regulatory evolution & impact
- 3.16.3 Business model innovation
- 3.16.4 Investment opportunities
- 3.16.5 Strategic recommendations
- 3.16.6 Risk analysis & mitigation strategies
- 3.16.7 Scenario analysis
Chapter 4 Competitive Landscape, 2025
- 4.1 Introduction
- 4.2 Company market share analysis
- 4.2.1 North America
- 4.2.2 Europe
- 4.2.3 Asia Pacific
- 4.2.4 LATAM
- 4.2.5 MEA
- 4.3 Competitive analysis of major market players
- 4.4 Competitive positioning matrix
- 4.5 Strategic outlook matrix
- 4.6 Key developments
- 4.6.1 Mergers & acquisitions
- 4.6.2 Partnerships & collaborations
- 4.6.3 New Product Launches
- 4.6.4 Expansion Plans and funding
Chapter 5 Market Estimates & Forecast, By Electric Vehicle, 2022 - 2035 (USD Mn, Units)
- 5.1 Key trends
- 5.2 Two-wheelers
- 5.2.1 E-bikes
- 5.2.2 E-scooters
- 5.2.3 Electric motorcycles
- 5.3 Three-wheelers
- 5.4 Personal transporters
- 5.4.1 Skateboards
- 5.4.2 Hoverboards
Chapter 6 Market Estimates & Forecast, By Voltage, 2022 - 2035 (USD Mn, Units)
- 6.1 Key trends
- 6.2 24V
- 6.3 36V
- 6.4 48V
- 6.5 Above 48V
Chapter 7 Market Estimates & Forecast, By Battery, 2022 - 2035 (USD Mn, Units)
- 7.1 Key trends
- 7.2 Lithium-ion
- 7.3 Lead-acid
- 7.4 Nickel-metal hydride
- 7.5 Solid state
Chapter 8 Market Estimates & Forecast, By Range, 2022 - 2035 (USD Mn, Units)
- 8.1 Key trends
- 8.2 Short-range (urban, ≤100 km / day)
- 8.3 Mid-range (regional, 100-300 km / day)
- 8.4 Long-range (≥300 km / day)
Chapter 9 Market Estimates & Forecast, By Application, 2022 - 2035 (USD Mn, Units)
- 9.1 Key trends
- 9.2 Micro-mobility
- 9.3 Ridesharing
- 9.4 Freight & cargo transport
- 9.5 Public transport
- 9.6 Personal leisure
- 9.7 Others
Chapter 10 Market Estimates & Forecast, By End Use, 2022 - 2035 (USD Mn, Units)
- 10.1 Key trends
- 10.2 Personal purchase
- 10.3 Commercial enterprises
- 10.4 Government & Non-Profit Buyers
- 10.5 Industrial & Logistics
- 10.6 Others
Chapter 11 Market Estimates & Forecast, By Region, 2022 - 2035 (USD Mn, Units)
- 11.1 Key trends
- 11.2 North America
- 11.2.1 US
- 11.2.2 Canada
- 11.3 Europe
- 11.3.1 Germany
- 11.3.2 UK
- 11.3.3 France
- 11.3.4 Italy
- 11.3.5 Spain
- 11.3.6 Russia
- 11.3.7 Nordics
- 11.3.8 Portugal
- 11.3.9 Croatia
- 11.4 Asia Pacific
- 11.4.1 China
- 11.4.2 India
- 11.4.3 Japan
- 11.4.4 Australia
- 11.4.5 South Korea
- 11.4.6 Singapore
- 11.4.7 Thailand
- 11.4.8 Indonesia
- 11.4.9 Vietnam
- 11.5 Latin America
- 11.5.1 Brazil
- 11.5.2 Mexico
- 11.5.3 Argentina
- 11.6 MEA
- 11.6.1 South Africa
- 11.6.2 Saudi Arabia
- 11.6.3 UAE
- 11.6.4 Turkey
Chapter 12 Company Profiles
- 12.1 Global Players
- 12.1.1 Accell
- 12.1.2 Bosch eBike Systems
- 12.1.3 BYD Company
- 12.1.4 CATL (Contemporary Amperex Technology)
- 12.1.5 Energica Motor Company
- 12.1.6 NIU Technologies
- 12.1.7 Proterra
- 12.1.8 Segway Ninebot
- 12.1.9 Yadea
- 12.1.10 Zero Motorcycles
- 12.2 Regional Players
- 12.2.1 Giant Manufacturing
- 12.2.2 Harley-Davidson
- 12.2.3 Nova Bus
- 12.2.4 Stromer
- 12.2.5 Gazelle
- 12.2.6 Tern Bicycles
- 12.2.7 Gogoro
- 12.2.8 Ather Energy
- 12.2.9 Hero Motorcorp
- 12.2.10 Piaggio
- 12.3 Emerging Technology Innovators
- 12.3.1 Lime
- 12.3.2 Aventon Bikes
- 12.3.3 Tier Mobility
- 12.3.4 BMW Motorrad
- 12.3.5 Yamaha Motor
