
|
시장보고서
상품코드
1913282
볼 밸브 시장 : 기회, 성장 요인, 업계 동향 분석, 예측(2026-2035년)Ball Valve Market Opportunity, Growth Drivers, Industry Trend Analysis, and Forecast 2026 - 2035 |
||||||
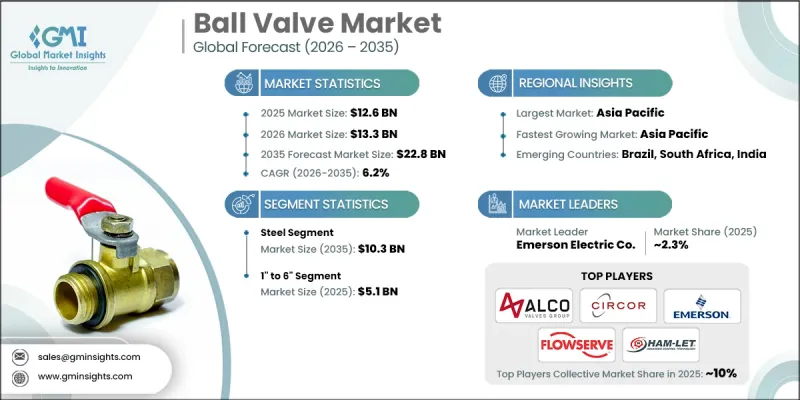
세계의 볼 밸브 시장은 2025년에 126억 달러로 평가되었으며, 2035년까지 연평균 복합 성장률(CAGR) 6.2%로 성장하고 228억 달러에 이를 것으로 예측됩니다.

에너지 안보에 대한 우려 증가와 노후화된 파이프라인 네트워크의 대규모 리노베이션이 세계 수요를 지속적으로 지원하고 있습니다. 볼 밸브는 유량 차단 및 신속한 차단 기능에 중요한 역할을 하며 에너지 수송 인프라 전체에서 필수적인 구성 요소가 되고 있습니다. 환경 보호 및 운영 안전에 중점을 둔 규제 감독의 강화는 특히 고급 유량 제어 솔루션을 필요로 하는 신규 및 업데이트 파이프라인 설비에서 채택을 촉진하고 있습니다. 세계 에너지 소비량이 증가함에 따라 아시아태평양과 중동 등 성장 현저한 지역의 인프라 투자가 확대되어 시장 수요를 더욱 가속화하고 있습니다. 제조업체 각 회사는 내구성과 신뢰성을 갖춘 밸브 기술이 필요한 파이프라인, 처리 시설, 송전 시스템에 장기적인 설비 투자의 혜택을 받고 있습니다. 안전 요건, 인프라 현대화, 확대하는 에너지 네트워크가 함께 시장의 지속적인 성장을 지원하는 안정적인 기반을 형성하고 있습니다.
| 시장 범위 | |
|---|---|
| 시작 연도 | 2025년 |
| 예측 연도 | 2026-2035년 |
| 시작 금액 | 126억 달러 |
| 예측 금액 | 228억 달러 |
| CAGR | 6.2% |
강철 볼 밸브 부문은 2025년에 56억 달러 시장 규모를 기록했으며 2035년까지 103억 달러에 이를 것으로 예측됩니다. 뛰어난 기계적 성능, 내구성, 극한의 압력 및 온도 조건에 대한 내성으로 인해 안전성과 신뢰성이 필수적인 중요한 산업용 응용 분야에서 강철은 선호되는 재료입니다.
1인치에서 6인치 사이즈의 볼 밸브 부문은 2025년 51억 달러를 차지하며 40.9%의 점유율을 차지합니다. 이 크기 범위는 중간 수준의 유량 시스템에 적합하며 광범위한 산업 및 상업시설에서 용량과 효율의 최적 균형을 제공하기 위해 주류가되었습니다.
미국 볼 밸브 시장은 2025년에 22억 달러에 이르고, 2026년부터 2035년까지 연평균 복합 성장률(CAGR) 4.5%를 보일 것으로 예측됩니다. 에너지 공급 체인 전체에서의 활발한 생산 활동과 고도의 안전 밸브에 대한 규제 요건이 전국적으로 고성능 볼 밸브 수요를 계속 견인하고 있습니다.
자주 묻는 질문
목차
제1장 조사 방법과 범위
제2장 주요 요약
제3장 업계 인사이트
- 생태계 분석
- 공급업체 현황
- 수익률
- 단계별 부가가치
- 밸류체인에 영향을 주는 요인
- 업계에 미치는 영향요인
- 성장 촉진요인
- 업계의 잠재적 위험 및 과제
- 기회
- 성장 가능성 분석
- 향후 시장 동향
- 가격 동향
- 원재료 비용
- 원재료 공급에 있어서의 실태와 인식 차이
- 공급업체 가격 상승 검증
- 규제 프레임워크
- 지역별
- 무역 통계
- 주요 수입국
- 주요 수출국
- Porter's Five Forces 분석
- PESTEL 분석
제4장 경쟁 구도
- 소개
- 기업의 시장 점유율 분석
- 지역별
- 기업 매트릭스 분석
- 주요 시장 기업의 경쟁 분석
- 경쟁 포지셔닝 매트릭스
- 제품 포트폴리오 벤치마크
- 주요 발전
- 합병 및 인수
- 제휴 및 협업
- 신제품 발매
- 확대 계획
제5장 시장 추정 및 예측 : 재료별, 2022-2035
- 강철
- 플라스틱
- 주철
- 합금
- 기타(청동 및 황동)
제6장 시장 추정 및 예측 : 컴포넌트별, 2022-2035
- 액추에이터
- 밸브 본체
- 기타(포지셔너 및 I/P 컨버터)
제7장 시장 추정 및 예측 : 규모별, 2022-2035
- <1"
- 1" to 6"
- 7" to 25"
- 26" to 50"
- >50"
제8장 시장 추정 및 예측 : 최종 용도별, 2022-2035
- 화학제품
- 에너지 및 유틸리티
- 건설
- 금속 및 광업
- 농업
- 의약품
- 식음료
- 펄프 및 종이
- 기타(섬유, 유리, 반도체)
제9장 시장 추정 및 예측 : 유통채널별, 2022-2035
- 직접 판매
- 간접 판매
제10장 시장 추정 및 예측 : 지역별, 2022-2035
- 북미
- 미국
- 캐나다
- 유럽
- 독일
- 영국
- 프랑스
- 이탈리아
- 스페인
- 아시아태평양
- 중국
- 인도
- 일본
- 한국
- 호주
- 라틴아메리카
- 브라질
- 멕시코
- 아르헨티나
- 중동 및 아프리카
- 아랍에미리트(UAE)
- 사우디아라비아
- 남아프리카
제11장 기업 프로파일
- Alco Valves Group
- Circor International
- Emerson Electric Co
- Flowserve Corporation
- HAM-LET Group
- Haskel International, Inc
- Hex Valve
- HOKE
- HY-LOK Corporation
- KITZ Corporation
- Maximator GmbH
- Oliver Valves Ltd
- Parker Hannifin
- SMC Corporation
- Swagelok Company
The Global Ball Valve Market was valued at USD 12.6 billion in 2025 and is estimated to grow at a CAGR of 6.2% to reach USD 22.8 billion by 2035.
Rising concerns around energy security and the large-scale refurbishment of aging pipeline networks continue to support demand worldwide. Ball valves play a critical role in flow isolation and rapid shutoff functions, making them essential components across energy transportation infrastructure. Increasing regulatory oversight focused on environmental protection and operational safety strengthens adoption, particularly for new and replacement pipeline installations that require advanced flow control solutions. As global energy consumption continues to rise, infrastructure investments expand across high-growth regions, including the Asia Pacific and the Middle East, further accelerating market demand. Manufacturers benefit from long-term capital spending on pipelines, processing facilities, and transmission systems that require durable and reliable valve technologies. The combination of safety requirements, infrastructure modernization, and expanding energy networks creates a stable foundation for continued market growth.
| Market Scope | |
|---|---|
| Start Year | 2025 |
| Forecast Year | 2026-2035 |
| Start Value | $12.6 Billion |
| Forecast Value | $22.8 Billion |
| CAGR | 6.2% |
The steel-based ball valves segment generated USD 5.6 billion in 2025 and is projected to reach USD 10.3 billion by 2035. Strong mechanical performance, durability, and resistance to extreme pressure and temperature conditions make steel the preferred material across critical industrial applications where safety and reliability remain essential.
The ball valves sized between 1 inch and 6 inches segment accounted for USD 5.1 billion in 2025 and represent 40.9% share. This size range dominates due to its suitability for moderate flow systems, offering an optimal balance between capacity and efficiency across a wide range of industrial and commercial installations.
U.S. Ball Valve Market reached USD 2.2 billion in 2025 and is expected to grow at a CAGR of 4.5% from 2026 to 2035. Strong production activity across energy supply chains and regulatory requirements for advanced safety valves continue to drive demand for high-performance ball valves nationwide.
Leading companies operating in the Global Ball Valve Market include Flowserve Corporation, Emerson Electric Co, Swagelok Company, Parker Hannifin, KITZ Corporation, Circor International, SMC Corporation, Oliver Valves Ltd, HY-LOK Corporation, HOKE, Alco Valves Group, Maximator GmbH, HAM-LET Group, Hex Valve, and Haskel International, Inc. Companies strengthen their position in the Ball Valve Market through continuous product innovation, material optimization, and compliance-focused engineering. Many manufacturers invest in advanced sealing technologies and precision manufacturing to improve performance in demanding environments. Expanding regional production capabilities helps reduce lead times and improve supply reliability. Strategic partnerships with infrastructure developers and energy operators support long-term contract visibility. Firms also emphasize certification readiness, quality assurance, and lifecycle service offerings to enhance customer trust.
Table of Contents
Chapter 1 Methodology & Scope
- 1.1 Market scope and definition
- 1.2 Research design
- 1.2.1 Research approach
- 1.2.2 Data collection methods
- 1.3 Data mining sources
- 1.3.1 Global
- 1.3.2 Regional/Country
- 1.4 Base estimates and calculations
- 1.4.1 Base year calculation
- 1.4.2 Key trends for market estimation
- 1.5 Primary research and validation
- 1.5.1 Primary sources
- 1.6 Forecast model
- 1.7 Research assumptions and limitations
Chapter 2 Executive Summary
- 2.1 Industry 3600 synopsis
- 2.2 Key market trends
- 2.2.1 Regional trends
- 2.2.2 Material trends
- 2.2.3 Component trends
- 2.2.4 Size trends
- 2.2.5 End use trends
- 2.2.6 Distribution channel trends
- 2.3 CXO perspective: Strategic imperatives
- 2.3.1 Key decision points for industry executives
- 2.3.2 Critical success factors for market players
- 2.4 Future outlook and strategic recommendations
- 2.5 Strategic recommendations
- 2.5.1 Supply chain diversification strategy
- 2.5.2 Product portfolio enhancement
- 2.5.3 Partnership and alliance opportunities
- 2.5.4 Cost management and pricing strategy
- 2.6 Decision framework
- 2.6.1 Investment priority matrix
- 2.6.2 ROI analysis
Chapter 3 Industry Insights
- 3.1 Industry ecosystem analysis
- 3.1.1 Supplier Landscape
- 3.1.2 Profit Margin
- 3.1.3 Value addition at each stage
- 3.1.4 Factor affecting the value chain
- 3.2 Industry impact forces
- 3.2.1 Growth drivers
- 3.2.2 Industry pitfalls & challenges
- 3.2.3 Opportunities
- 3.3 Growth potential analysis
- 3.4 Future market trends
- 3.5 Price trends
- 3.5.1 Raw material cost
- 3.5.2 Real vs. perceived capacity constraints in supply of raw materials
- 3.5.3 Supplier price increase validation
- 3.6 Regulatory framework
- 3.6.1 By region
- 3.7 Trade statistics
- 3.7.1 Major importing countries
- 3.7.2 Major exporting countries
- 3.8 Porter's five forces analysis
- 3.9 PESTEL analysis
Chapter 4 Competitive Landscape, 2025
- 4.1 Introduction
- 4.2 Company market share analysis
- 4.2.1 By Region
- 4.3 Company matrix analysis
- 4.4 Competitive analysis of major market players
- 4.5 Competitive positioning matrix
- 4.6 Product portfolio benchmarking
- 4.7 Key developments
- 4.7.1 Mergers & acquisitions
- 4.7.2 Partnerships & collaborations
- 4.7.3 New Product Launches
- 4.7.4 Expansion Plans
Chapter 5 Market Estimates & Forecast, By Material, 2022 - 2035 (USD Billion) (Million Units)
- 5.1 Key trends
- 5.2 Steel
- 5.3 Plastic
- 5.4 Cast Iron
- 5.5 Alloy Based
- 5.6 Others (Bronze and Brass)
Chapter 6 Market Estimates & Forecast, By Component, 2022 - 2035 (USD Billion) (Million Units)
- 6.1 Key trends
- 6.2 Actuators
- 6.3 Valve Body
- 6.4 Others (Positioners and I/P Converters)
Chapter 7 Market Estimates & Forecast, By Size, 2022 - 2035 (USD Billion) (Million Units)
- 7.1 Key trends
- 7.2 <1"
- 7.3 1" to 6"
- 7.4 7" to 25"
- 7.5 26" to 50"
- 7.6 >50"
Chapter 8 Market Estimates & Forecast, By End Use, 2022 - 2035 (USD Billion) (Million Units)
- 8.1 Key trends
- 8.2 Chemical
- 8.3 Energy & utilities
- 8.4 Construction
- 8.5 Metal & mining
- 8.6 Agriculture
- 8.7 Pharmaceutical
- 8.8 Food & beverage
- 8.9 Pulp & paper
- 8.10 Others (textile, glass, and semiconductor)
Chapter 9 Market Estimates & Forecast, By Distribution Channel, 2022 - 2035, (USD Billion) (Million Units)
- 9.1 Key trends
- 9.2 Direct
- 9.3 Indirect
Chapter 10 Market Estimates & Forecast, By Region, 2022 - 2035, (USD Billion) (Million Units)
- 10.1 Key trends
- 10.2 North America
- 10.2.1 U.S.
- 10.2.2 Canada
- 10.3 Europe
- 10.3.1 Germany
- 10.3.2 U.K.
- 10.3.3 France
- 10.3.4 Italy
- 10.3.5 Spain
- 10.4 Asia Pacific
- 10.4.1 China
- 10.4.2 India
- 10.4.3 Japan
- 10.4.4 South Korea
- 10.4.5 Australia
- 10.5 Latin America
- 10.5.1 Brazil
- 10.5.2 Mexico
- 10.5.3 Argentina
- 10.6 MEA
- 10.6.1 UAE
- 10.6.2 Saudi Arabia
- 10.6.3 South Africa
Chapter 11 Company Profiles (Business Overview, Financial Data, Product Landscape, Strategic Outlook, SWOT Analysis)
- 11.1 Alco Valves Group
- 11.2 Circor International
- 11.3 Emerson Electric Co
- 11.4 Flowserve Corporation
- 11.5 HAM-LET Group
- 11.6 Haskel International, Inc
- 11.7 Hex Valve
- 11.8 HOKE
- 11.9 HY-LOK Corporation
- 11.10 KITZ Corporation
- 11.11 Maximator GmbH
- 11.12 Oliver Valves Ltd
- 11.13 Parker Hannifin
- 11.14 SMC Corporation
- 11.15 Swagelok Company
