


|
시장보고서
상품코드
1913359
해양 에너지 시장 : 시장 기회, 성장 요인, 산업 동향 분석 및 예측(2026-2035년)Marine Energy Market Opportunity, Growth Drivers, Industry Trend Analysis, and Forecast 2026 - 2035 |
||||||
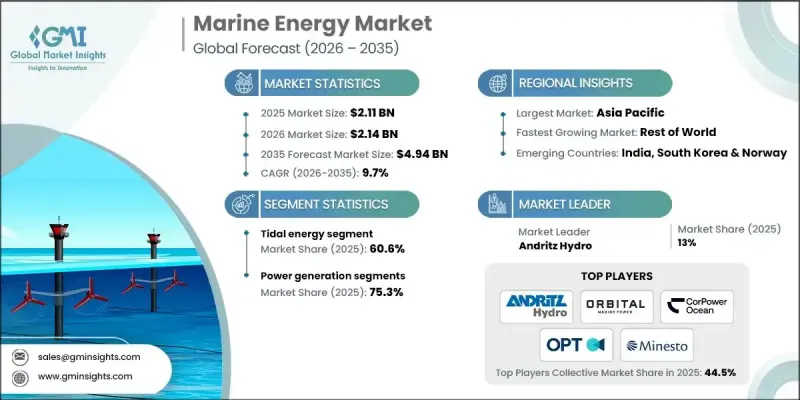
세계의 해양 에너지 시장은 2025년에 21억 1,000만 달러로 평가되었고, 2035년까지 연평균 복합 성장률(CAGR) 9.7%로 성장할 전망이며, 49억 4,000만 달러에 이를 것으로 예측됩니다.
시장 성장은 해양 기반 신재생 에너지 시스템의 조사, 조종사 도입 및 조기 상업화를 촉진하는 공공 부문의 자금 조달 메커니즘 증가에 의해 지원됩니다. 해양 에너지란 조수 운동, 파동, 해류, 온도차 등의 해양 자원으로부터 발전되는 전력을 말하며, 종래의 에너지원을 대신하는 지속가능한 선택을 제공합니다. 이 시스템은 해수의 운동 에너지 및 열 에너지를 배출량을 최소화하면서 사용 가능한 전력으로 변환합니다. 해양 에너지는 예측 가능성, 긴 가동 수명 및 탈탄소화 목표에 대한 기여도로부터 점점 더 높은 평가를 받고 있습니다. 환경 부하가 낮은 신재생 에너지 솔루션에 대한 관심 증가는 수요를 지속적으로 강화하고 있습니다. 또한 안정적인 출력 및 기후 변화에 대한 내성을 제공하는 에너지원의 필요성도 시장에 몰입하고 있습니다. 해양 에너지 프로젝트를 기존 해상 신재생 에너지 인프라와 통합하면 비용 효율성 및 계통 연결성이 향상됩니다. 하이브리드 재생에너지 구성은 가동률을 높이고 중단 없는 전력 공급을 지원함으로써 다양한 청정 전력 포트폴리오에서 해양 에너지의 장기적인 역할을 강화합니다.
| 시장 범위 | |
|---|---|
| 시작 연도 | 2025년 |
| 예측 연도 | 2026-2035년 |
| 시작 시 가치 | 21억 1,000만 달러 |
| 예측 금액 | 49억 4,000만 달러 |
| CAGR | 9.7% |
염분 농도 구배 발전 부문은 2035년까지 5억 달러에 달할 것으로 예측됩니다. 첨단 멤브레인 개발에 대한 투자 증가로 에너지 전환 효율이 향상되는 동시에 시스템 비용이 절감되고, 상업화 준비가 촉진되며, 적절한 수자원을 가진 지역에서의 광범위한 도입이 지원됩니다.
해양 에너지를 이용한 해수 담수화 용도 분야는 2035년까지 연평균 복합 성장률(CAGR) 10.7%로 성장할 것으로 전망됩니다. 해안 지역 및 섬도부의 담수 수요 증가로 운영비 절감, 에너지 효율 향상, 장기적인 수자원 안보를 지원하는 깨끗한 전력 솔루션에 대한 관심이 높아지고 있습니다.
미국의 해양 에너지 시장은 2025년 89.9%의 점유율을 차지했으며, 2035년까지 2억 달러 규모로 성장할 것으로 예측됩니다. 강력한 신재생 에너지 목표, 기관 투자자들의 관심 증가, 민간 투자 증가가 지역의 주도적 입장 및 장기적인 시장 가능성을 지속적으로 강화하고 있습니다.
자주 묻는 질문
목차
제1장 조사 방법 및 범위
제2장 주요 요약
제3장 업계 인사이트
- 업계의 생태계
- 원재료 가용성 및 조달 분석
- 제조 능력 평가
- 공급망의 회복력 및 리스크 요인
- 유통 네트워크 분석
- 규제 상황
- 업계에 미치는 영향요인
- 성장 촉진요인
- 업계의 잠재적 위험 및 과제
- 성장 가능성 분석
- 비용 구조 분석
- Porter's Five Forces 분석
- PESTEL 분석
- 새로운 기회 및 동향
- 디지털화 및 IoT 통합
- 신흥 시장 진출
- 투자 분석 및 전망
제4장 경쟁 구도
- 서문
- 기업의 시장 점유율 분석 : 지역별
- 북미
- 유럽
- 아시아태평양
- 세계 기타 지역
- 전략적 대시보드
- 전략적 노력
- 기업 벤치마킹
- 혁신 및 기술 동향
제5장 시장 규모 및 예측 : 유형별(2022-2035년)
- 파력 에너지
- 조수 에너지
- 해양 열에너지 변환(OTEC)
- 염분 농도 구배 발전(SGP)
제6장 시장 규모 및 예측 : 용도별(2022-2035년)
- 발전
- 해수담수화
- 기타
제7장 시장 규모 및 예측 : 지역별(2022-2035년)
- 북미
- 미국
- 캐나다
- 유럽
- 프랑스
- 스페인
- 영국
- 노르웨이
- 아시아태평양
- 중국
- 인도
- 한국
- 세계 기타 지역
제8장 기업 프로파일
- Andritz Hydro
- AWS Ocean Energy
- BioPower Systems
- Carnegie Clean Energy
- CorPower Ocean
- Eco Wave Power
- Havkraft AS
- Marine Energy Group
- Minesto
- Mocean Energy
- Nova Innovations
- Ocean Power Technologies(OPT)
- Ocean Renewable Power Company
- Orbital Marine Power
- Oscilla Power
- Sabella SAS
- Seabased AB
- SINN Power
- SSE Renewables
- Verdant Power
The Global Marine Energy Market was valued at USD 2.11 billion in 2025 and is estimated to grow at a CAGR of 9.7% to reach USD 4.94 billion by 2035.

Market growth is supported by rising public-sector funding mechanisms that encourage research, pilot deployment, and early commercialization of ocean-based renewable power systems. Marine energy represents electricity generated from ocean resources such as tidal movements, wave motion, water currents, and thermal differences, offering a sustainable alternative to conventional energy sources. These systems convert the kinetic and thermal potential of seawater into usable power with minimal emissions. Marine energy is increasingly valued for its predictability, long operating life, and contribution to decarbonization goals. Growing interest in renewable solutions with lower environmental impact continues to strengthen demand. The market also benefits from the need for energy sources that provide stable output and resilience against climate variability. Integration of marine energy projects with existing offshore renewable infrastructure improves cost efficiency and grid connectivity. Hybrid renewable configurations further enhance utilization rates and support uninterrupted electricity generation, reinforcing the long-term role of marine energy within diversified clean power portfolios.
| Market Scope | |
|---|---|
| Start Year | 2025 |
| Forecast Year | 2026-2035 |
| Start Value | $2.11 Billion |
| Forecast Value | $4.94 Billion |
| CAGR | 9.7% |
The salinity gradient power segment is projected to reach USD 500 million by 2035. Increased investment in advanced membrane development improves energy conversion efficiency while reducing system costs, which enhances commercial readiness and supports wider deployment in regions with suitable water resources.
The marine energy-powered desalination applications segment will grow at a CAGR of 10.7% through 2035. Rising freshwater demand in coastal and island regions accelerates interest in clean power solutions that reduce operating costs, improve energy efficiency, and support long-term water security.
U.S. Marine Energy Market held 89.9% share in 2025 and is expected to generate USD 200 million by 2035. Strong renewable energy targets, growing institutional interest, and increasing private investment continue to reinforce regional leadership and long-term market potential.
Key companies active in the Global Marine Energy Market include Orbital Marine Power, Ocean Power Technologies, Carnegie Clean Energy, Verdant Power, Andritz Hydro, Minesto, SSE Renewables, CorPower Ocean, SINN Power, Mocean Energy, Nova Innovations, Sabella SAS, Seabased AB, Oscilla Power, Havkraft AS, BioPower Systems, Eco Wave Power, Marine Energy Group, AWS Ocean Energy, and Ocean Renewable Power Company. Companies strengthen their position by prioritizing technology optimization, cost reduction, and scalable project development. Many players focus on improving device durability and energy efficiency to enhance long-term performance in harsh marine environments. Strategic partnerships with utilities, infrastructure developers, and research institutions support faster commercialization and risk sharing. Firms also emphasize modular designs and standardized components to simplify deployment and maintenance.
Table of Contents
Chapter 1 Methodology & Scope
- 1.1 Research design
- 1.1.1 Research approach
- 1.1.2 Data collection methods
- 1.2 Base estimates and calculations
- 1.2.1 Base year calculation
- 1.2.2 Market estimates & forecast parameters
- 1.3 Forecast
- 1.3.1 Key trends for market estimates
- 1.3.1.1 Quantified market impact analysis
- 1.3.2 Mathematical impact of growth parameters on forecast
- 1.3.3 Scenario analysis framework
- 1.3.1 Key trends for market estimates
- 1.4 Primary research and validation
- 1.4.1 Some of the primary sources (but not limited to)
- 1.5 Data mining sources
- 1.5.1 Paid Sources
- 1.5.2 Sources, by region
- 1.6 Research trail & scoring components
- 1.6.1 Research trail components
- 1.6.2 Scoring components
- 1.7 Research transparency addendum
- 1.7.1 Source attribution framework
- 1.7.2 Quality assurance metrics
- 1.7.3 Our commitment to trust
- 1.8 Market definitions
Chapter 2 Executive Summary
- 2.1 Industry synopsis, 2022 - 2035
- 2.2 Business trends
- 2.3 Type trends
- 2.4 Application trends
- 2.5 Regional trends
Chapter 3 Industry Insights
- 3.1 Industry ecosystem
- 3.1.1 Raw material availability & sourcing analysis
- 3.1.2 Manufacturing capacity assessment
- 3.1.3 Supply chain resilience & risk factors
- 3.1.4 Distribution network analysis
- 3.2 Regulatory landscape
- 3.3 Industry impact forces
- 3.3.1 Growth drivers
- 3.3.2 Industry pitfalls & challenges
- 3.4 Growth potential analysis
- 3.5 Cost structure analysis
- 3.6 Porter's analysis
- 3.6.1 Bargaining power of suppliers
- 3.6.2 Bargaining power of buyers
- 3.6.3 Threat of new entrants
- 3.6.4 Threat of substitutes
- 3.7 PESTEL analysis
- 3.7.1 Political factors
- 3.7.2 Economic factors
- 3.7.3 Social factors
- 3.7.4 Technological factors
- 3.7.5 Legal factors
- 3.7.6 Environmental factors
- 3.8 Emerging opportunities & trends
- 3.8.1 Digitalization & IoT integration
- 3.8.2 Emerging market penetration
- 3.9 Investment analysis and future outlook
Chapter 4 Competitive landscape, 2025
- 4.1 Introduction
- 4.2 Company market share analysis, by region, 2025
- 4.2.1 North America
- 4.2.2 Europe
- 4.2.3 Asia Pacific
- 4.2.4 Rest of World
- 4.3 Strategic dashboard
- 4.4 Strategic initiatives
- 4.5 Company benchmarking
- 4.6 Innovation & technology landscape
Chapter 5 Market Size and Forecast, By Type, 2022 - 2035 (USD Million & MW)
- 5.1 Key trends
- 5.2 Wave energy
- 5.3 Tidal energy
- 5.4 Ocean thermal energy conversion (OTEC)
- 5.5 Salinity gradient power (SGP)
Chapter 6 Market Size and Forecast, By Application, 2022 - 2035 (USD Million & MW)
- 6.1 Key trends
- 6.2 Power generation
- 6.3 Desalination
- 6.4 Others
Chapter 7 Market Size and Forecast, By Region, 2022 - 2035 (USD Million & MW)
- 7.1 Key trends
- 7.2 North America
- 7.2.1 U.S.
- 7.2.2 Canada
- 7.3 Europe
- 7.3.1 France
- 7.3.2 Spain
- 7.3.3 UK
- 7.3.4 Norway
- 7.4 Asia Pacific
- 7.4.1 China
- 7.4.2 India
- 7.4.3 South Korea
- 7.5 Rest of World
Chapter 8 Company Profiles
- 8.1 Andritz Hydro
- 8.2 AWS Ocean Energy
- 8.3 BioPower Systems
- 8.4 Carnegie Clean Energy
- 8.5 CorPower Ocean
- 8.6 Eco Wave Power
- 8.7 Havkraft AS
- 8.8 Marine Energy Group
- 8.9 Minesto
- 8.10 Mocean Energy
- 8.11 Nova Innovations
- 8.12 Ocean Power Technologies (OPT)
- 8.13 Ocean Renewable Power Company
- 8.14 Orbital Marine Power
- 8.15 Oscilla Power
- 8.16 Sabella SAS
- 8.17 Seabased AB
- 8.18 SINN Power
- 8.19 SSE Renewables
- 8.20 Verdant Power
