
|
시장보고서
상품코드
1928911
선박용 레이더 시장 기회, 성장요인, 업계 동향 분석 및 예측(2026-2035년)Marine Radar Market Opportunity, Growth Drivers, Industry Trend Analysis, and Forecast 2026 - 2035 |
||||||
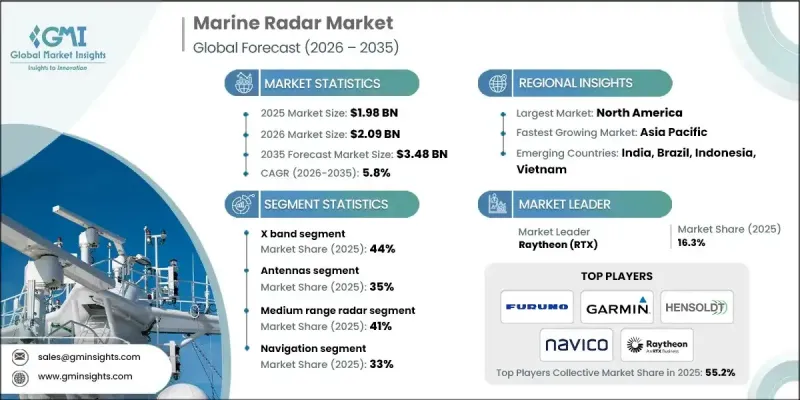
세계의 선박용 레이더 시장은 2025년에 19억 8,000만 달러로 평가되었고, 2035년까지 연평균 복합 성장률(CAGR) 5.8%로 성장하여 34억 8,000만 달러에 이를 것으로 예측됩니다.

해상 무역량이 증가하고 선박의 혼잡도가 높아짐에 따라 신뢰할 수 있는 항해 및 감시 시스템의 필요성이 높아지고 있습니다. 교통량이 많은 수로에서 해양 사고에 대한 경각심이 높아지면서 첨단 레이더 솔루션에 대한 투자가 확대되고 있습니다. 레이더 기술의 지속적인 혁신으로 갱신 주기가 가속화되는 한편, 노후화된 상용 및 방산 함대가 교체 수요를 주도하고 있습니다. 솔리드 스테이트 트레이더 솔루션은 내구성, 작동 안정성 및 유지보수 수요 감소로 인해 점점 더 많은 사랑을 받고 있습니다. 선박 레이더 시스템은 현재 상황 인식을 향상시키기 위해 전자해도 플랫폼 및 선박 식별 기술과의 통합이 더욱 빈번하게 이루어지고 있습니다. 선박 교통 모니터링 서비스의 확대는 해안 및 육상 기반 레이더 설치에 대한 수요를 뒷받침하고 있습니다. 시야 불량 시 항해 정확도에 대한 관심이 높아짐에 따라 레이더 성능 기준이 더욱 향상되고 있습니다. 함대 현대화 이니셔티브도 레이더 교체에 대한 지속적인 수요에 기여하고 있습니다.
| 시장 범위 | |
|---|---|
| 개시 연도 | 2025년 |
| 예측 연도 | 2026-2035년 |
| 개시 연도 가치 | 19억 8,000만 달러 |
| 예측 금액 | 34억 8,000만 달러 |
| CAGR | 5.8% |
X-band 부문은 2025년 44%의 점유율을 차지할 것으로 예상되며, 2026년부터 2035년까지 연평균 복합 성장률(CAGR) 5.3%를 나타낼 것으로 예측됩니다. 이러한 시스템은 단거리에서 중거리의 항행 지원, 충돌 회피, 운영 제어에 널리 활용되고 있습니다. 국제 해사 규정에 따라 총톤수 300톤 이상 선박에 레이더 설치가 의무화되면서 이 부문 수요가 증가하고 있습니다.
안테나 부문은 2025년 35% 점유율을 차지할 것으로 예상되며, 2035년까지 연평균 복합 성장률(CAGR) 5.3%로 성장할 것으로 전망됩니다. 성능 정확도, 감지 범위, 해상도는 상업용 선단 및 어선대에서 안테나의 품질에 크게 의존하기 때문에 안테나는 레이더 유지보수 비용의 대부분을 차지합니다.
미국 해양 레이더 시장은 2025년 88%의 점유율을 차지하며 5억 7,450만 달러에 달할 것으로 예측됩니다. 상업용 선박, 해군 작전 및 레저용 보트에서 높은 채택률과 더불어 엄격한 해상 안전 기준과 밀집된 해안 교통량이 결합되어 현대식 레이더 시스템에 대한 지속적인 수요를 뒷받침하고 있습니다.
자주 묻는 질문
목차
제1장 조사 방법
제2장 주요 요약
제3장 업계 인사이트
- 생태계 분석
- 공급업체 상황
- 이익률 분석
- 비용 구조
- 각 단계 부가가치
- 밸류체인에 영향을 미치는 요인
- 파괴적 변화
- 업계에 대한 영향요인
- 성장 촉진요인
- 세계 해운 무역 성장
- 보다 엄격한 해상 안전 규제
- 연안 수역 및 항만 수역 교통 정체 증가
- 기술 업그레이드와 디지털 통합
- 업계의 잠재적 리스크&과제
- 높은 설치 및 유지보수 비용
- 혼잡 해역 신호 간섭과 쿠랏타
- 시장 기회
- 노후화 하는 세계의 선대로부터 개보수 수요
- 해상 풍력 및 해상 에너지 프로젝트 확대
- 솔리드 스테이트 및 디지털 레이더 채택 동향
- 성장 가능성 분석
- 규제 상황
- 북미
- 미국 연안경비대(USCG) 레이더 탑재 및 관측 요원 요건
- 미국 연안경비대(USCG)에 의한 46 CFR에 근거한 레이더 장비 승인
- 연방 통신 위원회(FCC) 레이더 인증 기준
- 캐나다 운송 성 해양 레이더 적합 가이드라인
- 유럽
- 유럽 해상 안전청(EMSA) 감독과 시행
- 선박용 기기 지침(MED) 형 식 승인 요건
- EU기국 및 항만국 관리에 의한 레이더 검사
- 레이더 장비에 관한 조화된 유럽 규격(EN)
- 아시아태평양
- 중국 선급 협회(CCS) 레이더 형 식 승인 기준
- 인도 해운총국 레이더 적합 규칙
- 국토 교통성 레이더 규제
- 한국 해사국(KR) 레이더 요건
- ASEAN 지역 해상 안전 및 레이더 조화 가이드라인
- 라틴아메리카
- 브라질 해사국(ANTAQ) 레이더 장비 기준
- 아르헨티나 연안경비대 레이더 적합 규제
- 멕시코 해군·운송 성 레이더 규칙
- 지역별 SOLAS 시행 상황과 기국 관리
- 중동 및 아프리카
- 아랍에미리트 연방 운송 국 해사 레이더 기준
- 사우디아라비아 항만청 레이더 요건
- 남아프리카공화국 해사 안전청(SAMSA) 규제
- 지역별 국제 해사 기관(IMO) 및 국제 전기표준회의(IEC) 레이더 성능 기준 채택 상황
- 북미
- Porter의 Five Forces 분석
- PESTEL 분석
- 기술과 혁신 동향
- 현재 기술 동향
- 신기술
- 가격 동향
- 지역별
- 제품별
- 생산 통계
- 생산 거점
- 소비 허브
- 수출과 수입
- 비용 내역 분석
- 레이더 시스템 취득 비용
- 설치 및 통합 비용
- 운영 및 유지보수 비용
- 소프트웨어 업그레이드 및 캘리브레이션 비용
- 규제 인증 및 형 식 승인 비용
- 훈련 및 승무원 익숙 비용
- 특허 분석
- 지속가능성과 환경면
- 지속가능한 실천
- 폐기물 감축 전략
- 생산 에너지 효율
- 환경 배려형 구상
- 탄소발자국에 관한 고려사항
- 선박용 레이더 시스템 아키텍처 및 통합 프레임워크
- 스탠드얼론형과 통합 브릿지 시스템(IBS) 비교
- ECDIS, AIS, ARPA, INS와의 레이더 통합
- 오픈형과 프로프라이어터리 형 항법 시스템 아키텍처
- 센서 융합 환경 레이더 역할
- OEM 차별화와 기술 포지셔닝 요인
- 감지 거리, 분해가능 및 쿠랏타 억제 벤치마크
- 솔리드 스테이트 레이더와 마그네트론 레이더 차별화
- 소프트웨어 정의 레이더 기능
- 신뢰성, maen time between failure(MTBF) 및 수명주기 성능 지표
- RETROFIT와 신규 건조 배 수요 동향
- SOLAS, IMO 및 해군 조달 기준 영향
제4장 경쟁 구도
- 서론
- 기업의 시장 점유율 분석
- 북미
- 유럽
- 아시아태평양
- 라틴아메리카
- 중동 및 아프리카
- 주요 시장 기업의 경쟁 분석
- 경쟁 포지셔닝 매트릭스
- 전략적 전망 매트릭스
- 주요 발전
- 인수합병(M&A)
- 제휴 및 협업
- 신제품 발매
- 사업 확대 계획과 자금조달
제5장 시장 추산·예측 : 레이더별, 2022-2035
- X-band
- S-band
- C-band 레이더
- 기타
제6장 시장 추산·예측 : 컴포넌트별, 2022-2035
- 송신기
- 안테나
- 수신기
- 프로세서
- 디스플레이
- 기타
제7장 시장 추산·예측 : 범위별, 2022-2035
- 단거리 레이더(1-20 해리)
- 중거리 레이더(20-50 해리)
- 장거리 레이더(50-100 해리 이상)
제8장 시장 추산·예측 : 용도별, 2022-2035
- 내비게이션
- 충돌 회피
- 감시·보안
- 어업 활동
- 연안 교통 모니터링
- 기상 감시
- 기타
제9장 시장 추산·예측 : 최종 용도별, 2022-2035
- 상용 선박
- 해군 및 방위/군용 선박
- 레크리에이션용 보트/요트
- 개인 소유 보트 소유자
- 어선
- 기타
제10장 시장 추산·예측 : 지역별, 2022-2035
- 북미
- 미국
- 캐나다
- 유럽
- 독일
- 영국
- 프랑스
- 이탈리아
- 스페인
- 러시아
- 북유럽 국가
- 네덜란드
- 스웨덴
- 아시아태평양
- 중국
- 인도
- 일본
- 호주
- 한국
- 싱가포르
- 태국
- 인도네시아
- 베트남
- 라틴아메리카
- 브라질
- 멕시코
- 아르헨티나
- 중동 및 아프리카
- 남아프리카공화국
- 사우디아라비아
- 아랍에미리트
- 튀르키예
제11장 기업 개요
- 세계 기업
- BAE Systems
- Furuno Electric
- Garmin
- Hensoldt
- Kongsberg Gruppen
- Leonardo
- Lockheed Martin
- Navico
- Northrop Grumman
- Raymarine
- Raytheon RTX
- Saab
- Sperry Marine
- Teledyne FLIR
- Thales
- 지역 기업-
- GEM Elettronica
- JRC Nisshinbo
- Koden Electronics
- Samyung ENC
- TOKIO KEIKI
- 신규 기업/디스럽터
- Alphatron Marine
- Rutter
- Terma
The Global Marine Radar Market was valued at USD 1.98 billion in 2025 and is estimated to grow at a CAGR of 5.8% to reach USD 3.48 billion by 2035.
Rising seaborne trade volumes and growing vessel congestion are increasing the need for reliable navigation and surveillance systems. Heightened awareness around maritime accidents in heavily trafficked waterways is encouraging greater investment in advanced radar solutions. Continuous innovation in radar technology is accelerating upgrade cycles, while aging commercial and defense fleets are driving replacement demand. Solid-state radar solutions are increasingly favored due to their durability, operational stability, and reduced maintenance needs. Marine radar systems are now more frequently integrated with electronic charting platforms and vessel identification technologies to improve situational awareness. Expansion of vessel traffic monitoring services is supporting demand for coastal and shore-based radar installations. Growing focus on navigational accuracy in poor visibility conditions is further improving radar performance standards. Fleet modernization initiatives are also contributing to sustained demand for radar replacements.
| Market Scope | |
|---|---|
| Start Year | 2025 |
| Forecast Year | 2026-2035 |
| Start Value | $1.98 Billion |
| Forecast Value | $3.48 Billion |
| CAGR | 5.8% |
The X-band segment held a 44% share in 2025 and is forecast to grow at a CAGR of 5.3% from 2026 to 2035. These systems are widely used for navigation support, collision avoidance, and operational control over short to medium ranges. International maritime regulations mandate radar installation on vessels exceeding 300 gross tons, reinforcing segment demand.
The antenna segment accounted for 35% share in 2025 and will grow at a CAGR of 5.3% through 2035. Antennas represent a major share of radar maintenance expenditure, as performance accuracy, detection range, and resolution heavily depend on antenna quality across commercial and fishing fleets.
United States Marine Radar Market held an 88% share and reached USD 574.5 million in 2025. High adoption across commercial shipping, naval operations, and recreational boating, combined with strict maritime safety standards and dense coastal traffic, continues to support ongoing demand for modern radar systems.
Key companies operating in the Global Marine Radar Market include Garmin, Furuno Electric, Raytheon RTX, Kongsberg Gruppen, Raymarine, Navico, Hensoldt, Sperry Marine, JRC Nisshinbo, and Terma. Companies in the Marine Radar Market are strengthening their competitive position by investing heavily in solid-state radar innovation and enhanced signal processing capabilities. Strategic product upgrades focused on higher resolution, improved target detection, and seamless system integration are a core priority. Manufacturers are expanding their aftermarket and service offerings to capture recurring revenue from maintenance and replacement cycles. Partnerships with shipbuilders and fleet operators are helping firms secure long-term supply agreements.
Table of Contents
Chapter 1 Methodology
- 1.1 Research approach
- 1.2 Quality Commitments
- 1.2.1 GMI AI policy & data integrity commitment
- 1.2.1.1 Source consistency protocol
- 1.2.1 GMI AI policy & data integrity commitment
- 1.3 Research Trail & Confidence Scoring
- 1.3.1 Research Trail Components
- 1.3.2 Scoring Components
- 1.4 Data Collection
- 1.4.1 Partial list of primary sources
- 1.5 Data mining sources
- 1.5.1 Paid sources
- 1.5.1.1 Sources, by region
- 1.5.1 Paid sources
- 1.6 Base estimates and calculations
- 1.6.1 Base year calculation for any one approach
- 1.7 Forecast model
- 1.7.1 Quantified market impact analysis
- 1.7.1.1 Mathematical impact of growth parameters on forecast
- 1.7.1 Quantified market impact analysis
- 1.8 Research transparency addendum
- 1.8.1 Source attribution framework
- 1.8.2 Quality assurance metrics
- 1.8.3 Our commitment to trust
Chapter 2 Executive Summary
- 2.1 Industry 3600 synopsis, 2022 - 2035
- 2.2 Key market trends
- 2.2.1 Regional
- 2.2.2 Radar
- 2.2.3 Component
- 2.2.4 Range
- 2.2.5 Application
- 2.2.6 End Use
- 2.3 TAM Analysis, 2026-2035
- 2.4 CXO perspectives: Strategic imperatives
- 2.4.1 Executive decision points
- 2.4.2 Critical success factors
- 2.5 Future outlook and strategic recommendations
Chapter 3 Industry Insights
- 3.1 Industry ecosystem analysis
- 3.1.1 Supplier landscape
- 3.1.2 Profit margin analysis
- 3.1.3 Cost structure
- 3.1.4 Value addition at each stage
- 3.1.5 Factor affecting the value chain
- 3.1.6 Disruptions
- 3.2 Industry impact forces
- 3.2.1.1 Growth drivers
- 3.2.1.2 Growth in global seaborne trade
- 3.2.1.3 Stricter maritime safety regulations
- 3.2.1.4 Increasing traffic congestion in coastal and port waters
- 3.2.1.5 Technology upgrades and digital integration
- 3.2.2 Industry pitfalls and challenges
- 3.2.2.1 High installation and maintenance costs
- 3.2.2.2 Signal interference and clutter in congested waters
- 3.2.3 Market opportunities
- 3.2.3.1 Retrofit demand from aging global fleets
- 3.2.3.2 Expansion of offshore wind and offshore energy projects
- 3.2.3.3 Adoption of solid state and digital radar
- 3.3 Growth potential analysis
- 3.4 Regulatory landscape
- 3.4.1 North America
- 3.4.1.1 United States Coast Guard (USCG) Radar Carriage and Observer Requirements
- 3.4.1.2 USCG Approval of Radar Equipment under 46 CFR
- 3.4.1.3 Federal Communications Commission (FCC) Radar Certification Standards
- 3.4.1.4 Canada Transport Canada Marine Radar Compliance Guidelines
- 3.4.2 Europe
- 3.4.2.1 European Maritime Safety Agency (EMSA) Oversight and Implementation
- 3.4.2.2 Marine Equipment Directive (MED) Type Approval Requirements
- 3.4.2.3 EU Flag State and Port State Control Radar Inspections
- 3.4.2.4 Harmonized EN Standards for Radar Equipment
- 3.4.3 Asia Pacific
- 3.4.3.1 China Classification Society (CCS) Radar Type Approval Standards
- 3.4.3.2 India Directorate General of Shipping Radar Compliance Rules
- 3.4.3.3 Japan Ministry of Land Infrastructure Transport Radar Regulations
- 3.4.3.4 South Korea Korean Register of Shipping Radar Requirements
- 3.4.3.5 ASEAN Regional Maritime Safety and Radar Harmonization Guidelines
- 3.4.4 Latin America
- 3.4.4.1 Brazil Maritime Authority (ANtaq) Radar Equipment Standards
- 3.4.4.2 Argentina Prefectura Naval Radar Compliance Regulations
- 3.4.4.3 Mexico Secretariat of Navy and Transport Radar Rules
- 3.4.4.4 Regional SOLAS Implementation and Flag State Controls
- 3.4.5 Middle East & Africa
- 3.4.5.1 UAE Federal Transport Authority Maritime Radar Standards
- 3.4.5.2 Saudi Arabia Ports Authority Radar Requirements
- 3.4.5.3 South Africa Maritime Safety Authority (SAMSA) Regulations
- 3.4.5.4 Regional Adoption of IMO and IEC Radar Performance Standards
- 3.4.1 North America
- 3.5 Porter';s analysis
- 3.6 PESTEL analysis
- 3.7 Technology and innovation landscape
- 3.7.1 Current technological trends
- 3.7.2 Emerging technologies
- 3.8 Price trends
- 3.8.1 By region
- 3.8.2 By product
- 3.9 Production statistics
- 3.9.1 Production hubs
- 3.9.2 Consumption hubs
- 3.9.3 Export and import
- 3.10 Cost breakdown analysis
- 3.10.1 Radar system acquisition costs
- 3.10.2 Installation and integration costs
- 3.10.3 Operational and maintenance costs
- 3.10.4 Software upgrade and calibration costs
- 3.10.5 Regulatory certification and type approval costs
- 3.10.6 Training and crew familiarization costs
- 3.11 Patent analysis
- 3.12 Sustainability and environmental aspects
- 3.12.1 Sustainable practices
- 3.12.2 Waste reduction strategies
- 3.12.3 Energy efficiency in production
- 3.12.4 Eco-friendly Initiatives
- 3.12.5 Carbon footprint considerations
- 3.13 Marine radar system architecture & integration framework
- 3.13.1 Standalone vs integrated bridge systems (IBS)
- 3.13.2 Radar integration with ECDIS, AIS, ARPA, and INS
- 3.13.3 Open vs proprietary navigation system architectures
- 3.13.4 Role of radar in sensor fusion environments
- 3.14 OEM differentiation & technology positioning factors
- 3.14.1 Detection range, resolution, and clutter suppression benchmarks
- 3.14.2 Solid-state vs magnetron radar differentiation
- 3.14.3 Software-defined radar capabilities
- 3.14.4 Reliability, MTBF, and lifecycle performance metrics
- 3.15 Retrofit vs newbuild demand dynamics
- 3.16 Impact of SOLAS, IMO & naval procurement standards
Chapter 4 Competitive Landscape, 2025
- 4.1 Introduction
- 4.2 Company market share analysis
- 4.2.1 North America
- 4.2.2 Europe
- 4.2.3 Asia Pacific
- 4.2.4 LATAM
- 4.2.5 MEA
- 4.3 Competitive analysis of major market players
- 4.4 Competitive positioning matrix
- 4.5 Strategic outlook matrix
- 4.6 Key developments
- 4.6.1 Mergers & acquisitions
- 4.6.2 Partnerships & collaborations
- 4.6.3 New Product Launches
- 4.6.4 Expansion Plans and funding
Chapter 5 Market Estimates & Forecast, By Radar, 2022 - 2035 ($Bn, Units)
- 5.1 Key trends
- 5.2 X-band
- 5.3 S-band
- 5.4 C-Band radar
- 5.5 Others
Chapter 6 Market Estimates & Forecast, By Component, 2022 - 2035 ($Bn, Units)
- 6.1 Key trends
- 6.2 Transmitters
- 6.3 Antennas
- 6.4 Receivers
- 6.5 Processors
- 6.6 Displays
- 6.7 Other
Chapter 7 Market Estimates & Forecast, By Range, 2022 - 2035 ($Bn, Units)
- 7.1 Key trends
- 7.2 Short-range radar (1-20 NM)
- 7.3 Medium-range radar (20-50 NM)
- 7.4 Long-range radar (50-100 NM and above)
Chapter 8 Market Estimates & Forecast, By Application, 2022 - 2035 ($Bn, Units)
- 8.1 Key trends
- 8.2 Navigation
- 8.3 Collision Avoidance
- 8.4 Surveillance & Security
- 8.5 Fishing Operations
- 8.6 Monitoring Coastal Traffic
- 8.7 Weather Monitoring
- 8.8 Others
Chapter 9 Market Estimates & Forecast, By End Use, 2022 - 2035 ($Bn, Units)
- 9.1 Key trends
- 9.2 Commercial vessels
- 9.3 Naval & Defense / Military Naval
- 9.4 Recreational Boats / Yachts
- 9.5 Private boat owners
- 9.6 Fishing vessels
- 9.7 Others
Chapter 10 Market Estimates & Forecast, By Region, 2022 - 2035 ($Bn, Units)
- 10.1 Key trends
- 10.2 North America
- 10.2.1 US
- 10.2.2 Canada
- 10.3 Europe
- 10.3.1 Germany
- 10.3.2 UK
- 10.3.3 France
- 10.3.4 Italy
- 10.3.5 Spain
- 10.3.6 Russia
- 10.3.7 Nordics
- 10.3.8 Netherlands
- 10.3.9 Sweden
- 10.4 Asia Pacific
- 10.4.1 China
- 10.4.2 India
- 10.4.3 Japan
- 10.4.4 Australia
- 10.4.5 South Korea
- 10.4.6 Singapore
- 10.4.7 Thailand
- 10.4.8 Indonesia
- 10.4.9 Vietnam
- 10.5 Latin America
- 10.5.1 Brazil
- 10.5.2 Mexico
- 10.5.3 Argentina
- 10.6 MEA
- 10.6.1 South Africa
- 10.6.2 Saudi Arabia
- 10.6.3 UAE
- 10.6.4 Turkey
Chapter 11 Company Profiles
- 11.1 Global Players
- 11.1.1 BAE Systems
- 11.1.2 Furuno Electric
- 11.1.3 Garmin
- 11.1.4 Hensoldt
- 11.1.5 Kongsberg Gruppen
- 11.1.6 Leonardo
- 11.1.7 Lockheed Martin
- 11.1.8 Navico
- 11.1.9 Northrop Grumman
- 11.1.10 Raymarine
- 11.1.11 Raytheon RTX
- 11.1.12 Saab
- 11.1.13 Sperry Marine
- 11.1.14 Teledyne FLIR
- 11.1.15 Thales
- 11.2 Regional Players
- 11.2.1 GEM Elettronica
- 11.2.2 JRC Nisshinbo
- 11.2.3 Koden Electronics
- 11.2.4 Samyung ENC
- 11.2.5 TOKIO KEIKI
- 11.3 Emerging Players/Disruptors
- 11.3.1 Alphatron Marine
- 11.3.2 Rutter
- 11.3.3 Terma

