
|
시장보고서
상품코드
1928943
금 나노입자 시장 기회, 성장요인, 업계 동향 분석 및 예측(2026-2035년)Gold Nanoparticles Market Opportunity, Growth Drivers, Industry Trend Analysis, and Forecast 2026 - 2035 |
||||||
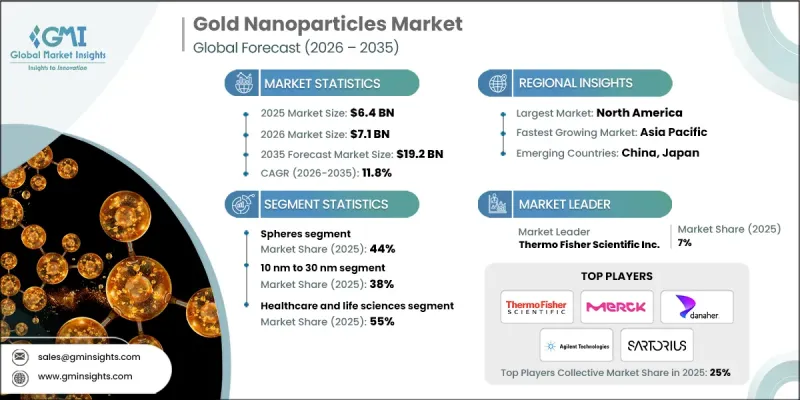
세계의 금 나노입자 시장은 2025년에 64억 달러로 평가되었고, 2035년까지 연평균 복합 성장률(CAGR) 11.8%로 성장하여 192억 달러에 이를 것으로 예측되고 있습니다.

금 나노입자는 전문 실험실용 재료에서 생명과학 분야 전반에 걸쳐 확장 가능하고 광범위하게 적용 가능한 재료로 진화하고 있으며, 안정적인 바이오 라벨링과 조정 가능한 광학 특성과 같은 과제를 해결하고 있습니다. 코로나19 팬데믹 기간 동안 생명과학 연구에 대한 자금 지원은 전례 없는 수준에 이르렀으며, 혁신과 학술 출판을 모두 촉진했습니다. 이러한 나노입자는 연구 및 진단에서 시약 및 분석 성분으로 일반적으로 활용되고 있습니다. 특히 체외 진단 및 바이오 융합 응용 분야에서 구매자는 점점 더 높은 품질 기준, 추적성 및 종합적인 문서화를 요구하고 있습니다. ISO 준수 시스템 및 분석 인증서는 조달의 표준 요구사항이 되어가고 있으며, 일관된 공급망을 보장하고 있습니다. 지속적인 연구 개발, 공공 과학에 대한 참여, 재현성에 대한 집중은 팬데믹으로 인한 수요 급증에도 불구하고 시장의 장기적인 성장을 뒷받침하고 있습니다.
| 시장 범위 | |
|---|---|
| 개시 연도 | 2025년 |
| 예측 연도 | 2026-2035년 |
| 개시 연도 가치 | 64억 달러 |
| 예측 금액 | 192억 달러 |
| CAGR | 11.8% |
구형 나노입자 부문은 44%의 점유율을 차지하고 있으며, 2035년까지 연평균 11.1%의 성장률을 보일 것으로 예측됩니다. 이 형태는 대량 생산의 확장성, 재현성, 일상적인 라벨링 및 분석 생산에서 검증의 용이성으로 인해 주류로 자리 잡았습니다. 한편, 구매자들은 광열 치료 및 감지 용도를 위해 조정 가능한 플라즈몬 특성을 실현하기 위해 막대, 별과 같은 이방성 형상의 채택을 늘리고 있습니다. 공급업체는 진화하는 조사 수요에 대응하기 위해 제품 카탈로그를 확장하고 배치 간 일관성을 개선하여 대응하고 있습니다.
2025년에는 10nm에서 30nm 크기의 금 나노입자가 38%의 점유율을 차지할 것으로 예상되며, 2035년까지 연평균 복합 성장률(CAGR) 14.8%를 나타낼 것으로 예측됩니다. 중간 크기의 입자는 일상적인 분석에서 광학 신호 강도, 콜로이드 안정성 및 생체 결합의 실용성과 균형을 이룹니다. 10nm 이하의 미세 나노입자는 조직 침투성과 표면적 증가가 우수하여 선호되지만, 보다 엄격한 품질관리가 요구됩니다. 한편, 산란 및 가시성 응용 분야에서는 여전히 큰 입자가 유용합니다.
북미 금 나노입자 시장은 2025년 22억 달러 규모이며, 2035년까지 연평균 12.5%의 연평균 복합 성장률(CAGR)로 71억 달러에 달할 것으로 예측됩니다. 강력한 생명과학 R&D 클러스터, 확립된 조달 기준, 탄탄한 진단 수요가 지역 성장을 견인하고 있습니다. 진단, 이미징, 초기 단계의 치료 응용 분야에서 안정적인 수요를 유지하고 있으며, 분석 생산 규모 확대와 중개연구에 대한 지속적인 자금 지원으로 진단, 이미징, 초기 단계의 치료 응용 분야에서 안정적인 수요를 유지하고 있습니다.
자주 묻는 질문
목차
제1장 조사 방법과 범위
제2장 주요 요약
제3장 업계 인사이트
- 생태계 분석
- 공급업체 상황
- 이익률
- 각 단계 부가가치
- 밸류체인에 영향을 미치는 요인
- 파괴적 변화
- 업계에 대한 영향요인
- 성장 촉진요인
- 신속 진단과 바이오센서 확대
- 나노 의료 연구와 트란스레이쇼나르파이프라인 진전
- 프라즈모니크스 및 첨단 광학 디바이스 성장
- 업계의 잠재적 리스크&과제
- 돈 고비용과 가격변동성
- 규제 및 안전성 검증 부담
- 시장 기회
- 표적 약물 전달과 광열 요법
- 확장 가능한 그린 합성과 표면 기능화
- 성장 촉진요인
- 성장 가능성 분석
- 규제 상황
- 북미
- 유럽
- 아시아태평양
- 라틴아메리카
- 중동 및 아프리카
- Porter의 Five Forces 분석
- PESTEL 분석
- 가격 동향
- 지역별
- 제품 유형별
- 향후 시장 동향
- 기술과 혁신 동향
- 현재 기술 동향
- 신기술
- 특허 상황
- 무역 통계(HS코드)(주 : 무역 통계는 주요 국가에 한해 제공됩니다)
- 주요 수입국
- 주요 수출국
- 지속가능성과 환경면
- 지속가능한 대처
- 폐기물 감축 전략
- 생산 에너지 효율
- 친환경 이니셔티브
- 탄소발자국 고려
제4장 경쟁 구도
- 서론
- 기업의 시장 점유율 분석
- 지역별
- 북미
- 유럽
- 아시아태평양
- 라틴아메리카
- 중동 및 아프리카
- 지역별
- 기업 매트릭스 분석
- 주요 시장 기업의 경쟁 분석
- 경쟁 포지셔닝 매트릭스
- 주요 발전
- 인수합병(M&A)
- 제휴 및 협업
- 신제품 발매
- 사업 확대 계획
제5장 시장 추산·예측 : 제품별, 2022-2035
- 구체
- 로드
- 쉘
- 케이지
- 스타
- 삼각형 및 프리즘
- 기타
제6장 시장 추산·예측 : 사이즈 범위별, 2022-2035
- 10nm 미만
- 10 nm-30nm
- 31 nm-50nm
- 51 nm-100nm
- 100nm 이상
제7장 시장 추산·예측 : 최종 이용 산업별, 2022-2035
- 의료 및 생명과학
- 체외진단
- 이미징 및 조영제
- 약물 전달과 치료법
- 바이오센서
- 조사 및 실험실용도
- 일렉트로닉스 및 포토닉스
- 전도성 잉크
- 디스플레이 및 옵토일렉트로닉스
- 프라즈몬데바이스
- 광열·광학 컴포넌트
- 화학제품·재료
- 촉매
- 코팅 및 복합재료
- 에너지와 환경
- 태양전지 및 연료전지 응용
- 수처리 및 환경 센싱
- 기타 최종 용도
제8장 시장 추산·예측 : 지역별, 2022-2035
- 북미
- 미국
- 캐나다
- 유럽
- 독일
- 영국
- 프랑스
- 스페인
- 이탈리아
- 기타 유럽
- 아시아태평양
- 중국
- 인도
- 일본
- 호주
- 한국
- 기타 아시아태평양
- 라틴아메리카
- 브라질
- 멕시코
- 아르헨티나
- 기타 라틴아메리카
- 중동 및 아프리카
- 사우디아라비아
- 남아프리카공화국
- 아랍에미리트
- 기타 중동 및 아프리카
제9장 기업 개요
- Cytodiagnostics Inc.
- nanoComposix
- BBI Solutions
- Merck KGaA
- Thermo Fisher Scientific Inc.
- Danaher Corporation
- Sartorius AG
- Agilent Technologies Inc.
- PerkinElmer Inc.
- Luminex Corporation
- Tanaka Precious Metals
- AMETEK Inc.
- Strem Chemicals Inc.
- Nanopartz Inc.
- Meliorum Technologies Inc.
- Goldsol Inc.
The Global Gold Nanoparticles Market was valued at USD 6.4 billion in 2025 and is estimated to grow at a CAGR of 11.8% to reach USD 19.2 billion by 2035.
Gold nanoparticles have evolved from a specialized laboratory material into a scalable, widely applied input across life sciences, addressing challenges in stable bio-labeling and tunable optical properties. Funding for life sciences research reached unprecedented levels during the COVID-19 pandemic, driving both innovation and publication output. These nanoparticles are commonly utilized as reagents and assay components in research and diagnostics. Buyers increasingly demand higher quality standards, traceability, and comprehensive documentation, particularly in in-vitro diagnostics and bioconjugation applications. ISO-aligned systems and certificates of analysis are becoming standard requirements in procurement, ensuring consistent supply chains. Sustained R&D, public science engagement, and a focus on reproducibility continue to underpin the market's long-term growth, even beyond pandemic-driven demand spikes.
| Market Scope | |
|---|---|
| Start Year | 2025 |
| Forecast Year | 2026-2035 |
| Start Value | $6.4 Billion |
| Forecast Value | $19.2 Billion |
| CAGR | 11.8% |
The spherical nanoparticles segment held a 44% share and is expected to grow at a CAGR of 11.1% through 2035. This shape dominates due to high-volume scalability, reproducibility, and ease of validation in routine labeling and assay production. Meanwhile, buyers are increasingly adding anisotropic shapes, such as rods and stars, to achieve tunable plasmonic properties for photothermal therapy and sensing applications. Suppliers are responding by broadening product catalogs and enhancing batch consistency to meet evolving research needs.
The gold nanoparticles sized 10 nm to 30 nm captured 38% share in 2025 and are expected to grow at a CAGR of 14.8% through 2035. Mid-range particles balance optical signal strength, colloidal stability, and bioconjugation practicality for routine assays. Smaller nanoparticles under 10 nm are preferred for enhanced tissue penetration and surface area, though they require stricter quality control. Larger particles remain relevant for scattering and visibility applications.
North America Gold Nanoparticles Market generated USD 2.2 billion in 2025 and is projected to reach USD 7.1 billion by 2035 at a CAGR of 12.5%. Strong life science R&D clusters, established procurement standards, and robust diagnostics demand drive regional growth. The scaling of assay manufacturing and consistent funding for translational research maintain steady demand across diagnostics, imaging, and early-stage therapeutic applications.
Major players in the Global Gold Nanoparticles Market include Cytodiagnostics Inc., nanoComposix, BBI Solutions, Merck KGaA, Thermo Fisher Scientific Inc., Danaher Corporation, Sartorius AG, Agilent Technologies, Inc., PerkinElmer, Inc., Luminex Corporation, Tanaka Precious Metals, AMETEK, Inc., Strem Chemicals, Inc., Nanopartz Inc., Meliorum Technologies, Inc., and Goldsol, Inc. Companies in the Global Gold Nanoparticles Market are strengthening their positions by expanding product portfolios with varied particle sizes and shapes to meet diverse research and diagnostic needs. R&D investments ensure improved reproducibility, stability, and bioconjugation performance. Firms are also emphasizing ISO-compliant quality systems, certificates of analysis, and traceable documentation to enhance trust with buyers.
Table of Contents
Chapter 1 Methodology & Scope
- 1.1 Market scope and definition
- 1.2 Research design
- 1.2.1 Research approach
- 1.2.2 Data collection methods
- 1.3 Data mining sources
- 1.3.1 Global
- 1.3.2 Regional/Country
- 1.4 Base estimates and calculations
- 1.4.1 Base year calculation
- 1.4.2 Key trends for market estimation
- 1.5 Primary research and validation
- 1.5.1 Primary sources
- 1.6 Forecast model
- 1.7 Research assumptions and limitations
Chapter 2 Executive Summary
- 2.1 Industry 3600 synopsis
- 2.2 Key market trends
- 2.2.1 Regional
- 2.2.2 Product
- 2.2.3 Size Range
- 2.2.4 End use Industry
- 2.3 TAM Analysis, 2026-2035
- 2.4 CXO perspectives: Strategic imperatives
- 2.4.1 Executive decision points
- 2.4.2 Critical success factors
- 2.5 Future Outlook and Strategic Recommendations
Chapter 3 Industry Insights
- 3.1 Industry ecosystem analysis
- 3.1.1 Supplier landscape
- 3.1.2 Profit margin
- 3.1.3 Value addition at each stage
- 3.1.4 Factor affecting the value chain
- 3.1.5 Disruptions
- 3.2 Industry impact forces
- 3.2.1 Growth drivers
- 3.2.1.1 Expansion of rapid diagnostics and biosensors
- 3.2.1.2 Rising nanomedicine research and translational pipelines
- 3.2.1.3 Growth in plasmonics and advanced optical devices
- 3.2.2 Industry pitfalls and challenges
- 3.2.2.1 High cost and price volatility of gold
- 3.2.2.2 Regulatory and safety validation burden
- 3.2.3 Market opportunities
- 3.2.3.1 Targeted drug delivery and photothermal therapy
- 3.2.3.2 Scalable green synthesis and surface functionalization
- 3.2.1 Growth drivers
- 3.3 Growth potential analysis
- 3.4 Regulatory landscape
- 3.4.1 North America
- 3.4.2 Europe
- 3.4.3 Asia Pacific
- 3.4.4 Latin America
- 3.4.5 Middle East & Africa
- 3.5 Porter';s analysis
- 3.6 PESTEL analysis
- 3.7 Price trends
- 3.7.1 By region
- 3.7.2 By Product type
- 3.8 Future market trends
- 3.9 Technology and Innovation landscape
- 3.9.1 Current technological trends
- 3.9.2 Emerging technologies
- 3.10 Patent Landscape
- 3.11 Trade statistics (HS code) (Note: the trade statistics will be provided for key countries only)
- 3.11.1 Major importing countries
- 3.11.2 Major exporting countries
- 3.12 Sustainability and environmental aspects
- 3.12.1 Sustainable practices
- 3.12.2 Waste reduction strategies
- 3.12.3 Energy efficiency in production
- 3.12.4 Eco-friendly initiatives
- 3.13 Carbon footprint consideration
Chapter 4 Competitive Landscape, 2025
- 4.1 Introduction
- 4.2 Company market share analysis
- 4.2.1 By region
- 4.2.1.1 North America
- 4.2.1.2 Europe
- 4.2.1.3 Asia Pacific
- 4.2.1.4 LATAM
- 4.2.1.5 MEA
- 4.2.1 By region
- 4.3 Company matrix analysis
- 4.4 Competitive analysis of major market players
- 4.5 Competitive positioning matrix
- 4.6 Key developments
- 4.6.1 Mergers & acquisitions
- 4.6.2 Partnerships & collaborations
- 4.6.3 New Product Launches
- 4.6.4 Expansion Plans
Chapter 5 Market Estimates and Forecast, By Product, 2022-2035 (USD Billion) (Kilo Tons)
- 5.1 Key trends
- 5.2 Spheres
- 5.3 Rods
- 5.4 Shells
- 5.5 Cages
- 5.6 Stars
- 5.7 Triangles and prisms
- 5.8 Other
Chapter 6 Market Estimates and Forecast, By Size Range, 2022-2035 (USD Billion) (Kilo Tons)
- 6.1 Key trends
- 6.2 Less than 10 nm
- 6.3 10 nm to 30 nm
- 6.4 31 nm to 50 nm
- 6.5 51 nm to 100 nm
- 6.6 More than 100 nm
Chapter 7 Market Estimates and Forecast, By End Use Industry, 2022-2035 (USD Billion) (Kilo Tons)
- 7.1 Key trends
- 7.2 Healthcare and life sciences
- 7.2.1 In vitro diagnostics
- 7.2.2 Imaging and contrast agents
- 7.2.3 Drug delivery and therapeutics
- 7.2.4 Biosensors
- 7.2.5 Research and laboratory use
- 7.3 Electronics and photonics
- 7.3.1 Conductive inks
- 7.3.2 Displays and optoelectronics
- 7.3.3 Plasmonic devices
- 7.3.4 Photothermal and optical components
- 7.4 Chemicals and materials
- 7.4.1 Catalysts
- 7.4.2 Coatings and composites
- 7.5 Energy and environment
- 7.5.1 Solar and fuel cell applications
- 7.5.2 Water treatment and environmental sensing
- 7.6 Other end use
Chapter 8 Market Estimates and Forecast, By Region, 2022-2035 (USD Billion) (Kilo Tons)
- 8.1 Key trends
- 8.2 North America
- 8.2.1 U.S.
- 8.2.2 Canada
- 8.3 Europe
- 8.3.1 Germany
- 8.3.2 UK
- 8.3.3 France
- 8.3.4 Spain
- 8.3.5 Italy
- 8.3.6 Rest of Europe
- 8.4 Asia Pacific
- 8.4.1 China
- 8.4.2 India
- 8.4.3 Japan
- 8.4.4 Australia
- 8.4.5 South Korea
- 8.4.6 Rest of Asia Pacific
- 8.5 Latin America
- 8.5.1 Brazil
- 8.5.2 Mexico
- 8.5.3 Argentina
- 8.5.4 Rest of Latin America
- 8.6 Middle East and Africa
- 8.6.1 Saudi Arabia
- 8.6.2 South Africa
- 8.6.3 UAE
- 8.6.4 Rest of Middle East and Africa
Chapter 9 Company Profiles
- 9.1 Cytodiagnostics Inc.
- 9.2 nanoComposix
- 9.3 BBI Solutions
- 9.4 Merck KGaA
- 9.5 Thermo Fisher Scientific Inc.
- 9.6 Danaher Corporation
- 9.7 Sartorius AG
- 9.8 Agilent Technologies Inc.
- 9.9 PerkinElmer Inc.
- 9.10 Luminex Corporation
- 9.11 Tanaka Precious Metals
- 9.12 AMETEK Inc.
- 9.13 Strem Chemicals Inc.
- 9.14 Nanopartz Inc.
- 9.15 Meliorum Technologies Inc.
- 9.16 Goldsol Inc.

