
|
시장보고서
상품코드
1936585
유연송전시스템(FACTS) 시장 기회, 성장 촉진요인, 업계 동향 분석, 예측(2026-2035년)Flexible AC Transmission Systems Market Opportunity, Growth Drivers, Industry Trend Analysis, and Forecast 2026 - 2035 |
||||||
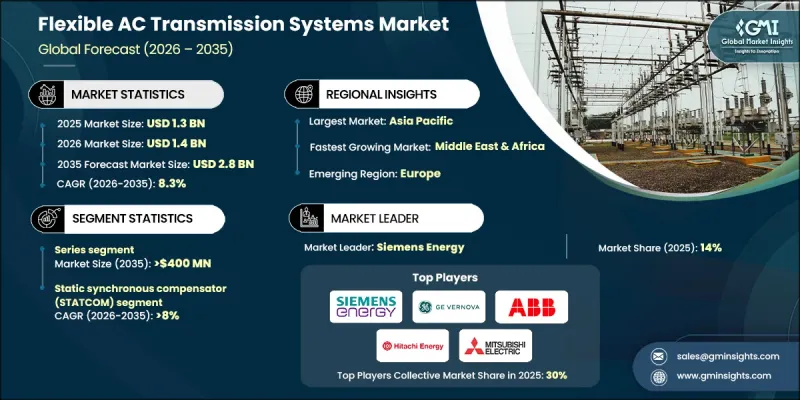
세계의 유연송전시스템(FACTS) 시장은 2025년에 13억 달러로 평가되었으며, 2035년까지 CAGR 8.3%로 성장하여 28억 달러에 달할 것으로 예측됩니다.

시장 성장은 전력회사가 노후화된 전력망을 업그레이드하고 증가하는 전력 흐름과 운영상의 복잡성을 충족시키기 위해 전력 인프라에 대한 투자를 늘리면서 주도하고 있습니다. 재생에너지 발전의 급속한 통합으로 변동성, 전압 불안정성, 간헐성 등 문제가 발생하여 전력망은 점점 더 큰 압력에 직면하고 있습니다. 전통적인 발전소가 단계적으로 폐지되는 가운데, 현대의 전력망은 인버터 기반 발전에 대한 의존도가 높아지면서 고급 전력 흐름 제어 및 전압 조정 솔루션의 필요성이 증가하고 있습니다. 선진국과 신흥국의 전력망 현대화 노력은 전력 전자 기술의 지속적인 발전에 힘입어 FACTS 기술의 채택을 가속화하고 있습니다. 첨단 컨버터 기반 솔루션은 더 빠른 응답 시간, 향상된 제어성 및 효율성 향상으로 역동적인 전력망 환경에 적합합니다. 전력 수요의 증가, 송전선로의 혼잡, 기존 인프라 용량의 최대화 요구로 인해 FACTS 시스템은 현대 전력 네트워크에 필수적인 구성요소로 자리매김하고 있습니다.
| 시장 범위 | |
|---|---|
| 시작 연도 | 2025년 |
| 예측 연도 | 2026-2035년 |
| 개시 금액 | 13억 달러 |
| 예측 금액 | 28억 달러 |
| CAGR | 8.3% |
시리즈 부문은 송전 효율 향상과 계통 안정성 강화의 중요성을 반영하여 2035년까지 4억 달러에 달할 것으로 예상됩니다. 직렬 보상 기술은 선로 리액턴스를 감소시켜 전력 전송 능력을 향상시키고, 전력회사가 새로운 송전설비에 투자하지 않고 기존 자산을 최적화할 수 있도록 합니다. 전체 비용을 낮추면서 성능을 개선할 수 있는 능력은 고부하 송전 네트워크 전반에 걸쳐 꾸준히 도입되고 있습니다.
정적 동기 보상 장치 부문은 신속한 무효전력 지원과 정밀한 전압 제어 능력을 배경으로 2035년까지 CAGR 8%로 확대될 것으로 예상됩니다. 이러한 시스템은 재생에너지 비율이 높은 전력 계통의 안정화에 중요한 역할을 하며, 변동 부하가 전력 품질에 영향을 미치는 산업 환경에서 널리 채택되고 있습니다. 유연성과 빠른 동적 응답성으로 인해 전력 회사 규모의 애플리케이션과 산업용 애플리케이션 모두에서 우선적으로 채택되는 솔루션이 되었습니다.
미국의 유연송전시스템 시장은 2025년 2억 6,030만 달러 규모에 달할 것으로 예상됩니다. 이 나라의 성장은 지속적인 전력망 현대화, 전기화율의 증가, 재생에너지 용량의 확대에 의해 뒷받침되고 있습니다. 수요 증가와 부하 프로파일의 변화로 인한 시스템 부하 증가는 신뢰성과 운영 효율성을 향상시키는 첨단 송전 제어 기술에 대한 투자를 지속적으로 촉진하고 있습니다.
자주 묻는 질문
목차
제1장 조사 방법과 범위
제2장 주요 요약
제3장 업계 인사이트
제4장 경쟁 구도
제5장 시장 규모 및 예측 : 구성별, 2022-2035년
제6장 시장 규모 및 예측 : 제품별, 2022-2035년
제7장 시장 규모 및 예측 : 전압별, 2022-2035년
제8장 시장 규모 및 예측 : 최종 용도별, 2022-2035년
제9장 시장 규모 및 예측 : 지역별, 2022-2035년
제10장 기업 개요
KSM 26.03.12The Global Flexible AC Transmission Systems Market was valued at USD 1.3 billion in 2025 and is estimated to grow at a CAGR of 8.3% to reach USD 2.8 billion by 2035.
Market growth is driven by rising investment in transmission infrastructure as utilities upgrade aging grids to manage higher electricity flows and increasing operational complexity. Power networks are under growing pressure due to rapid renewable energy integration, which introduces variability, voltage instability, and intermittency challenges. As conventional power plants are gradually retired, modern grids increasingly rely on inverter-based generation, intensifying the need for advanced power flow control and voltage regulation solutions. Grid modernization initiatives across developed and emerging economies are accelerating the adoption of FACTS technologies, supported by continuous improvements in power electronics. Advanced converter-based solutions now offer faster response times, enhanced controllability, and improved efficiency, making them well-suited for dynamic grid conditions. Increasing electricity demand, congestion across transmission corridors, and the requirement to maximize existing infrastructure capacity are positioning FACTS systems as essential components of modern power networks.
| Market Scope | |
|---|---|
| Start Year | 2025 |
| Forecast Year | 2026-2035 |
| Start Value | $1.3 Billion |
| Forecast Value | $2.8 Billion |
| CAGR | 8.3% |
The series segment is projected to reach USD 400 million by 2035, reflecting its importance in improving transmission efficiency and enhancing grid stability. Series compensation technologies increase power transfer capability by reducing line reactance, allowing utilities to optimize existing assets rather than invest in new transmission construction. Their ability to deliver performance improvements at a lower overall cost continues to support steady deployment across high-load transmission networks.
The static synchronous compensator segment is expected to grow at a CAGR of 8% through 2035, driven by its ability to provide rapid reactive power support and precise voltage control. These systems play a critical role in stabilizing grids with high renewable penetration and are widely adopted in industrial environments where fluctuating loads impact power quality. Their flexibility and fast dynamic response make them a preferred solution for both utility-scale and industrial applications.
U.S. Flexible AC Transmission Systems Market USD 260.3 million in 2025. Growth in the country is supported by ongoing grid modernization efforts, rising electrification, and expanding renewable capacity. Increasing system stress from higher demand and evolving load profiles continues to drive investment in advanced transmission control technologies that enhance reliability and operational efficiency.
Key companies active in the Global Flexible AC Transmission Systems Market include Siemens Energy, Hitachi Energy, GE Vernova, Mitsubishi Electric, ABB, Hyosung Heavy Industries, LS Electric Co., Ingeteam, Infineon, Fuji SMBE Pte Ltd., BHEL, HICO America, NR Electric, Quanta Technology, and Elkraft Solutions Limited. Companies operating in the flexible AC transmission systems market focus on strengthening their market position through continuous technological innovation and strategic partnerships with utilities and grid operators. Investment in advanced power electronics, digital control platforms, and modular solutions enables suppliers to deliver flexible and scalable systems tailored to evolving grid requirements. Firms are also expanding service offerings that include system design, commissioning, and long-term maintenance to enhance customer retention. Geographic expansion into high-growth regions and participation in grid modernization programs support revenue diversification.
Table of Contents
Chapter 1 Methodology & Scope
- 1.1 Research design
- 1.2 Market estimates & forecast parameters
- 1.3 Forecast calculation
- 1.4 Data sources
- 1.4.1 Primary
- 1.4.2 Secondary
- 1.4.2.1 Paid
- 1.4.2.2 Public
Chapter 2 Executive Summary
- 2.1 Industry synopsis, 2022 - 2035
Chapter 3 Industry Insights
- 3.1 Industry ecosystem analysis
- 3.1.1 Raw material availability landscape
- 3.1.2 Factors affecting the value chain
- 3.1.3 Disruptions
- 3.2 Regulatory landscape
- 3.3 Industry impact forces
- 3.3.1 Growth drivers
- 3.3.2 Industry pitfalls & challenges
- 3.4 Growth potential analysis
- 3.5 Porter's analysis
- 3.5.1 Bargaining power of suppliers
- 3.5.2 Bargaining power of buyers
- 3.5.3 Threat of new entrants
- 3.5.4 Threat of substitutes
- 3.6 PESTEL analysis
- 3.6.1 Political factors
- 3.6.2 Economic factors
- 3.6.3 Social factors
- 3.6.4 Technological factors
- 3.6.5 Legal factors
- 3.6.6 Environmental factors
- 3.7 Emerging opportunities & trends
- 3.8 Investment analysis & future outlook
Chapter 4 Competitive Landscape, 2025
- 4.1 Introduction
- 4.2 Company market share, by region, 2025
- 4.2.1 North America
- 4.2.2 Europe
- 4.2.3 Asia Pacific
- 4.2.4 Middle East & Africa
- 4.2.5 Latin America
- 4.3 Strategic initiatives
- 4.4 Competitive benchmarking depictions
- 4.5 Strategy dashboard
- 4.6 Innovation & technology landscape
Chapter 5 Market Size and Forecast, By Configuration, 2022 - 2035 (USD Million, MVAr)
- 5.1 Key trends
- 5.2 Series
- 5.3 Shunt
- 5.4 Combined
Chapter 6 Market Size and Forecast, By Product, 2022 - 2035 (USD Million, MVAr)
- 6.1 Key trends
- 6.2 Static Var Compensator (SVC)
- 6.3 Thyristor Controlled Series Capacitor (TCSC)
- 6.4 Static Synchronous Compensator (STATCOM)
- 6.5 Unified Power Flow Controller (UPFC)
- 6.6 Others
Chapter 7 Market Size and Forecast, By Voltage, 2022 - 2035 (USD Million, MVAr)
- 7.1 Key trends
- 7.2 > 132 kV to ≤ 220 kV
- 7.3 > 220 kV to ≤ 660 kV
- 7.4 > 660 kV
Chapter 8 Market Size and Forecast, By End Use, 2022 - 2035 (USD Million, MVAr)
- 8.1 Key trends
- 8.2 Utilities
- 8.3 Renewables
- 8.4 Smart grid
- 8.5 Railways
- 8.6 Metal & mining industries
- 8.7 Oil & gas
- 8.8 Others
Chapter 9 Market Size and Forecast, By Region, 2022 - 2035 (USD Million, MVAr)
- 9.1 Key trends
- 9.2 North America
- 9.2.1 U.S.
- 9.2.2 Canada
- 9.2.3 Mexico
- 9.3 Europe
- 9.3.1 UK
- 9.3.2 France
- 9.3.3 Germany
- 9.3.4 Italy
- 9.3.5 Russia
- 9.3.6 Spain
- 9.4 Asia Pacific
- 9.4.1 China
- 9.4.2 Australia
- 9.4.3 India
- 9.4.4 Japan
- 9.4.5 South Korea
- 9.5 Middle East & Africa
- 9.5.1 Saudi Arabia
- 9.5.2 UAE
- 9.5.3 Turkey
- 9.5.4 South Africa
- 9.5.5 Egypt
- 9.6 Latin America
- 9.6.1 Brazil
- 9.6.2 Argentina
Chapter 10 Company Profiles
- 10.1 ABB
- 10.2 BHEL
- 10.3 Elkraft Solutions Limited
- 10.4 Fuji SMBE Pte Ltd.
- 10.5 GE Vernova
- 10.6 HICO America
- 10.7 Hitachi Energy
- 10.8 Hyosung Heavy Industries
- 10.9 Infineon
- 10.10 Ingeteam
- 10.11 LS Electric Co.
- 10.12 Mitsubishi Electric
- 10.13 NR Electric
- 10.14 Quanta Technology
- 10.15 Siemens Energy
