


|
시장보고서
상품코드
1936617
지속가능한 제조 설비 시장 기회, 성장 촉진요인, 업계 동향 분석 및 예측(2026-2035년)Sustainable Manufacturing Equipment Market Opportunity, Growth Drivers, Industry Trend Analysis, and Forecast 2026 - 2035 |
||||||
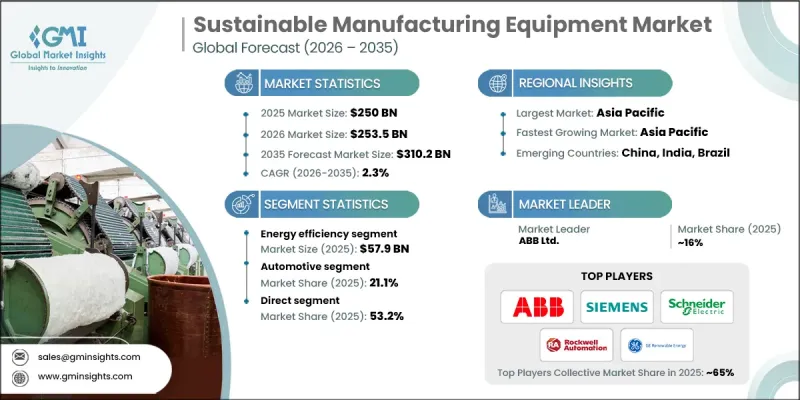
세계의 지속가능한 제조 설비 시장은 2025년에 2,500억 달러로 평가되었으며, 2035년까지 CAGR 2.3%로 성장하여 3,102억 달러에 달할 것으로 예측됩니다.
산업 분야 전반에 걸쳐 순환 경제의 원칙을 채택하는 움직임이 시장 성장에 영향을 미치고 있습니다. 제조업체들은 자원 효율성 향상, 재료 폐기물 감소, 제품 수명주기 연장에 초점을 맞추고 있으며, 이러한 목표를 지원하는 첨단 장비에 대한 수요를 직접적으로 증가시키고 있습니다. 지속가능한 제조 설비는 재사용과 재활용을 기반으로 한 생산 모델을 통해 기업이 원자재 의존도를 낮추면서 비용 효율성을 개선할 수 있도록 합니다. 이러한 전환은 환경적 측면뿐만 아니라 조직이 2차 자재 흐름에서 장기적인 비용 절감과 새로운 수익 기회를 모색하려는 재정적 동기에 기인합니다. 동시에 세계 각국의 공공 부문에서의 규제가 환경 친화적인 제조 방법의 도입을 가속화하고 있습니다. 정부는 친환경 기술 관련 투자 부담을 줄여주는 지원적인 정책 프레임워크와 재정적 구조를 통해 이러한 전환을 촉진하고 있습니다. 이러한 조치를 통해 제조업체들은 생산 인프라의 현대화를 추진하고 지속가능성을 핵심 운영 목표로 삼아야 합니다. 환경 규제 준수, 효율성, 수익성이 점점 더 상호 연관성이 높아지는 가운데, 지속가능한 제조 설비는 전 세계 산업계에서 전략적 투자로 계속 주목받고 있습니다.
| 시장 범위 | |
|---|---|
| 시작 연도 | 2025년 |
| 예측 연도 | 2026-2035 |
| 개시 금액 | 2,500억 달러 |
| 예측 금액 | 3,102억 달러 |
| CAGR | 2.3% |
에너지 효율 부문은 2025년 579억 달러의 시장 규모를 형성하고 2026년부터 2035년까지 연평균 1.2%의 성장률을 보일 것으로 예상됩니다. 에너지 효율이 높은 설비는 여러 산업 분야에 적용 가능성, 즉각적인 운영 비용 절감 효과, 배출량 감축 목표와의 정합성으로 인해 높은 도입률을 유지하고 있습니다. 기업들은 에너지 소비와 운영비용을 줄이면서 종합적인 성능 향상을 위해 적극적으로 기계설비를 업데이트하고 있습니다.
2024년 기준, 다이렉트 부문은 53.2%의 점유율을 차지했습니다. 직접 판매 모델을 통해 장비 제조업체는 중개자를 거치지 않고 최종사용자와 직접 거래할 수 있으며, 배출량 감소, 효율성 향상, 재활용성 등 지속가능성의 이점을 보다 명확하게 전달할 수 있고 장기적인 고객 관계를 강화할 수 있습니다.
미국의 지속가능한 제조 장비 시장은 2025년 448억 달러에 달했으며, 2035년까지 연평균 1.6%의 성장률을 기록할 것으로 전망됩니다. 시장에서의 선도적 지위는 탄탄한 산업 기반, 선진적인 혁신 능력, 그리고 환경 친화적 생산을 촉진하는 정책적 노력에 의해 뒷받침되고 있습니다. 미국에 본사를 둔 제조업체들은 규제 요건과 기업의 지속가능성 목표에 맞춰 사업을 운영하기 위해 지속가능한 설비를 일찍부터 도입하고 있습니다.
자주 묻는 질문
목차
제1장 조사 방법과 범위
제2장 주요 요약
제3장 업계 인사이트
제4장 경쟁 구도
제5장 시장 추정 및 예측 : 장비 유형별, 2022-2035
제6장 시장 추정 및 예측 : 최종 이용 산업별, 2022-2035
제7장 시장 추정 및 예측 : 최종 용도별, 2022-2035
제8장 시장 추정 및 예측 : 유통 채널별, 2022-2035
제9장 시장 추정 및 예측 : 지역별, 2022-2035
제10장 기업 개요
KSM 26.03.05The Global Sustainable Manufacturing Equipment Market was valued at USD 250 billion in 2025 and is estimated to grow at a CAGR of 2.3% to reach USD 310.2 billion by 2035.

The rising adoption of circular economy principles across industrial sectors influences market growth. Manufacturers are increasingly focused on improving resource efficiency, reducing material waste, and extending product life cycles, which directly increases demand for advanced equipment designed to support these goals. Sustainable manufacturing equipment enables companies to lower raw material dependency while improving cost efficiency through reuse and recycling-driven production models. This shift is not only environmentally driven but also financially motivated, as organizations seek long-term savings and new revenue opportunities from secondary material streams. At the same time, public-sector regulations worldwide are accelerating the adoption of environmentally responsible manufacturing practices. Governments are encouraging the transition through supportive policy frameworks and financial mechanisms that ease the investment burden associated with greener technologies. These measures are pushing manufacturers to modernize production infrastructure and prioritize sustainability as a core operational objective. As environmental compliance, efficiency, and profitability become increasingly interconnected, sustainable manufacturing equipment continues to gain traction as a strategic investment across global industries.
| Market Scope | |
|---|---|
| Start Year | 2025 |
| Forecast Year | 2026-2035 |
| Start Value | $250 Billion |
| Forecast Value | $310.2 Billion |
| CAGR | 2.3% |
The energy efficiency segment generated USD 57.9 billion in 2025 and is expected to grow at a CAGR of 1.2% from 2026 to 2035. Energy-efficient equipment maintains strong adoption due to its applicability across multiple industries, immediate operational savings, and alignment with emissions reduction targets. Companies are actively upgrading machinery to reduce energy consumption and operating expenses while improving overall performance.
The direct segment held 53.2% share in 2024. Direct sales models allow equipment manufacturers to engage end users without intermediaries, enabling clearer communication of sustainability benefits such as lower emissions, improved efficiency, and recyclability while strengthening long-term customer relationships.
U.S. Sustainable Manufacturing Equipment Market reached USD 44.8 billion in 2025 and is projected to grow at a CAGR of 1.6% through 2035. Market leadership is supported by a strong industrial foundation, advanced innovation capabilities, and policy-driven encouragement of environmentally responsible production. U.S.-based manufacturers are early adopters of sustainable equipment as they align operations with regulatory expectations and corporate sustainability objectives.
Major companies operating in the Global Sustainable Manufacturing Equipment Market include Siemens AG, Schneider Electric SE, ABB Ltd., Rockwell Automation, Inc., Mitsubishi Electric Corporation, Honeywell International Inc., Emerson Electric Co., Atlas Copco AB, FANUC Corporation, Bosch Rexroth AG, Yaskawa Electric Corporation, General Electric Company, Tetra Pak International S.A., Veolia Environment S.A., and 3D Systems Corporation. Companies in the Sustainable Manufacturing Equipment Market are reinforcing their competitive position through continuous technology innovation and sustainability-focused product development. Many players are investing in automation, digital monitoring, and energy-optimized system designs to improve efficiency and reduce lifecycle costs. Strategic partnerships with industrial clients help tailor equipment to sector-specific sustainability goals. Firms are expanding global manufacturing and service networks to support faster deployment and localized compliance requirements.
Table of Contents
Chapter 1 Methodology & Scope
- 1.1 Market scope & definitions
- 1.2 Research design
- 1.2.1 Research approach
- 1.2.2 Data collection methods
- 1.3 Base estimates and calculations
- 1.3.1 Base year calculation
- 1.3.2 Market estimates & forecasts parameters
- 1.4 Forecast Model
- 1.4.1 Key trends for market estimates
- 1.4.2 Quantified market impact analysis
- 1.4.2.1 Mathematical impact of growth parameters on forecast
- 1.4.3 Scenario analysis framework
- 1.5 Primary research and validation
- 1.5.1 Some of the primary sources (but not limited to)
- 1.6 Data mining sources
- 1.6.1 Paid Sources
- 1.7 Primary research and validation
- 1.7.1 Primary sources
- 1.8 Research Trail & confidence scoring
- 1.8.1 Research trail components
- 1.8.2 Scoring components
- 1.9 Research transparency addendum
- 1.9.1 Source attribution framework
- 1.9.2 Quality assurance metrics
- 1.9.3 Our commitment to trust
- 1.10 Market Definitions
Chapter 2 Executive Summary
- 2.1 Industry 360° synopsis
- 2.2 Key market trends
- 2.2.1 Regional
- 2.2.2 Product Type
- 2.2.3 Automation
- 2.2.4 Application
- 2.2.5 Distribution channel
- 2.3 CXO perspectives: Strategic imperatives
- 2.3.1 Key decision points for industry executives
- 2.3.2 Critical success factors for market players
- 2.4 Future outlook and strategic recommendations
Chapter 3 Industry Insights
- 3.1 Industry ecosystem analysis
- 3.1.1 Supplier landscape
- 3.1.2 Profit margin
- 3.1.3 Value addition at each stage
- 3.1.4 Factor affecting the value chain
- 3.2 Industry impact forces
- 3.2.1 Growth drivers
- 3.2.1.1 Corporate commitments to net-zero emissions
- 3.2.1.2 Adoption of circular economy principles
- 3.2.1.3 Government regulations and incentives
- 3.2.2 Pitfalls & Challenges
- 3.2.2.1 High initial investment costs
- 3.2.2.2 Complexity of regulatory compliance
- 3.2.3 Opportunities
- 3.2.3.1 Growing demand for energy-efficient and low-emission equipment
- 3.2.3.2 Integration of circular economy principles
- 3.2.1 Growth drivers
- 3.3 Growth potential analysis
- 3.4 Future market trends
- 3.5 Technology and innovation landscape
- 3.5.1 Current technological trends
- 3.5.2 Emerging technologies
- 3.6 Price trends
- 3.6.1 By region
- 3.6.2 By product
- 3.7 Regulatory landscape
- 3.7.1 North America
- 3.7.1.1 US: Consumer Product Safety Commission (CPSC) 16 Code of Federal Regulations (CFR) part 1512
- 3.7.1.2 Canada: International Organization for Standardization (ISO) 4210
- 3.7.2 Europe
- 3.7.2.1 Germany: Deutsches Institut fur Normung (DIN) European Norm (EN) ISO 4210
- 3.7.2.2 UK: European Norm (EN) ISO 4210 / United Kingdom Conformity Assessed (UKCA)
- 3.7.2.3 France: European Norm (EN) ISO 4210
- 3.7.3 Asia Pacific
- 3.7.3.1 China: Guobiao (GB) 3565
- 3.7.3.2 India: Indian Standard (IS) 10613
- 3.7.3.3 Japan: Japanese Industrial Standard (JIS) D 9110
- 3.7.4 Latin America
- 3.7.4.1 Brazil: Associacao Brasileira de Normas Tecnicas (ABNT) Norma Brasileira (NBR) ISO 4210
- 3.7.4.2 Mexico: International Organization for Standardization (ISO) 4210
- 3.7.5 Middle East & Africa
- 3.7.5.1 South Africa: South African National Standard (SANS) 311
- 3.7.5.2 Saudi Arabia: Saudi Standards, Metrology and Quality Organization (SASO) Gulf Standardization Organization (GSO) ISO 4210
- 3.7.1 North America
- 3.8 Trade statistics
- 3.8.1 Major importing countries
- 3.8.2 Major exporting countries
- 3.9 Porter's analysis
- 3.10 PESTEL analysis
Chapter 4 Competitive Landscape, 2025
- 4.1 Introduction
- 4.2 Company market share analysis
- 4.2.1 By Region
- 4.2.1.1 North America
- 4.2.1.2 Europe
- 4.2.1.3 Asia Pacific
- 4.2.1.4 Latin America
- 4.2.1.5 Middle East & Africa
- 4.2.1 By Region
- 4.3 Company matrix analysis
- 4.4 Competitive analysis of major market players
- 4.5 Competitive positioning matrix
- 4.6 Key developments
- 4.6.1 Mergers & acquisitions
- 4.6.2 Partnerships & collaborations
- 4.6.3 New product launches
- 4.6.4 Expansion plans
Chapter 5 Market Estimates & Forecast, By Equipment Type, 2022 - 2035, (USD Billion) (Thousand Units)
- 5.1 Key trends
- 5.2 Energy-efficient machinery
- 5.3 Waste management equipment
- 5.4 Water & wastewater treatment equipment
- 5.5 Carbon emission control systems
- 5.6 Renewable energy integration equipment
- 5.7 Smart manufacturing & monitoring equipment
- 5.8 Sustainable packaging equipment
- 5.9 Additive manufacturing equipment
- 5.10 Others (material recovery systems, etc.)
Chapter 6 Market Estimates & Forecast, By End User Industry, 2022 - 2035, (USD Billion) (Thousand Units)
- 6.1 Key trends
- 6.2 Automotive
- 6.3 Electronics and semiconductors
- 6.4 Food and beverages
- 6.5 Chemical manufacturing
- 6.6 Pharmaceuticals
- 6.7 Metals and mining
- 6.8 Consumer goods
- 6.9 Others (textile manufacturing, etc.)
Chapter 7 Market Estimates & Forecast, By End Use, 2022 - 2035, (USD Billion) (Thousand Units)
- 7.1 Key trends
- 7.2 Large enterprises
- 7.3 Small & medium enterprises (SMEs)
- 7.4 Government & research institutes
- 7.5 Sustainable manufacturing startups
Chapter 8 Market Estimates & Forecast, By Distribution Channel, 2022 - 2035, (USD Billion) (Thousand Units)
- 8.1 Key trends
- 8.2 Direct
- 8.3 Indirect
Chapter 9 Market Estimates & Forecast, By Region, 2022 - 2035, (USD Billion) (Thousand Units)
- 9.1 Key trends
- 9.2 North America
- 9.2.1 U.S.
- 9.2.2 Canada
- 9.3 Europe
- 9.3.1 Germany
- 9.3.2 UK
- 9.3.3 France
- 9.3.4 Italy
- 9.3.5 Spain
- 9.4 Asia Pacific
- 9.4.1 China
- 9.4.2 India
- 9.4.3 Japan
- 9.4.4 South Korea
- 9.4.5 Australia
- 9.5 Latin America
- 9.5.1 Brazil
- 9.5.2 Mexico
- 9.5.3 Argentina
- 9.6 MEA
- 9.6.1 Saudi Arabia
- 9.6.2 UAE
- 9.6.3 South Africa
Chapter 10 Company Profiles
- 10.1 3D Systems Corporation
- 10.2 ABB Ltd.
- 10.3 Atlas Copco AB
- 10.4 Bosch Rexroth AG
- 10.5 Emerson Electric Co.
- 10.6 FANUC Corporation
- 10.7 General Electric (GE) Company
- 10.8 Honeywell International Inc.
- 10.9 Mitsubishi Electric Corporation
- 10.10 Rockwell Automation, Inc.
- 10.11 Schneider Electric SE
- 10.12 Siemens AG
- 10.13 Tetra Pak International S.A.
- 10.14 Veolia Environment S.A.
- 10.15 Yaskawa Electric Corporation
