
|
시장보고서
상품코드
1936620
카셰어링 시장 기회, 성장 촉진요인, 업계 동향 분석 및 예측(2026-2035년)Car Sharing Market Opportunity, Growth Drivers, Industry Trend Analysis, and Forecast 2026 - 2035 |
||||||
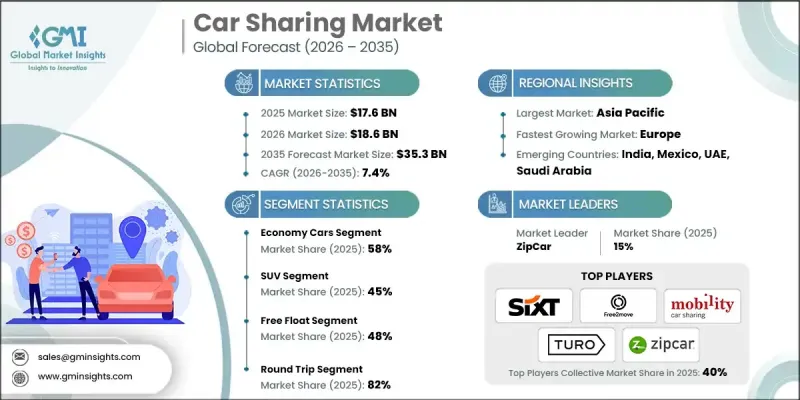
세계의 카셰어링 시장은 2025년에 176억 달러로 평가되었으며, 2035년까지 CAGR 7.4%로 성장하여 353억 달러에 달할 것으로 예측됩니다.

급속한 도시화로 인해 전 세계 도시에서 교통 체증, 주차 문제, 출퇴근 효율성 저하가 심각해지면서 대체 모빌리티 솔루션에 대한 수요가 증가하고 있습니다. 카셰어링은 차량에 대한 공유 액세스를 제공하고, 이용률을 최적화하고, 낭비되는 시간을 최소화함으로써 이러한 문제를 해결합니다. 도시 당국은 도로망과 주차 인프라가 부족한 인구 밀집 지역에서 공유형 모빌리티의 도입을 지원하고 있으며, 이는 보급을 가속화하고 있습니다. 이 분야의 기업들은 경쟁을 유지하기 위해 인수합병, 전략적 제휴와 같은 비유기적 성장 전략과 혁신적인 서비스 개발을 적극적으로 추진하고 있습니다. 구매, 유지관리, 연료, 보험, 주차 등 자동차 소유에 따른 비용 상승은 개인의 자가용 소유를 억제하는 요인으로 작용하고 있습니다. 카셰어링은 고정된 소유 비용을 종량제 비용으로 전환하여 경제적 유연성을 제공합니다. 이 모델은 도시 지역의 전문직 종사자, 비용에 민감한 가정, 그리고 가끔씩 차량을 이용하고자 하는 젊은 층의 소비자에게 강력하게 어필할 수 있습니다. 모바일 애플리케이션, GPS 추적, 텔레매틱스, 디지털 결제의 통합으로 편의성을 높이고, 원활한 예약, 실시간 차량 추적, 비접촉식 액세스를 통해 전반적인 사용자 경험과 운영 효율을 향상시킵니다.
| 시장 범위 | |
|---|---|
| 시작 연도 | 2025년 |
| 예측 연도 | 2026-2035 |
| 개시 금액 | 176억 달러 |
| 예측 금액 | 353억 달러 |
| CAGR | 7.4% |
이코노미카 부문은 2025년 58%의 점유율을 차지했으며, 2026년부터 2035년까지 CAGR 8%로 성장할 것으로 전망됩니다. 경제형 차량은 저렴한 렌탈료, 뛰어난 연비 효율성, 최소한의 유지보수 비용으로 인해 예산을 중시하는 도시 거주자들이 선호하고 있습니다. 단거리 이동이나 일상적인 이동에 적합하기 때문에 잦은 예약과 높은 가동률을 실현하고 있습니다. 그 결과, 경제형 차량은 전 세계 카셰어링 차량의 기반을 형성하고 있으며, 시장 성장 전략에서 중요한 요소로 자리 잡고 있습니다.
SUV 부문은 2025년 45%의 점유율을 차지했으며, 2026년부터 2035년까지 CAGR 7%로 성장할 것으로 전망됩니다. 공유 차량에서 SUV의 인기는 넓은 실내 공간, 높은 좌석 위치, 그리고 향상된 편안함이 뒷받침하고 있습니다. 사용자는 단체 여행, 가족 외출, 추가 수하물 용량이 필요한 여행에 SUV를 선호합니다. 다양한 이용 장면에 대응하는 범용성으로 인해 예약 빈도가 높아지고 공유 모빌리티 플랫폼 내에서의 채택이 증가하고 있습니다. 이에 따라 SUV는 이용률과 수익 극대화를 목표로 하는 차량 운영사에게 매우 중요한 부문이 되었습니다.
중국 카셰어링 시장은 2025년 38%의 점유율을 차지하며 25억 3,000만 달러의 수익을 창출했습니다. 중앙정부 및 지방정부 차원의 정부 정책은 보조금, 규제적 지원, 스마트 시티 구상 제공을 통해 공유 모빌리티와 전기자동차 보급을 적극적으로 추진하고 있습니다. 개인 차량 소유 감소, 배기가스 감축, 전기화 가속화를 목표로 하는 정책은 카셰어링 플랫폼의 확대에 긍정적인 영향을 미치고 있습니다. 특혜 라이선스, 전용 주차 공간, 전기자동차에 대한 재정 지원 등의 인센티브를 통해 차량 대수 증가를 촉진하고, 전국 주요 도시권에서 전기자동차 보급이 더욱 가속화되고 있습니다.
자주 묻는 질문
목차
제1장 조사 방법과 범위
제2장 주요 요약
제3장 업계 인사이트
제4장 경쟁 구도
제5장 시장 추정 및 예측 : 차종별, 2022-2035
제6장 시장 추정 및 예측 : 차량별, 2022-2035
제7장 시장 추정 및 예측 : 사업 모델별, 2022-2035
제8장 시장 추정 및 예측 : 모델별, 2022-2035
제9장 시장 추정 및 예측 : 최종 용도별, 2022-2035
제10장 시장 추정 및 예측 : 지역별, 2022-2035
제11장 시장 추정 및 예측 : 추진력별, 2022-2035
제12장 시장 추정 및 예측 : 지역별, 2022-2035
제13장 기업 개요
KSM 26.03.05The Global Car Sharing Market was valued at USD 17.6 billion in 2025 and is estimated to grow at a CAGR of 7.4% to reach USD 35.3 billion by 2035.
Rapid urbanization has intensified traffic congestion, parking challenges, and commuting inefficiencies in cities worldwide, creating demand for alternative mobility solutions. Car sharing addresses these issues by offering shared access to vehicles, optimizing utilization, and minimizing wasted time. Urban authorities are supporting the adoption of shared mobility in densely populated areas with limited road networks and parking infrastructure, which accelerates implementation. Companies in this sector are actively pursuing inorganic growth strategies such as mergers, acquisitions, strategic partnerships, and launching innovative services to remain competitive. Rising costs associated with car ownership, including purchase, maintenance, fuel, insurance, and parking, are discouraging individuals from owning personal vehicles. Car sharing allows users to convert fixed ownership costs into usage-based expenses, providing financial flexibility. This model appeals strongly to urban professionals, cost-conscious households, and younger consumers seeking occasional vehicle access. The integration of mobile applications, GPS tracking, telematics, and digital payments has enhanced convenience, enabling seamless booking, real-time vehicle tracking, and contactless access, which improves overall user experience and operational efficiency.
| Market Scope | |
|---|---|
| Start Year | 2025 |
| Forecast Year | 2026-2035 |
| Start Value | $17.6 Billion |
| Forecast Value | $35.3 Billion |
| CAGR | 7.4% |
The economy car segment held 58% share in 2025 and is projected to grow at a CAGR of 8% from 2026 to 2035. Economy vehicles are favored by budget-conscious city dwellers because of their low rental fees, fuel efficiency, and minimal maintenance costs. They are ideal for short-distance trips and everyday travel, which drives frequent bookings and high utilization rates. Consequently, economy cars form the backbone of most car sharing fleets worldwide and remain a critical component of the market's growth strategy.
The SUV segment accounted for 45% share in 2025 and is anticipated to grow at a CAGR of 7% from 2026 to 2035. The popularity of SUVs in shared fleets is driven by their spacious interiors, elevated seating, and enhanced comfort. Users often prefer SUVs for group travel, family outings, and trips requiring extra luggage capacity. Their versatility across different usage scenarios leads to higher booking frequency and increased adoption within shared mobility platforms, making them a vital segment for fleet operators seeking to maximize utilization and revenue.
China Car Sharing Market held 38% share, generating USD 2.53 billion in 2025. Government initiatives at the central and municipal levels are actively promoting shared mobility and electric vehicle adoption by providing subsidies, regulatory support, and smart city initiatives. Policies targeting a reduction in personal vehicle ownership, lower emissions, and accelerated electrification have positively impacted the expansion of car sharing platforms. Incentives such as preferential licensing, dedicated parking, and financial support for electric vehicles have strengthened fleet growth and encouraged greater adoption of EVs in major urban centers across the country.
Prominent companies in the Global Car Sharing Market include Turo, Sixt, Getaround, Zipcar, Cambio Mobilitats Service, Communauto, Free2Move, GoGet, EKAR FZ, and Mobility Carsharing. Leading firms in the Car Sharing Market are pursuing strategic initiatives to solidify their presence and expand their market share. These strategies include forming alliances and partnerships with automotive manufacturers and technology providers, integrating digital platforms for seamless booking and fleet management, and adopting innovative pricing models to attract diverse customer segments. Companies are also expanding their electric vehicle fleets, investing in smart mobility solutions, and exploring mergers and acquisitions to strengthen geographic reach.
Table of Contents
Chapter 1 Methodology & Scope
- 1.1 Research approach
- 1.2 Quality Commitments
- 1.2.1 GMI AI policy & data integrity commitment
- 1.2.1.1 Source consistency protocol
- 1.2.1 GMI AI policy & data integrity commitment
- 1.3 Research Trail & Confidence Scoring
- 1.3.1 Research Trail Components
- 1.3.2 Scoring Components
- 1.4 Data Collection
- 1.4.1 Partial list of primary sources
- 1.5 Data mining sources
- 1.5.1 Paid sources
- 1.5.1.1 Sources, by region
- 1.5.1 Paid sources
- 1.6 Base estimates and calculations
- 1.6.1 Base year calculation for any one approach
- 1.7 Forecast model
- 1.7.1 Quantified market impact analysis
- 1.7.1.1 Mathematical impact of growth parameters on forecast
- 1.7.1 Quantified market impact analysis
- 1.8 Research transparency addendum
- 1.8.1 Source attribution framework
- 1.8.2 Quality assurance metrics
- 1.8.3 Our commitment to trust
Chapter 2 Executive Summary
- 2.1 Industry 360° synopsis, 2022 - 2035
- 2.2 Key market trends
- 2.2.1 Regional
- 2.2.2 Vehicle class
- 2.2.3 Vehicle
- 2.2.4 Business model
- 2.2.5 Model
- 2.2.6 End use
- 2.2.7 Area
- 2.2.8 Propulsion
- 2.3 TAM Analysis, 2026-2035
- 2.4 CXO perspectives: Strategic imperatives
- 2.4.1 Executive decision points
- 2.4.2 Critical success factors
- 2.5 Future outlook and strategic recommendations
Chapter 3 Industry Insights
- 3.1 Industry ecosystem analysis
- 3.1.1 Supplier landscape
- 3.1.2 Profit margin analysis
- 3.1.3 Cost structure
- 3.1.4 Value addition at each stage
- 3.1.5 Factor affecting the value chain
- 3.1.6 Disruptions
- 3.2 Industry impact forces
- 3.2.1.1 Growth drivers
- 3.2.1.2 Rising urban congestion and parking constraints
- 3.2.1.3 Growth of app-based mobility platforms
- 3.2.1.4 Increasing cost of vehicle ownership
- 3.2.1.5 Expansion of electric vehicle fleets
- 3.2.2 Industry pitfalls and challenges
- 3.2.2.1 High fleet acquisition and maintenance costs
- 3.2.2.2 Regulatory complexity across regions
- 3.2.3 Market opportunities
- 3.2.3.1 Integration with public transportation systems
- 3.2.3.2 Corporate and enterprise car sharing
- 3.2.3.3 Growth of electric and autonomous vehicles
- 3.2.3.4 Expansion into emerging urban markets
- 3.3 Growth potential analysis
- 3.4 Regulatory landscape
- 3.4.1 North America
- 3.4.1.1 U.S. National Highway Traffic Safety Administration (NHTSA) Regulations
- 3.4.1.2 Environmental Protection Agency (EPA) Emission Standards
- 3.4.1.3 California Air Resources Board (CARB) Standards
- 3.4.2 Europe
- 3.4.2.1 European Union General Safety Regulation (EU GSR)
- 3.4.2.2 EU Directive on End-of-Life Vehicles (ELV)
- 3.4.2.3 European Commission Safety Standards for Passenger Vehicles
- 3.4.2.4 European Union Type Approval Process
- 3.4.3 Asia Pacific
- 3.4.3.1 China National Standards for Vehicle Safety
- 3.4.3.2 India Bureau of Indian Standards (BIS)
- 3.4.3.3 Japan Ministry of Land, Infrastructure, Transport and Tourism (MLIT) Regulations
- 3.4.3.4 ASEAN Automotive Safety Standards
- 3.4.4 Latin America
- 3.4.4.1 Brazil National Traffic Department (DENATRAN) Standards
- 3.4.4.2 Argentina National Road Safety Agency (ANSV) Regulations
- 3.4.4.3 Mexico Secretariat of Communications and Transport (SCT) Regulations
- 3.4.4.4 MERCOSUR Harmonization of Vehicle Safety Standards
- 3.4.5 Middle East & Africa
- 3.4.5.1 UAE Federal Vehicle Safety Law
- 3.4.5.2 Saudi Arabian Standards Organization (SASO) Vehicle Safety Regulations
- 3.4.5.3 South African Bureau of Standards (SABS) AUTOMOTIVE REGULATIONS
- 3.4.1 North America
- 3.5 Porter's analysis
- 3.6 PESTEL analysis
- 3.7 Technology and innovation landscape
- 3.7.1 Current technological trends
- 3.7.2 Emerging technologies
- 3.8 Price trends
- 3.8.1 By region
- 3.8.2 By product
- 3.9 Production statistics
- 3.9.1 Production hubs
- 3.9.2 Consumption hubs
- 3.9.3 Export and import
- 3.10 Cost breakdown analysis
- 3.11 Patent analysis
- 3.12 Sustainability and environmental aspects
- 3.12.1 Sustainable practices
- 3.12.2 Waste reduction strategies
- 3.12.3 Energy efficiency in production
- 3.12.4 Eco-friendly Initiatives
- 3.12.5 Carbon footprint considerations
Chapter 4 Competitive Landscape, 2025
- 4.1 Introduction
- 4.2 Company market share analysis
- 4.2.1 North America
- 4.2.2 Europe
- 4.2.3 Asia Pacific
- 4.2.4 LATAM
- 4.2.5 MEA
- 4.3 Competitive analysis of major market players
- 4.4 Competitive positioning matrix
- 4.5 Strategic outlook matrix
- 4.6 Key developments
- 4.6.1 Mergers & acquisitions
- 4.6.2 Partnerships & collaborations
- 4.6.3 New Product Launches
- 4.6.4 Expansion Plans and funding
Chapter 5 Market Estimates & Forecast, By Vehicle Class, 2022 - 2035 ($Mn, Fleet Size)
- 5.1 Key trends
- 5.2 Economy cars
- 5.3 Mid-Range cars
- 5.4 Executive cars
Chapter 6 Market Estimates & Forecast, By Vehicle, 2022 - 2035 ($Mn, Fleet Size)
- 6.1 Key trends
- 6.2 Hatchback
- 6.3 Sedan
- 6.4 SUV
- 6.5 Others
Chapter 7 Market Estimates & Forecast, By Business Model, 2022 - 2035 ($Mn, Fleet Size)
- 7.1 Key trends
- 7.2 Round trip
- 7.3 One way
Chapter 8 Market Estimates & Forecast, By Model, 2022 - 2035 ($Mn, Fleet Size)
- 8.1 Key trends
- 8.2 Free float
- 8.3 Stationary
- 8.4 Peer to Peer
Chapter 9 Market Estimates & Forecast, By End Use, 2022 - 2035 ($Mn, Fleet Size)
- 9.1 Key trends
- 9.2 Individual
- 9.3 Business
- 9.4 Government agencies
- 9.5 Non-profit organizations
Chapter 10 Market Estimates & Forecast, By Area, 2022 - 2035 ($Mn, Fleet Size)
- 10.1 Key trends
- 10.2 Intercity
- 10.3 Intracity
Chapter 11 Market Estimates & Forecast, By Propulsion, 2022 - 2035 ($Mn, Fleet Size)
- 11.1 Key trends
- 11.2 Gasoline
- 11.3 Diesel
- 11.4 BEV
- 11.5 PHEV
- 11.6 HEV
- 11.7 Others
Chapter 12 Market Estimates & Forecast, By Region, 2022 - 2035 ($Mn, Fleet Size)
- 12.1 Key trends
- 12.2 North America
- 12.2.1 US
- 12.2.2 Canada
- 12.3 Europe
- 12.3.1 UK
- 12.3.2 Germany
- 12.3.3 France
- 12.3.4 Italy
- 12.3.5 Spain
- 12.3.6 Russia
- 12.3.7 Denmark
- 12.4 Asia Pacific
- 12.4.1 China
- 12.4.2 India
- 12.4.3 Japan
- 12.4.4 South Korea
- 12.4.5 ANZ
- 12.4.6 Singapore
- 12.5 Latin America
- 12.5.1 Brazil
- 12.5.2 Argentina
- 12.5.3 Mexico
- 12.6 MEA
- 12.6.1 UAE
- 12.6.2 Saudi Arabia
- 12.6.3 South Africa
Chapter 13 Company Profiles
- 13.1 Global Players
- 13.1.1 Communauto
- 13.1.2 EKAR FZ
- 13.1.3 Enterprise CarShare
- 13.1.4 Evo Car Share
- 13.1.5. Free2 Move
- 13.1.6 Getaround
- 13.1.7 GoGet
- 13.1.8 Greenwheels
- 13.2 Regional Players
- 13.2.1 BlueSG
- 13.2.2 Bolt
- 13.2.3 Cambio Mobilitats Service
- 13.2.4 Cityhop
- 13.2.5 HiyaCar
- 13.2.6 HOURCAR
- 13.2.7 Mobility Carsharing
- 13.3 Emerging Players
- 13.3.1 Modo Carsharing
- 13.3.2 Sixt
- 13.3.3 Turo
- 13.3.4 Zipcar
- 13.3.5 Zoomcar
