
|
시장보고서
상품코드
1936650
가상발전소 시장 기회, 성장 촉진요인, 업계 동향 분석 및 예측(2026-2035년)Virtual Power Plant Market Opportunity, Growth Drivers, Industry Trend Analysis, and Forecast 2026 - 2035 |
||||||
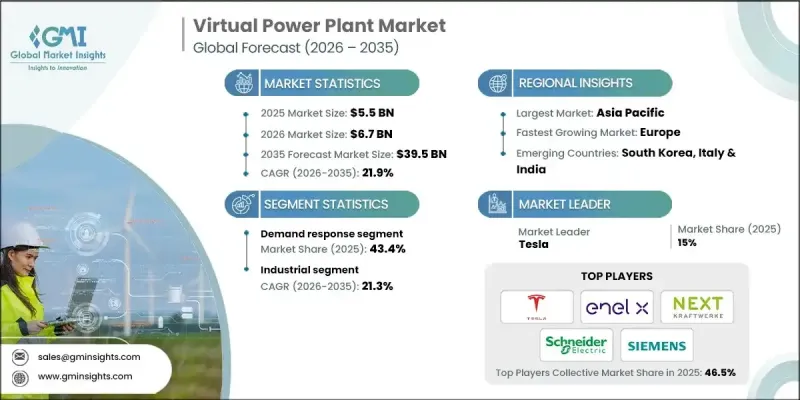
세계의 가상발전소(VPP) 시장은 2025년에 55억 달러로 평가되었으며, 2035년까지 CAGR 21.9%로 성장하여 395억 달러에 달할 것으로 예측됩니다.

가상발전소(VPP)는 태양광 패널, 풍력 터빈, 축전지, 수요 반응 메커니즘과 같은 분산형 에너지 자원을 하나의 지능적으로 관리되는 네트워크로 통합함으로써 현대 에너지 시스템의 진화를 촉진하고 있습니다. 발전, 저장, 소비를 통합함으로써 VPP는 에너지 배전을 최적화하고, 송전망의 신뢰성을 향상시키며, 재생에너지 발전의 보급률을 높이는 동시에 이산화탄소 배출량을 줄일 수 있습니다. 첨단 에너지 저장 시스템, 특히 리튬이온 배터리의 급속한 보급으로 사업자는 수요가 적은 시간대에 잉여 전력을 저장했다가 필요할 때 방출하여 전력 계통의 안정성과 효율성을 높일 수 있게 되었습니다. 머신러닝, 첨단 통신 기술, 실시간 분석의 통합으로 운영 성능, 예지보전, 비용 최적화를 더욱 향상시킬 수 있습니다. 유틸리티 사업자와 소비자가 유연하고 탄력적이며 지속가능한 에너지 솔루션을 찾는 가운데, VPP의 중요성은 점점 더 커지고 있습니다.
| 시장 범위 | |
|---|---|
| 시작 연도 | 2025년 |
| 예측 연도 | 2026-2035 |
| 개시 금액 | 55억 달러 |
| 예측 금액 | 395억 달러 |
| CAGR | 21.9% |
혼합 자산 부문은 태양광 패널, 풍력 터빈, 축전지 시스템, 제어 가능한 부하 등 다양한 분산형 에너지 자원의 통합으로 2035년까지 CAGR 22.1%로 성장할 것으로 예상됩니다. 이러한 다양한 자원을 통합함으로써 가상발전소(VPP)는 간헐적인 에너지 생산과 변동하는 수요의 균형을 맞추고, 전력 계통의 신뢰성을 높이며, 실시간 에너지 배분을 최적화할 수 있습니다. 이러한 멀티 리소스 접근 방식을 통해 유틸리티 및 사업자는 피크 부하를 보다 효과적으로 관리하고, 기존 발전 의존도를 낮추며, 전력 계통의 안정성을 유지하면서 대규모 재생에너지 도입을 지원할 수 있습니다.
주택 부문은 지붕형 태양광발전 시스템, 가정용 축전지, 전기자동차 충전기 도입 증가에 힘입어 2026년부터 2035년까지 연평균 22.5%의 성장률을 보일 것으로 예측됩니다. 주택 소유주들은 에너지 사용 최적화, 전기요금 절감, 잉여전력 판매를 통한 추가 수익 창출을 목적으로 VPP 프로그램에 적극적으로 참여하고 있습니다. 지속가능성에 대한 소비자의 인식 향상, 청정에너지 도입에 대한 인센티브, 스마트홈 통합의 발전과 함께 주거용 분산형 에너지 자원의 VPP 네트워크 통합이 가속화되고 있습니다.
미국 가상발전소 시장은 87.9%의 점유율을 차지하며 2035년까지 115억 달러 규모로 성장할 것으로 예측됩니다. 시장 확대의 배경에는 노후화된 인프라, 이상기후, 전력 수요 증가로 인한 송전망의 신뢰성 문제가 있습니다. VPP는 분산형 자원을 활용하여 피크 부하 시 전력망 안정화에 필수적인 유연성을 제공합니다. 재생에너지 및 에너지 저장에 대한 연방 보조금과 세제 혜택을 포함한 정부 지원책은 가상발전소 솔루션의 도입과 보급을 더욱 촉진하고 있습니다.
자주 묻는 질문
목차
제1장 조사 방법과 범위
제2장 주요 요약
제3장 업계 인사이트
제4장 경쟁 구도
제5장 시장 규모 및 예측 : 기술별, 2022-2035
제6장 시장 규모 및 예측 : 최종 용도별, 2022-2035
제7장 시장 규모 및 예측 : 지역별, 2022-2035
제8장 기업 개요
KSM 26.03.05The Global Virtual Power Plant Market was valued at USD 5.5 billion in 2025 and is estimated to grow at a CAGR of 21.9% to reach USD 39.5 billion by 2035.
Virtual power plants (VPPs) are driving the evolution of modern energy systems by combining decentralized energy resources such as solar panels, wind turbines, batteries, and demand-response mechanisms into a single, intelligently managed network. By aggregating generation, storage, and consumption, VPPs optimize energy dispatch, improve grid reliability, and enable higher penetration of renewable energy while reducing carbon emissions. The rapid adoption of advanced energy storage systems, particularly lithium-ion batteries, allows operators to store excess power during low-demand periods and release it when needed, supporting grid stability and efficiency. Integration of machine learning, advanced communication technologies, and real-time analytics further enhances operational performance, predictive maintenance, and cost optimization. VPPs are increasingly essential as utilities and consumers seek flexible, resilient, and sustainable energy solutions.
| Market Scope | |
|---|---|
| Start Year | 2025 |
| Forecast Year | 2026-2035 |
| Start Value | $5.5 Billion |
| Forecast Value | $39.5 Billion |
| CAGR | 21.9% |
The mixed assets segment is projected to grow at a CAGR of 22.1% through 2035, driven by the integration of varied distributed energy resources such as solar panels, wind turbines, battery storage systems, and controllable loads. By aggregating these diverse resources, virtual power plants can balance intermittent energy generation with fluctuating demand, enhance grid reliability, and optimize energy dispatch in real time. This multi-resource approach also enables utilities and operators to manage peak loads more effectively, reduce reliance on conventional power generation, and support large-scale renewable adoption while maintaining grid stability.
The residential segment is expected to grow at a CAGR of 22.5% through 2026-2035, propelled by increasing adoption of rooftop solar installations, home battery storage, and electric vehicle chargers. Homeowners are actively participating in VPP programs to optimize energy usage, cut electricity expenses, and generate additional revenue by selling excess power to the grid. The combination of rising consumer awareness of sustainability, incentives for clean energy adoption, and smart home integration is accelerating the integration of residential distributed energy resources into VPP networks.
U.S. Virtual Power Plant Market held 87.9% share and is expected to generate USD 11.5 billion by 2035. Market expansion is driven by challenges related to grid reliability caused by aging infrastructure, extreme weather events, and rising electricity demand. VPPs provide critical flexibility by leveraging distributed resources to stabilize the grid during peak loads. Supportive government measures, including federal grants and tax incentives for renewable energy and energy storage, are further encouraging deployment and adoption of virtual power plant solutions.
Key players in the Global Virtual Power Plant Market include AGL Energy, Bosch Global, Enbala Power Networks, Enel X, EnergyHub, ENGIE, Flexitricity, Hitachi, Lumenaza, Next Kraftwerke, Schneider Electric, Shell, Siemens, Statkraft, Sunrun, Sunnova Energy International, Tesla, Tiko Energy Solutions, Toshiba Corporation, and Virtual Peaker. Companies in the virtual power plant market are focusing on expanding their footprint by developing integrated software platforms for energy management, forming strategic partnerships with utilities and energy providers, and investing in advanced analytics and predictive maintenance solutions. They are diversifying product portfolios to include both residential and commercial applications, enhancing scalability, and improving interoperability across distributed energy resources. Key strategies also include acquiring startups or smaller technology providers to gain innovative solutions, collaborating with regulators to ensure compliance, and offering flexible financing models to accelerate customer adoption of VPP solutions.
Table of Contents
Chapter 1 Methodology & Scope
- 1.1 Research design
- 1.2 Quality commitment
- 1.2.1 GMI AI policy & data integrity commitment
- 1.2.1.1 Source consistency protocol
- 1.2.1 GMI AI policy & data integrity commitment
- 1.3 Research Trail & Confidence Scoring
- 1.3.1 Research Trail Components
- 1.3.2 Scoring Components
- 1.4 Data Collection
- 1.4.1 Partial list of primary sources
- 1.5 Data mining sources
- 1.5.1 Paid sources
- 1.5.1.1 Sources, by region
- 1.5.1 Paid sources
- 1.6 Base estimates and calculations
- 1.6.1 Base year calculation for any one approach
- 1.7 Forecast model
- 1.8 Research transparency addendum
- 1.8.1 Source attribution framework
- 1.8.2 Quality assurance metrics
- 1.8.3 Our commitment to trust
- 1.9 Market definitions
Chapter 2 Executive Summary
- 2.1 Industry synopsis, 2022 - 2035
- 2.2 Business trends
- 2.3 Technology trends
- 2.4 End use trends
- 2.5 Regional trends
Chapter 3 Industry Insights
- 3.1 Industry ecosystem
- 3.1.1 Raw material availability & sourcing analysis
- 3.1.2 Manufacturing capacity assessment
- 3.1.3 Supply chain resilience & risk factors
- 3.1.4 Distribution network analysis
- 3.2 Regulatory landscape
- 3.3 Industry impact forces
- 3.3.1 Growth drivers
- 3.3.2 Industry pitfalls & challenges
- 3.4 Growth potential analysis
- 3.5 Cost structure analysis
- 3.6 Porter's analysis
- 3.6.1 Bargaining power of suppliers
- 3.6.2 Bargaining power of buyers
- 3.6.3 Threat of new entrants
- 3.6.4 Threat of substitutes
- 3.7 PESTEL analysis
- 3.7.1 Political factors
- 3.7.2 Economic factors
- 3.7.3 Social factors
- 3.7.4 Technological factors
- 3.7.5 Legal factors
- 3.7.6 Environmental factors
- 3.8 Emerging opportunities & trends
- 3.8.1 Digitalization & IoT integration
- 3.8.2 Emerging market penetration
- 3.9 Investment analysis and future outlook
Chapter 4 Competitive landscape, 2025
- 4.1 Introduction
- 4.2 Company market share analysis, by region, 2025
- 4.2.1 North America
- 4.2.2 Europe
- 4.2.3 Asia Pacific
- 4.2.4 Rest of world
- 4.3 Strategic dashboard
- 4.4 Strategic initiatives
- 4.5 Company benchmarking
- 4.6 Innovation & technology landscape
Chapter 5 Market Size and Forecast, By Technology, 2022 - 2035 (USD Billion)
- 5.1 Key trends
- 5.2 Distributed energy resource
- 5.3 Demand response
- 5.4 Mixed asset
Chapter 6 Market Size and Forecast, By End Use, 2022 - 2035 (USD Billion)
- 6.1 Key trends
- 6.2 Residential
- 6.3 Industrial
- 6.4 Commercial
Chapter 7 Market Size and Forecast, By Region, 2022 - 2035 (USD Billion)
- 7.1 Key trends
- 7.2 North America
- 7.2.1 U.S.
- 7.2.2 Canada
- 7.3 Europe
- 7.3.1 Germany
- 7.3.2 France
- 7.3.3 UK
- 7.3.4 Italy
- 7.4 Asia Pacific
- 7.4.1 China
- 7.4.2 Japan
- 7.4.3 South Korea
- 7.4.4 India
- 7.5 Rest of world
Chapter 8 Company Profiles
- 8.1 AGL Energy
- 8.2 Bosch Global
- 8.3 Enbala Power Networks
- 8.4 Enel X
- 8.5 EnergyHub
- 8.6 ENGIE
- 8.7 Flexitricity
- 8.8 Hitachi
- 8.9 Lumenaza
- 8.10 Next Kraftwerke
- 8.11 Schneider Electric
- 8.12 Shell
- 8.13 Siemens
- 8.14 Statkraft
- 8.15 Sunrun
- 8.16 Sunnova Energy International
- 8.17 Tesla
- 8.18 Tiko Energy Solutions
- 8.19 Toshiba Corporation
- 8.20 Virtual Peaker
