
|
시장보고서
상품코드
1936658
통합 항해 시스템(IBS) 시장 기회, 성장 촉진요인, 업계 동향 분석 및 예측(2026-2035년)Integrated Bridge Systems Market Opportunity, Growth Drivers, Industry Trend Analysis, and Forecast 2026 - 2035 |
||||||
세계의 통합 항해 시스템(IBS) 시장은 2025년에 71억 3,000만 달러로 평가되었으며, 2035년까지 CAGR 7.2%로 성장하여 140억 7,000만 달러에 달할 것으로 예측됩니다.
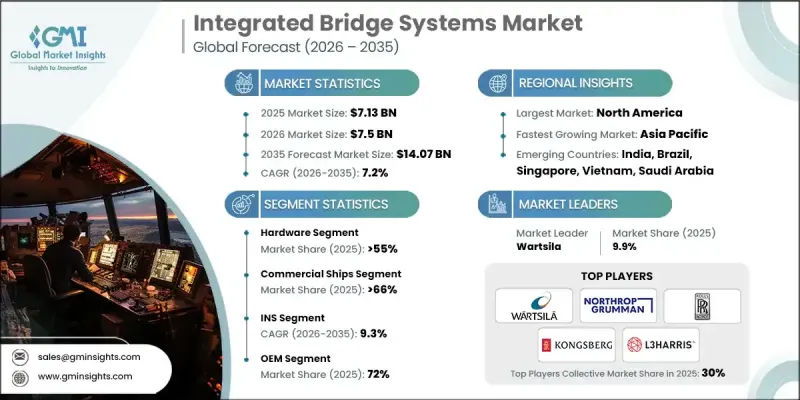
국제 해상 무역의 확대와 지속적인 선대 갱신 노력은 신조선 건조를 촉진하고 있으며, 이는 항해 효율성, 항해 계획의 정확성, 운영 조정을 향상시키는 공장 설치형 통합 항해 시스템(IBS)에 대한 수요를 직접적으로 증가시키고 있습니다. 선주 및 선사는 연료 소비와 전체 항해 비용을 줄이면서 장거리 운항 최적화에 점점 더 집중하고 있습니다. 통합 항해 시스템(IBS)은 단일 지휘 환경 내에서 항행 인텔리전스, 성능 분석, 실시간 운영 데이터를 통합하여 이러한 목표를 달성할 수 있도록 지원합니다. 디지털 기술을 탑재한 선박이 증가함에 따라 상황 인식을 향상시키면서 승무원의 작업 부하를 최소화하는 중앙 집중식 제어 시스템의 필요성이 더욱 커지고 있습니다. 항해 안전, 모니터링 투명성, 표준화된 운영 관행에 대한 규제 압력으로 인해 민간 및 정부 운영 선단 전체에 대한 도입이 지속적으로 추진되고 있습니다. 해상 운영이 데이터 집약적이고 자동화 중심이 됨에 따라 통합 항해 시스템(IBS)은 현대 선박 구조의 핵심 구성요소로 자리매김하고 있습니다.
| 시장 범위 | |
|---|---|
| 시작 연도 | 2025년 |
| 예측 연도 | 2026-2035 |
| 개시 금액 | 71억 3,000만 달러 |
| 예측 금액 | 140억 7,000만 달러 |
| CAGR | 7.2% |
2025년 하드웨어 부문은 55%의 점유율을 차지하고 2035년까지 73억 5,000만 달러에 달할 것으로 예측됩니다. 통합 항해 시스템(IBS) 내 하드웨어는 디스플레이 해상도 향상, 모듈식 시스템 설계, 운영 안정성 향상, 여러 선박 카테고리에 걸쳐 고도의 자동화를 지원하는 중복성 중심의 아키텍처를 통해 계속 진화하고 있습니다.
2025년에는 상선 부문이 66%의 점유율을 차지하여 47억 3,000만 달러의 시장 규모를 창출했습니다. 이 부문의 도입은 안전 규제 대응, 항해 효율성 향상, 통합 디지털 항해 및 제어 플랫폼을 통한 대규모 운항 지원의 필요성에 의해 추진되고 있습니다.
미국 통합 항해 시스템(IBS) 시장은 2025년 15억 2,000만 달러로 평가되었습니다. 현재 진행 중인 함대 갱신 및 현대화 프로그램은 높은 수준의 운영 요건과 장기적인 임무 신뢰성을 지원하기 위해 설계된 안전하고 상호 운용성이 뛰어나며 내결함성이 뛰어난 교량 시스템에 대한 수요를 주도하고 있습니다. 디지털 보안에 대한 관심이 높아지면서 항해 및 제어 시스템을 잠재적 장애로부터 보호하는 사이버 내결함성 아키텍처의 도입이 가속화되고 있습니다.
자주 묻는 질문
목차
제1장 조사 방법
제2장 주요 요약
제3장 업계 인사이트
제4장 경쟁 구도
제5장 시장 추정 및 예측 : 구성요소별, 2022-2035
제6장 시장 추정 및 예측 : 선박별, 2022-2035
제7장 시장 추정 및 예측 : 서브시스템별, 2022-2035
제8장 시장 추정 및 예측 : 최종 용도별, 2022-2035
제9장 시장 추정 및 예측 : 통합 레벨별, 2022-2035
제10장 시장 추정 및 예측 : 지역별, 2022-2035
제11장 기업 개요
KSM 26.03.05The Global Integrated Bridge Systems Market was valued at USD 7.13 billion in 2025 and is estimated to grow at a CAGR of 7.2% to reach USD 14.07 billion by 2035.

Rising international seaborne trade and continuous fleet renewal initiatives are driving the construction of new vessels, which directly increases demand for factory-installed integrated bridge systems that enhance navigational efficiency, voyage planning accuracy, and operational coordination. Shipowners and operators are increasingly focused on optimizing long-distance operations while reducing fuel consumption and overall voyage costs. Integrated bridge systems support these objectives by combining navigation intelligence, performance analytics, and real-time operational data within a single command environment. The growing presence of digitally enabled vessels is further reinforcing the need for centralized control systems that improve situational awareness while minimizing crew workload. Regulatory pressure related to navigation safety, monitoring transparency, and standardized operational practices continues to drive adoption across commercial and government-operated fleets. As maritime operations become more data-intensive and automation-driven, integrated bridge systems are positioned as a core component of modern vessel architecture.
| Market Scope | |
|---|---|
| Start Year | 2025 |
| Forecast Year | 2026-2035 |
| Start Value | $7.13 Billion |
| Forecast Value | $14.07 Billion |
| CAGR | 7.2% |
In 2025, the hardware segment held 55% share and is forecast to reach USD 7.35 billion by 2035. Hardware within integrated bridge systems continues to advance through improved display resolution, modular system design, and redundancy-focused architectures that enhance operational reliability and support higher levels of automation across multiple vessel categories.
The commercial ships segment accounted for 66% share in 2025 and generated USD 4.73 billion. Adoption within this segment is driven by the need to meet safety regulations, improve voyage efficiency, and support large-scale operations through integrated digital navigation and control platforms.
US Integrated Bridge Systems Market was valued at USD 1.52 billion in 2025. Ongoing fleet upgrades and modernization programs are driving demand for secure, interoperable, and resilient bridge systems designed to support advanced operational requirements and long-term mission reliability. Rising concerns around digital security are also accelerating the adoption of cyber-resilient architectures that protect navigation and control systems from potential disruptions.
Key companies operating in the Global Integrated Bridge Systems Market include Kongsberg Gruppen, Wartsila, Furuno Electric, Rolls-Royce, Northrop Grumman, L3Harris Technologies, Tokyo Keiki, Japan Radio Company, Alphatron Marine, and Consilium. Companies in the integrated bridge systems market strengthen their market position by investing in advanced digital navigation platforms and scalable system architectures. Many focus on integrating automation-ready hardware with intelligent software to support future vessel upgrades. Strategic partnerships with shipbuilders and fleet operators enable early system integration and long-term service contracts. Firms also emphasize compliance with evolving regulatory standards while improving cybersecurity and system redundancy. Expanding global service networks and lifecycle support capabilities helps maintain customer retention. Continuous innovation in display technologies, data fusion, and decision-support tools allows companies to differentiate offerings and capture a greater share across both commercial and government maritime sectors.
Table of Contents
Chapter 1 Methodology
- 1.1 Research approach
- 1.2 Quality commitments
- 1.2.1 GMI AI policy & data integrity commitment
- 1.3 Research trail & confidence scoring
- 1.3.1 Research trail components
- 1.3.2 Scoring components
- 1.4 Data collection
- 1.4.1 Partial list of primary sources
- 1.5 Data mining sources
- 1.5.1 Paid sources
- 1.6 Base estimates and calculations
- 1.6.1 Base year calculation
- 1.7 Forecast
- 1.8 Research transparency addendum
Chapter 2 Executive Summary
- 2.1 Industry 360° synopsis, 2022 - 2035
- 2.2 Key market trends
- 2.2.1 Regional
- 2.2.2 Component
- 2.2.3 Ship
- 2.2.4 Sub system
- 2.2.5 Level of integration
- 2.2.6 End use
- 2.3 TAM Analysis, 2026-2034
- 2.4 CXO perspectives: Strategic imperatives
- 2.4.1 Executive decision points
- 2.4.2 Critical success factors
- 2.5 Future outlook & strategic recommendations
Chapter 3 Industry Insights
- 3.1 Industry ecosystem analysis
- 3.1.1 Supplier landscape
- 3.1.2 Profit margin analysis
- 3.1.3 Cost structure
- 3.1.4 Value addition at each stage
- 3.1.5 Factor affecting the value chain
- 3.1.6 Disruptions
- 3.2 Industry impact forces
- 3.2.1.1 Growth drivers
- 3.2.1.2 Rising adoption of smart and autonomous vessels
- 3.2.1.3 Stringent international maritime safety regulations
- 3.2.1.4 Growth in global seaborne trade
- 3.2.1.5 Need for fuel efficiency and voyage optimization
- 3.2.1.6 Technological advancements in marine electronics
- 3.2.2 Industry pitfalls and challenges
- 3.2.2.1 High initial installation and integration costs
- 3.2.2.2 Complexity of retrofitting existing vessels
- 3.2.3 Market opportunities
- 3.2.3.1 Expansion of fully integrated bridge systems
- 3.2.3.2 Rising demand from emerging maritime economies
- 3.2.3.3 Digitalization and data analytics integration
- 3.2.3.4 Naval and defence fleet modernization programs
- 3.3 Growth potential analysis
- 3.4 Regulatory landscape
- 3.4.1 North America
- 3.4.1.1 United States: U.S. Coast Guard Navigation and Vessel Inspection Circular (NVIC) 01-20 - Maritime Cyber Risk Management
- 3.4.1.2 Canada: Canada Shipping Act, 2001 - Marine Safety Regulations
- 3.4.2 Europe
- 3.4.2.1 United Kingdom: Merchant Shipping (Safety of Navigation) Regulations
- 3.4.2.2 Germany: BSH Type Approval Requirements for Integrated Navigation Systems
- 3.4.2.3 France: SOLAS- Ship Navigation Equipment Requirements
- 3.4.2.4 Italy: IMO SOLAS- Integrated Bridge and Navigation Systems
- 3.4.2.5 Spain: EU Marine Equipment Directive (MED) - Navigation Equipment
- 3.4.3 Asia Pacific
- 3.4.3.1 China: China Classification Society Rules for Navigation Equipment and IBS
- 3.4.3.2 Japan: MLIT Technical Standards for Ship Navigation Equipment
- 3.4.3.3 India: Merchant Shipping (Navigational Equipment) Rules
- 3.4.4 Latin America
- 3.4.4.1 Brazil: NORMAM-01 - Navigation Equipment Requirements
- 3.4.4.2 Mexico: SEMAR Maritime Navigation Safety Regulations
- 3.4.4.3 Argentina: SOLAS- Navigation Equipment Compliance
- 3.4.5 Middle East & Africa
- 3.4.5.1 United Arab Emirates: Marine Navigation Safety Regulations - SOLAS
- 3.4.5.2 South Africa: Merchant Shipping (Safe Navigation) Regulations
- 3.4.5.3 Saudi Arabia: SACS Rules for Ship Navigation Equipment
- 3.4.1 North America
- 3.5 Porter's analysis
- 3.6 PESTEL analysis
- 3.7 Technology and innovation landscape
- 3.7.1 Current technological trends
- 3.7.2 Emerging technologies
- 3.8 Cost breakdown analysis
- 3.9 Patent analysis
- 3.10 Sustainability and environmental aspects
- 3.10.1 Sustainable practices
- 3.10.2 Waste reduction strategies
- 3.10.3 Energy efficiency in production
- 3.10.4 Eco-friendly Initiatives
- 3.11 Future market outlook & opportunities
- 3.12 Pricing, Commercial & Contracting Models
- 3.12.1 Hardware pricing (bridge consoles, sensors, displays)
- 3.12.2 Software license models (per vessel / per module)
- 3.12.3 Service & AMC contracts (5-20 year lifecycle)
- 3.12.4 OEM bundle pricing vs modular upgrades
- 3.12.5 Defense procurement vs commercial shipping pricing
- 3.13 Installation Economics & Lifecycle Cost Analysis
- 3.13.1 Newbuild IBS installation cost structure
- 3.13.2 Retrofit integration costs & risks
- 3.13.3 Calibration, training & certification costs
- 3.13.4 Software updates & recurring OPEX
- 3.14 Newbuild vs Retrofit Adoption Analysis
- 3.14.1 Retrofit demand by ship age & class
- 3.14.2 Regulatory-driven retrofit cycles
- 3.14.3 ROI comparison: retrofit vs full replacement
- 3.15 Buyer & Procurement Decision Dynamics
- 3.16 Cybersecurity & Functional Safety Economics
Chapter 4 Competitive Landscape, 2025
- 4.1 Introduction
- 4.2 Company market share analysis
- 4.2.1 North America
- 4.2.2 Europe
- 4.2.3 Asia Pacific
- 4.2.4 LATAM
- 4.2.5 MEA
- 4.3 Competitive analysis of major market players
- 4.4 Competitive positioning matrix
- 4.5 Strategic outlook matrix
- 4.6 Key developments
- 4.6.1 Mergers & acquisitions
- 4.6.2 Partnerships & collaborations
- 4.6.3 New Product Launches
- 4.6.4 Expansion Plans and funding
Chapter 5 Market Estimates & Forecast By Component, 2022 - 2035 ($Bn)
- 5.1 Key trends
- 5.2 Hardware
- 5.2.1 Displays
- 5.2.2 Control Unit
- 5.2.3 Data Storage Devices
- 5.2.4 Sensors
- 5.2.5 Alarms
- 5.2.6 Others
- 5.3 Software
- 5.4 Services
- 5.4.1 Professional services
- 5.4.2 Managed services
Chapter 6 Market Estimates & Forecast, By Ship, 2022 - 2035 ($Bn)
- 6.1 Key trends
- 6.2 Commercial Ship
- 6.3 Defense Ship
Chapter 7 Market Estimates & Forecast, By Sub system, 2022 - 2035 ($Bn)
- 7.1 Key trends
- 7.2 INS
- 7.3 Automatic Weather Observation System (AWOS)
- 7.4 Voyage Data Recorder
- 7.5 Automatic Identification System (AIS)
Chapter 8 Market Estimates & Forecast, By End use, 2022 - 2035 ($Bn)
- 8.1 Key trends
- 8.2 OEM
- 8.3 Aftermarket
Chapter 9 Market Estimates & Forecast, By Level of Integration, 2022 - 2035 ($Bn)
- 9.1 Key trends
- 9.2 Partial
- 9.3 Fully
Chapter 10 Market Estimates & Forecast, By Region, 2022 - 2035 ($Bn)
- 10.1 Key trends
- 10.2 North America
- 10.2.1 US
- 10.2.2 Canada
- 10.3 Europe
- 10.3.1 Germany
- 10.3.2 UK
- 10.3.3 France
- 10.3.4 Italy
- 10.3.5 Spain
- 10.3.6 Russia
- 10.3.7 Nordics
- 10.3.8 Portugal
- 10.3.9 Croatia
- 10.3.10 Benelux
- 10.4 Asia Pacific
- 10.4.1 China
- 10.4.2 India
- 10.4.3 Japan
- 10.4.4 Australia
- 10.4.5 South Korea
- 10.4.6 Singapore
- 10.4.7 Thailand
- 10.4.8 Indonesia
- 10.4.9 Vietnam
- 10.5 Latin America
- 10.5.1 Brazil
- 10.5.2 Mexico
- 10.5.3 Argentina
- 10.5.4 Colombia
- 10.6 MEA
- 10.6.1 South Africa
- 10.6.2 Saudi Arabia
- 10.6.3 UAE
- 10.6.4 Turkey
Chapter 11 Company Profiles
- 11.1 Global Players
- 11.1.1 Consilium
- 11.1.2 Furuno Electric
- 11.1.3 Hensoldt
- 11.1.4 Kongsberg Gruppen
- 11.1.5. L3 Harris Technologies
- 11.1.6 Mitsubishi Electric
- 11.1.7 Northrop Grumman
- 11.1.8 Rolls-Royce
- 11.1.9 Sperry Marine
- 11.1.10 Wartsila
- 11.2 Regional Players
- 11.2.1 Alphatron Marine
- 11.2.2 Beier Integrated Systems
- 11.2.3 Japan Radio Company (JRC)
- 11.2.4 Naudeq
- 11.2.5 Norwegian Electric Systems
- 11.2.6 Praxis Automation Technology
- 11.2.7 Prime Mover Controls
- 11.2.8 Tokyo Keiki
- 11.3 Emerging / Disruptor Players
- 11.3.1 ComNav Marine
- 11.3.2 Hatteland Technology
- 11.3.3 Høglund Marine Automation
- 11.3.4 Mackay Marine
- 11.3.5 Marine Technologies
- 11.3.6 Naval Group Navigation Systems
- 11.3.7 Raytheon Anschutz
- 11.3.8 Saab Marine Electronics
- 11.3.9 Tokyo Sensor
- 11.3.10 Trelleborg Marine Systems
