


|
시장보고서
상품코드
1936677
파라핀 억제제 시장 기회, 성장 촉진요인, 업계 동향 분석 및 예측(2026-2035년)Paraffin Inhibitors Market Opportunity, Growth Drivers, Industry Trend Analysis, and Forecast 2026 - 2035 |
||||||
세계의 파라핀 억제제 시장은 2025년에 7억 5,550만 달러로 평가되었으며, 2035년까지 CAGR 4.4%로 성장하여 12억 달러에 달할 것으로 예측됩니다.
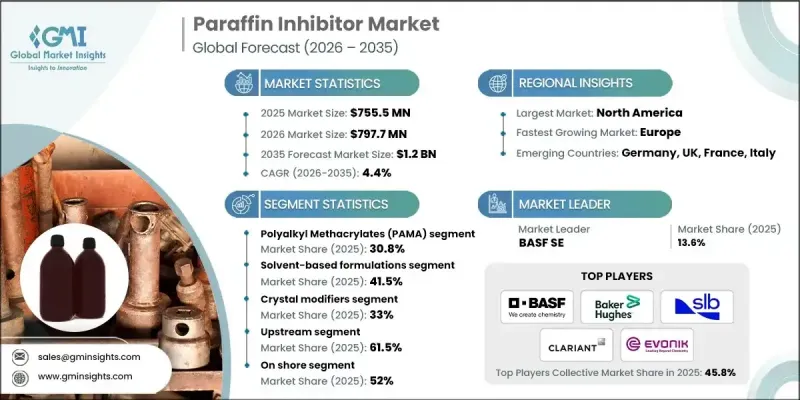
시장 확대는 세계 업스트림 석유 및 가스 탐사 및 생산 활동의 꾸준한 증가와 밀접한 관련이 있습니다. 파라핀 억제제는 파이프라인 및 생산 설비 내에서 왁스 형성을 억제하여 흐름을 중단 없이 유지하는 데 중요한 역할을 하며, 막힘 및 운영 효율성 저하를 방지하는 데 도움이 됩니다. 원유 생산량이 계속 증가함에 따라 효과적인 유량 보장 솔루션에 대한 수요가 증가하고 있습니다. 이러한 화학제품은 왁스 결정화를 억제하고, 파이프라인 표면에 대한 부착을 줄이고, 안정적인 운송 조건을 지원함으로써 작용합니다. 이를 통해 유지보수 요구사항 감소, 다운타임 감소, 운영 신뢰성 향상, 자산 수명 연장을 실현할 수 있습니다. 파라핀 억제제는 다양한 원유 성분에 적응하고 다양한 온도 및 압력 조건에서 성능을 발휘하도록 설계되었습니다. 환경 규제 강화와 성능 향상 및 화학제품 소비량 감소를 요구하는 업계의 수요를 배경으로 친환경 배합 개발이 시장 성장을 견인하고 있습니다.
| 시장 범위 | |
|---|---|
| 시작 연도 | 2025년 |
| 예측 연도 | 2026-2035 |
| 개시 금액 | 7억 5,550만 달러 |
| 예측 금액 | 12억 달러 |
| CAGR | 4.4% |
폴리알킬 메타크릴레이트 부문은 2025년 30.8%의 점유율을 차지했으며, 2035년까지 연평균 4.3%의 성장률을 기록할 것으로 전망됩니다. 이 억제제는 우수한 왁스 용해성과 열 안정성으로 인해 가혹한 작동 환경에 적합하여 널리 채택되고 있습니다. 시장의 혁신은 성능 효율을 유지하면서 생분해성을 향상시키고 환경 부하를 줄이는 데 점점 더 초점을 맞추고 있습니다.
용매 기반 배합 부문은 2025년 41.5%의 점유율을 차지했으며, 2026년부터 2035년까지 연평균 4%의 성장률을 기록할 것으로 전망됩니다. 이러한 포뮬러는 빠른 작용과 왁스 제어에 대한 입증된 효과로 인해 여전히 인기를 끌고 있습니다. 그러나 제조업체들은 고온 및 고부하 응용 분야에 대한 적합성을 유지하면서 배출량을 줄이고 지속가능성을 개선하여 보다 엄격한 환경 및 안전 요구 사항을 충족하도록 배합을 조정하고 있습니다.
북미 파라핀 억제제 시장은 2025년 25.8%의 점유율을 차지하며 견조한 성장세를 이어갈 것으로 예상됩니다. 이 지역의 수요는 활발한 탐사 프로그램, 성숙한 생산 설비, 첨단 왁스 관리 솔루션이 필요한 까다로운 운영 조건에 의해 뒷받침되고 있습니다. 환경 정책의 틀도 생분해성 억제제 기술의 개발 및 채택을 촉진하여 시장의 지속적인 추진력에 기여하고 있습니다.
자주 묻는 질문
목차
제1장 조사 방법과 범위
제2장 주요 요약
제3장 업계 인사이트
제4장 경쟁 구도
제5장 시장 추정 및 예측 : 화학 유형별, 2022-2035
제6장 시장 추정 및 예측 : 제제 유형별, 2022-2035
제7장 시장 추정 및 예측 : 기능별, 2022-2035
제8장 시장 추정 및 예측 : 사업별, 2022-2035
제9장 시장 추정 및 예측 : 용도별, 2022-2035
제10장 시장 추정 및 예측 : 지역별, 2022-2035
제11장 기업 개요
KSM 26.03.05The Global Paraffin Inhibitors Market was valued at USD 755.5 million in 2025 and is estimated to grow at a CAGR of 4.4% to reach USD 1.2 billion by 2035.

Market expansion is tied to the steady increase in upstream oil and gas exploration and production activities worldwide. Paraffin inhibitors play a critical role in maintaining uninterrupted flow by limiting wax formation within pipelines and production equipment, which helps prevent blockages and operational inefficiencies. As crude oil output continues to rise, demand for effective flow assurance solutions is increasing. These chemicals work by disrupting wax crystallization, reducing adhesion to pipeline surfaces, and supporting stable transport conditions. Their use results in lower maintenance requirements, reduced downtime, improved operational reliability, and extended asset life. Paraffin inhibitors are suitable for a wide range of crude compositions and are designed to perform under varying temperature and pressure conditions. Ongoing market development is increasingly focused on environmentally responsible formulations, driven by tightening environmental regulations and industry demand for reduced chemical consumption with enhanced performance.
| Market Scope | |
|---|---|
| Start Year | 2025 |
| Forecast Year | 2026-2035 |
| Start Value | $755.5 Million |
| Forecast Value | $1.2 Billion |
| CAGR | 4.4% |
The polyalkyl methacrylates segment accounted for 30.8% share in 2025 and is expected to grow at a CAGR of 4.3% through 2035. These inhibitors are widely adopted due to their strong wax solubility and thermal stability, making them suitable for demanding operating environments. Market innovation is increasingly centered on improving biodegradability and reducing environmental impact while maintaining performance efficiency.
The solvent-based formulations segment held 41.5% share in 2025 and is forecast to grow at a CAGR of 4% from 2026 to 2035. These formulations remain popular due to their rapid action and proven effectiveness in wax control. However, manufacturers are adapting formulations to align with stricter environmental and safety requirements by lowering emissions and improving sustainability while retaining suitability for high-temperature and heavy-duty applications.
North America Paraffin Inhibitors Market accounted for 25.8% share in 2025 and continues to experience strong growth. Regional demand is supported by active exploration programs, mature production assets, and challenging operating conditions that require advanced wax management solutions. Environmental policy frameworks are also encouraging the development and adoption of biodegradable inhibitor technologies, contributing to sustained market momentum.
Key companies operating in the Global Paraffin Inhibitors Market include BASF SE, Baker Hughes, Arkema, Clariant, ChampionX, Evonik Industries, Nouryon, BYK, SI Group, Inc., and SLB. Companies in the paraffin inhibitors market are strengthening their market position by investing in advanced chemical formulations that enhance performance while meeting environmental standards. Manufacturers are prioritizing biodegradable and low-toxicity solutions to align with regulatory expectations and sustainability goals. Strategic collaborations with oilfield service providers and energy producers are expanding market reach and improving product integration. Firms are also focusing on optimizing dosage efficiency to reduce operating costs for end users. Capacity expansions, regional production optimization, and long-term supply agreements are being used to ensure consistent availability. Continued investment in research and field testing is helping companies improve reliability, adapt products to diverse operating conditions, and maintain a competitive edge.
Table of Contents
Chapter 1 Methodology & Scope
- 1.1 Market scope and definition
- 1.2 Research design
- 1.2.1 Research approach
- 1.2.2 Data collection methods
- 1.3 Data mining sources
- 1.3.1 Global
- 1.3.2 Regional/Country
- 1.4 Base estimates and calculations
- 1.4.1 Base year calculation
- 1.4.2 Key trends for market estimation
- 1.5 Primary research and validation
- 1.5.1 Primary sources
- 1.6 Forecast model
- 1.7 Research assumptions and limitations
Chapter 2 Executive Summary
- 2.1 Industry 3600 synopsis
- 2.2 Key market trends
- 2.2.1 Regional
- 2.2.2 Chemistry type
- 2.2.3 Formulation type
- 2.2.4 Function
- 2.2.5 Operation
- 2.2.6 Application
- 2.3 TAM Analysis, 2026-2035
- 2.4 CXO perspectives: Strategic imperatives
- 2.4.1 Executive decision points
- 2.4.2 Critical success factors
- 2.5 Future Outlook and Strategic Recommendations
Chapter 3 Industry Insights
- 3.1 Industry ecosystem analysis
- 3.1.1 Supplier landscape
- 3.1.2 Profit margin
- 3.1.3 Value addition at each stage
- 3.1.4 Factor affecting the value chain
- 3.1.5 Disruptions
- 3.2 Industry impact forces
- 3.2.1 Growth drivers
- 3.2.2 Industry pitfalls and challenges
- 3.2.3 Market opportunities
- 3.3 Growth potential analysis
- 3.4 Regulatory landscape
- 3.4.1 North America
- 3.4.2 Europe
- 3.4.3 Asia Pacific
- 3.4.4 Latin America
- 3.4.5 Middle East & Africa
- 3.5 Porter's analysis
- 3.6 PESTEL analysis
- 3.7 Price trends
- 3.7.1 By region
- 3.7.2 By type
- 3.8 Future market trends
- 3.9 Technology and Innovation landscape
- 3.9.1 Current technological trends
- 3.9.2 Emerging technologies
- 3.10 Patent Landscape
- 3.11 Trade statistics (HS code) ( Note: the trade statistics will be provided for key countries only)
- 3.11.1 Major importing countries
- 3.11.2 Major exporting countries
- 3.12 Sustainability and environmental aspects
- 3.12.1 Sustainable practices
- 3.12.2 Waste reduction strategies
- 3.12.3 Energy efficiency in production
- 3.12.4 Eco-friendly initiatives
- 3.13 Carbon footprint consideration
Chapter 4 Competitive Landscape, 2025
- 4.1 Introduction
- 4.2 Company market share analysis
- 4.2.1 By region
- 4.2.1.1 North America
- 4.2.1.2 Europe
- 4.2.1.3 Asia Pacific
- 4.2.1.4 LATAM
- 4.2.1.5 MEA
- 4.2.1 By region
- 4.3 Company matrix analysis
- 4.4 Competitive analysis of major market players
- 4.5 Competitive positioning matrix
- 4.6 Key developments
- 4.6.1 Mergers & acquisitions
- 4.6.2 Partnerships & collaborations
- 4.6.3 New Product Launches
- 4.6.4 Expansion Plans
Chapter 5 Market Estimates and Forecast, By Chemistry Type, 2022-2035 (USD Million) (Kilo Tons)
- 5.1 Key trends
- 5.2 Polyalkyl methacrylates (PAMA)
- 5.3 Ethylene-vinyl acetate (EVA) copolymers
- 5.4 Polyacrylates & alkyl acrylate copolymers
- 5.5 Modified polycarboxylates
- 5.6 Hyperbranched polyester
- 5.7 Others
Chapter 6 Market Estimates and Forecast, By Formulation Type, 2022-2035 (USD Million) (Kilo Tons)
- 6.1 Key trends
- 6.2 Solvent-based formulations
- 6.3 Oil-soluble
- 6.4 Aqueous-based/water-dispersible
- 6.5 Solid/controlled-release formulations
Chapter 7 Market Estimates and Forecast, By Function, 2022-2035 (USD Million) (Kilo Tons)
- 7.1 Key trends
- 7.2 Crystal modifiers
- 7.3 Paraffin dispersants
- 7.4 Flow improvers
- 7.5 Pour point depressants
- 7.6 Viscosity reducers
Chapter 8 Market Estimates and Forecast, By Operation, 2022-2035 (USD Million) (Kilo Tons)
- 8.1 Key trends
- 8.2 Upstream
- 8.3 Midstream
- 8.4 Downstream
Chapter 9 Market Estimates and Forecast, By Application, 2022-2035 (USD Million) (Kilo Tons)
- 9.1 Key trends
- 9.2 Onshore
- 9.3 Offshore
Chapter 10 Market Estimates and Forecast, By Region, 2022-2035 (USD Million) (Kilo Tons)
- 10.1 Key trends
- 10.2 North America
- 10.2.1 U.S.
- 10.2.2 Canada
- 10.3 Europe
- 10.3.1 Germany
- 10.3.2 UK
- 10.3.3 France
- 10.3.4 Spain
- 10.3.5 Italy
- 10.3.6 Rest of Europe
- 10.4 Asia Pacific
- 10.4.1 China
- 10.4.2 India
- 10.4.3 Japan
- 10.4.4 Australia
- 10.4.5 South Korea
- 10.4.6 Rest of Asia Pacific
- 10.5 Latin America
- 10.5.1 Brazil
- 10.5.2 Mexico
- 10.5.3 Argentina
- 10.5.4 Rest of Latin America
- 10.6 Middle East and Africa
- 10.6.1 Saudi Arabia
- 10.6.2 South Africa
- 10.6.3 UAE
- 10.6.4 Rest of Middle East and Africa
Chapter 11 Company Profiles
- 11.1 Arkema
- 11.2 Baker Hughes
- 11.3 BASF SE
- 11.4 BYK
- 11.5 ChampionX
- 11.6 Clariant
- 11.7 Evonik Industries
- 11.8 Nouryon
- 11.9 SI Group, Inc.
- 11.10 SLB
