
|
시장보고서
상품코드
1959325
마이크로모빌리티 스왑 스테이션 시장 기회, 성장요인, 업계 동향 분석 및 예측(2026-2035년)Micromobility Swap Station Market Opportunity, Growth Drivers, Industry Trend Analysis, and Forecast 2026 - 2035 |
||||||
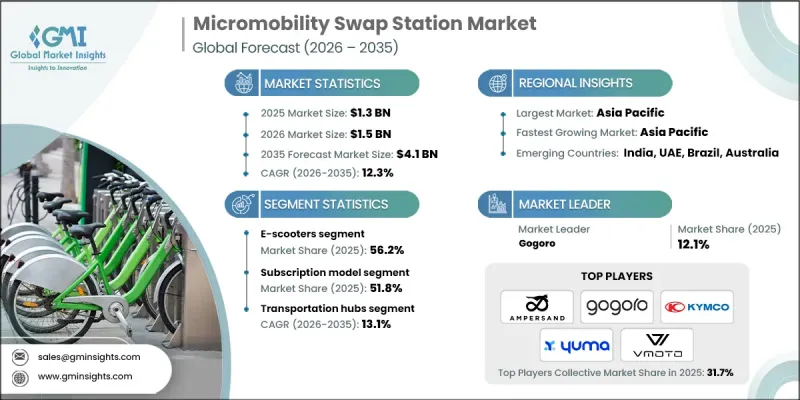
세계의 마이크로모빌리티 스왑 스테이션 시장은 2025년에 13억 달러로 평가되었고, 2035년까지 연평균 복합 성장률(CAGR) 12.3%로 성장하여 41억 달러에 이를 것으로 예측됩니다.
급속한 도시화와 스마트시티 개발 노력은 전기 스쿠터, 자전거, 오토바이 등 공유형 전기 모빌리티 솔루션의 도입을 촉진하고 있습니다. 이러한 서비스는 내연기관 차량을 대체할 수 있는 효율적인 대안으로 주목받고 있으며, 사용자와 차량 운영자가 소유 비용 절감, 배기가스 배출량 감소, 라스트 마일 연결성 향상을 실현할 수 있도록 돕고 있습니다. 충전 시간 및 차량 가동 중단 시간과 관련된 운영상의 문제를 해결하는 배터리 교체 인프라는 이러한 전환을 가능하게 하는 중요한 요소로 부상하고 있습니다. 초기에는 충전시설의 부족이 전기차 보급을 제약하는 요인이었으나, 인프라 네트워크의 확대로 접근성과 편의성이 크게 향상되었습니다. 시장 진출기업들은 차량, 표준화된 배터리, 교환 스테이션 네트워크를 통합한 생태계를 제공함으로써 자신들의 입지를 강화하고 있습니다. 차량 운영사 및 배송 서비스 제공업체와의 파트너십을 통해 원활한 도입을 지원하고, 자산 활용도를 높이며, 배터리 교체가 밀집된 도시 환경에서 확장 가능하고 상업적으로 매력적인 솔루션으로 자리매김할 수 있도록 돕습니다.
| 시장 범위 | |
|---|---|
| 개시 연도 | 2025년 |
| 예측 연도 | 2026-2035년 |
| 개시 금액 | 13억 달러 |
| 예측 금액 | 41억 달러 |
| CAGR | 12.3% |
전기 스쿠터 부문은 2025년 56.2%의 점유율을 차지하며 7억 3,770만 달러의 수익을 창출할 것으로 예측됩니다. 출퇴근, 공유 모빌리티, 배송 업무에서 높은 일일 이용률이 이 부문의 선두를 유지하고 있습니다. 배터리 교체는 가동 중단 시간이 최소화되고 작동 빈도가 높기 때문에 전기 스쿠터의 사용 패턴에 적합합니다. 컴팩트한 배터리 설계, 경량화, 모듈식 아키텍처는 교환 네트워크 전반에 걸쳐 표준화와 대규모 배포를 더욱 촉진하여 상업 및 공유 모빌리티 사업자 수요를 강화하고 있습니다.
구독 모델은 2025년 51.8%의 점유율을 차지할 것으로 예상되며, 2035년까지 23억 달러에 달할 것으로 전망됩니다. 이 방식은 예측 가능한 비용과 간소화된 결제 구조를 제공함으로써 통근자 및 프로 라이더의 빈번한 배터리 사용 패턴에 적합합니다. 한 번의 배터리 교체는 보통 약 1달러로 약 50킬로미터의 주행거리를 제공합니다. 따라서 자주 사용하는 사용자에게는 종량제 요금에 비해 구독이 더 경제적입니다. 월정액 또는 연간 고정 요금제는 관리의 복잡성을 줄이고, 서비스 제공업체에게 안정적인 수익원을 제공합니다.
미국의 마이크로모빌리티 스왑 스테이션 시장은 2025년 2억970만 달러 규모에 달할 것으로 예측됩니다. 전국적으로 지자체 당국과 이해관계자들은 공유형 전기 모빌리티 네트워크의 효율성을 높이기 위해 교환 스테이션 설치를 적극적으로 지원하고 있습니다. 배터리 교체는 충전에 따른 지연을 줄이고 차량 가동률을 향상시킵니다. 이는 일상적인 이용률과 수익을 극대화하고자 하는 배송 전문가와 도시 지역 라이더에게 특히 중요합니다.
자주 묻는 질문
목차
제1장 조사 방법
제2장 주요 요약
제3장 업계 인사이트
제4장 경쟁 구도
제5장 시장 추산·예측 : 솔루션별, 2022-2035년
제6장 시장 추산·예측 : 차량별, 2022-2035년
제7장 시장 추산·예측 : 사업 모델별, 2022-2035년
제8장 시장 추산·예측 : 전개 형태별, 2022-2035년
제9장 시장 추산·예측 : 용도별, 2022-2035년
제10장 시장 추산·예측 : 최종 용도별, 2022-2035년
제11장 시장 추산·예측 : 지역별, 2022-2035년
제12장 기업 개요
LSH 26.03.26The Global Micromobility Swap Station Market was valued at USD 1.3 billion in 2025 and is estimated to grow at a CAGR of 12.3% to reach USD 4.1 billion by 2035.

Rapid urbanization and smart city development initiatives are driving the adoption of shared electric mobility solutions, including electric scooters, bicycles, and mopeds. These services are increasingly viewed as efficient alternatives to internal combustion engine vehicles, helping users and fleet operators lower ownership costs, reduce emissions, and improve last-mile connectivity. Battery swapping infrastructure has emerged as a critical enabler for this transition by addressing operational challenges linked to charging time and vehicle downtime. While limited charging availability initially constrained electric vehicle deployment, expanding infrastructure networks have significantly improved accessibility and usability. Market participants are strengthening their positions by offering integrated ecosystems that combine vehicles, standardized batteries, and swap station networks. Partnerships with fleet operators and delivery service providers support seamless adoption and improve asset utilization, positioning battery swapping as a scalable and commercially attractive solution within dense urban environments.
| Market Scope | |
|---|---|
| Start Year | 2025 |
| Forecast Year | 2026-2035 |
| Start Value | $1.3 Billion |
| Forecast Value | $4.1 Billion |
| CAGR | 12.3% |
The e-scooters segment accounted for 56.2% share and generated USD 737.7 million in 2025. Strong daily utilization rates across commuting, shared mobility, and delivery operations continue to support segment leadership. Battery swapping aligns well with e-scooter usage patterns due to minimal downtime requirements and high operational frequency. Compact battery design, lighter weight, and modular architecture further support standardization and large-scale deployment across swap networks, reinforcing demand from commercial and shared mobility operators.
The subscription-based pricing model held a 51.8% share in 2025 and is projected to reach USD 2.3 billion by 2035. This approach aligns with frequent battery usage patterns among commuters and professional riders by offering predictable costs and simplified payment structures. A single battery swap typically costs about USD 1 and provides an operating range of roughly 50 kilometers, making subscriptions more economical for high-frequency users compared to transactional pricing. Fixed monthly or annual plans reduce administrative complexity and support consistent revenue streams for service providers.
U.S. Micromobility Swap Station Market generated USD 209.7 million in 2025. Across the country, municipal authorities and private stakeholders are increasingly supporting swap station deployment to enhance the efficiency of shared electric mobility networks. Battery swapping reduces charging-related delays and improves vehicle availability, which is particularly important for delivery professionals and urban riders seeking to maximize daily usage and earnings.
Key companies active in the Global Micromobility Swap Station Market include Gogoro, SUN Mobility, Battery Smart, Swobbee, Yuma, Tycorun, Spiro, Ampersand, KYMCO, and Vmoto. Companies operating in the micromobility swap station market adopt focused strategies to strengthen market presence and competitive positioning. Many invest heavily in standardized battery platforms to ensure interoperability across multiple vehicle types and brands. Strategic collaborations with city authorities, fleet operators, and mobility service providers help accelerate network deployment and user adoption. Firms also expand station density in high-traffic urban areas to improve convenience and reduce range anxiety. Subscription-based pricing and bundled service offerings enhance customer retention and revenue stability.
Table of Contents
Chapter 1 Methodology
- 1.1 Research approach
- 1.2 Quality commitments
- 1.2.1 GMI AI policy & data integrity commitment
- 1.3 Research trail & confidence scoring
- 1.3.1 Research trail components
- 1.3.2 Scoring components
- 1.4 Data collection
- 1.4.1 Partial list of primary sources
- 1.5 Data mining sources
- 1.5.1 Paid sources
- 1.6 Base estimates and calculations
- 1.6.1 Base year calculation
- 1.7 Forecast model
- 1.8 Research transparency addendum
Chapter 2 Executive Summary
- 2.1 Industry 360° synopsis
- 2.2 Key market trends
- 2.2.1 Regional
- 2.2.2 Solution
- 2.2.3 Vehicle
- 2.2.4 Business Model
- 2.2.5 Deployment
- 2.2.6 Application
- 2.2.7 End Use
- 2.3 TAM analysis, 2026-2035
- 2.4 CXO perspectives: Strategic imperatives
- 2.4.1 Executive decision points
- 2.4.2 Critical success factors
- 2.5 Future outlook and recommendations
Chapter 3 Industry Insights
- 3.1 Industry ecosystem analysis
- 3.1.1 Supplier landscape
- 3.1.2 Profit margin
- 3.1.3 Cost structure
- 3.1.4 Value addition at each stage
- 3.1.5 Factor affecting the value chain
- 3.1.6 Disruptions
- 3.2 Industry impact forces
- 3.2.1 Growth drivers
- 3.2.1.1 Growth of smart city and urban mobility initiatives
- 3.2.1.2 Environmental regulations promoting zero-emission transport
- 3.2.1.3 Expansion of shared micromobility services
- 3.2.1.4 Rising demand for fast and convenient battery charging
- 3.2.2 Industry pitfalls and challenges
- 3.2.2.1 High initial capital investment for swap station deployment
- 3.2.2.2 Grid connectivity and power management challenges
- 3.2.3 Market opportunities
- 3.2.3.1 Integration of swap stations with renewable energy sources
- 3.2.3.2 Partnerships with micromobility fleet operators and oems
- 3.2.3.3 Deployment of swap stations at transit hubs and commercial zones
- 3.2.1 Growth drivers
- 3.3 Growth potential analysis
- 3.4 Regulatory landscape
- 3.4.1 North America
- 3.4.1.1 U.S. Department of Transportation (USDOT)
- 3.4.1.2 National Highway Traffic Safety Administration (NHTSA)
- 3.4.1.3 California Air Resources Board (CARB)
- 3.4.1.4 Transport Canada
- 3.4.2 Europe
- 3.4.2.1 European Commission
- 3.4.2.2 UNECE World Forum for Harmonization of Vehicle Regulations (WP.29)
- 3.4.2.3 German Federal Motor Transport Authority (KBA)
- 3.4.2.4 UK Department for Transport (DfT)
- 3.4.2.5 French Ministry of Ecological Transition
- 3.4.3 Asia Pacific
- 3.4.3.1 Ministry of Industry and Information Technology (MIIT), China
- 3.4.3.2 Ministry of Road Transport and Highways (MoRTH), India
- 3.4.3.3 Land Transport Authority (LTA), Singapore
- 3.4.3.4 National Transport Commission (NTC), Australia
- 3.4.4 Latin America
- 3.4.4.1 Brazilian National Land Transport Agency (ANTT)
- 3.4.4.2 Brazilian Association of Automotive Vehicle Manufacturers (ANFAVEA)
- 3.4.4.3 Chile Ministry of Transport and Telecommunications
- 3.4.5 Middle East & Africa
- 3.4.5.1 Dubai Roads and Transport Authority (RTA)
- 3.4.5.2 Abu Dhabi Department of Municipalities and Transport (DMT)
- 3.4.5.3 Saudi Ministry of Transport & Logistics
- 3.4.5.4 South African Department of Transport
- 3.4.1 North America
- 3.5 Porter’s analysis
- 3.6 PESTEL analysis
- 3.7 Technology and innovation landscape
- 3.7.1 Current technological trends
- 3.7.2 Emerging technologies
- 3.8 Price trends
- 3.8.1 By region
- 3.8.2 By product
- 3.9 Cost breakdown analysis
- 3.10 Sustainability and environmental impact
- 3.10.1 Environmental impact assessment
- 3.10.2 Social impact & community benefits
- 3.10.3 Governance & corporate responsibility
- 3.10.4 Sustainable finance & investment trends
- 3.11 Infrastructure readiness and urban integration
- 3.11.1 Urban infrastructure assessment framework
- 3.11.2 Smart city integration opportunities
- 3.11.3 Public transport connectivity
- 3.11.4 Digital infrastructure requirements
- 3.11.5 5G and IoT connectivity readiness
- 3.12 Placement and location strategy
- 3.12.1 Location selection criteria and decision framework
- 3.12.2 Geographic Information System analysis
- 3.12.3 Foot traffic and demand density mapping
- 3.12.4 Safety and security considerations
- 3.12.5 Franchise versus company-owned location models
- 3.13 Grid and power infrastructure analysis
- 3.13.1 Electrical grid capacity assessment
- 3.13.2 Grid connection requirements
- 3.13.3 Load management and peak shaving
- 3.13.4 Distributed energy resources integration
- 3.13.5 Power quality and reliability
- 3.14 Case studies
- 3.15 Future outlook & opportunities
Chapter 4 Competitive Landscape, 2025
- 4.1 Introduction
- 4.2 Company market share analysis
- 4.2.1 North America
- 4.2.2 Europe
- 4.2.3 Asia Pacific
- 4.2.4 LATAM
- 4.2.5 MEA
- 4.3 Competitive analysis of major market players
- 4.4 Competitive positioning matrix
- 4.5 Strategic outlook matrix
- 4.6 Key developments
- 4.6.1 Mergers & acquisitions
- 4.6.2 Partnerships & collaborations
- 4.6.3 New product launches
- 4.6.4 Expansion plans and funding
Chapter 5 Market Estimates & Forecast, By Solution, 2022 - 2035 ($Mn)
- 5.1 Key trends
- 5.2 Battery swap station
- 5.3 Vehicle swap station
Chapter 6 Market Estimates & Forecast, By Vehicle, 2022 - 2035 ($Mn)
- 6.1 Key trends
- 6.2 E-scooters
- 6.3 E-bikes
- 6.4 E-mopeds
- 6.5 Others
Chapter 7 Market Estimates & Forecast, By Business Model, 2022 - 2035 ($Mn)
- 7.1 Key trends
- 7.2 Subscription model
- 7.3 Pay-per-swap
- 7.4 Others
Chapter 8 Market Estimates & Forecast, By Deployment, 2022 - 2035 ($Mn)
- 8.1 Key trends
- 8.2 Public places
- 8.3 Commercial locations
- 8.4 Residential areas
- 8.5 Transportation hubs
Chapter 9 Market Estimates & Forecast, By Application, 2022 - 2035 ($Mn)
- 9.1 Key trends
- 9.2 Ride sharing
- 9.3 Delivery and logistics
- 9.4 Personal commuting
- 9.5 Tourism and recreation
- 9.6 Others
Chapter 10 Market Estimates & Forecast, By End Use, 2022 - 2035 ($Mn)
- 10.1 Key trends
- 10.2 Shared micromobility operators
- 10.3 Individual consumers
- 10.4 Fleet operators
- 10.5 Government and municipal
Chapter 11 Market Estimates & Forecast, By Region, 2022 - 2035 ($Mn)
- 11.1 Key trends
- 11.2 North America
- 11.2.1 US
- 11.2.2 Canada
- 11.3 Europe
- 11.3.1 Germany
- 11.3.2 UK
- 11.3.3 France
- 11.3.4 Italy
- 11.3.5 Spain
- 11.3.6 Czech Republic
- 11.3.7 Belgium
- 11.3.8 Netherlands
- 11.4 Asia Pacific
- 11.4.1 China
- 11.4.2 India
- 11.4.3 Japan
- 11.4.4 South Korea
- 11.4.5 Australia
- 11.4.6 Singapore
- 11.4.7 Malaysia
- 11.4.8 Indonesia
- 11.4.9 Vietnam
- 11.4.10 Thailand
- 11.5 Latin America
- 11.5.1 Brazil
- 11.5.2 Mexico
- 11.5.3 Argentina
- 11.5.4 Colombia
- 11.6 MEA
- 11.6.1 South Africa
- 11.6.2 Saudi Arabia
- 11.6.3 UAE
Chapter 12 Company Profiles
- 12.1 Global players
- 12.1.1 Ampersand
- 12.1.2 Battery Smart
- 12.1.3 Gogoro
- 12.1.4 KYMCO
- 12.1.5 Silence (ACCIONA)
- 12.1.6 Spiro
- 12.1.7 SUN Mobility
- 12.1.8 Swobbee
- 12.1.9 Tycorun
- 12.1.10 Vmoto
- 12.1.11 Yamaha ENYRING
- 12.1.12 Yuma
- 12.2 Regional players
- 12.2.1 BatteryPool
- 12.2.2 ESmito
- 12.2.3 Oyika
- 12.2.4 Popwheels
- 12.2.5 RACEnergy
- 12.2.6 Selex Motors
- 12.2.7 Swap Energi
- 12.2.8 VoltUp
- 12.3 Emerging players
- 12.3.1 ESWAP
- 12.3.2 Okai
- 12.3.3 Terra Tech
- 12.3.4 Tiger New Energy
- 12.3.5 Zembo
