
|
시장보고서
상품코드
1959562
원격 자동차 배기가스 감지 시장 기회, 성장요인, 업계 동향 분석 및 예측(2026-2035년)Remote Automotive Exhaust Sensing Market Opportunity, Growth Drivers, Industry Trend Analysis, and Forecast 2026 - 2035 |
||||||
세계의 원격 자동차 배기가스 감지 시장은 2025년에 8,770만 달러로 평가되었고, 2035년까지 연평균 복합 성장률(CAGR) 9.7%로 성장하여 2억 1,860만 달러에 이를 것으로 예측됩니다.
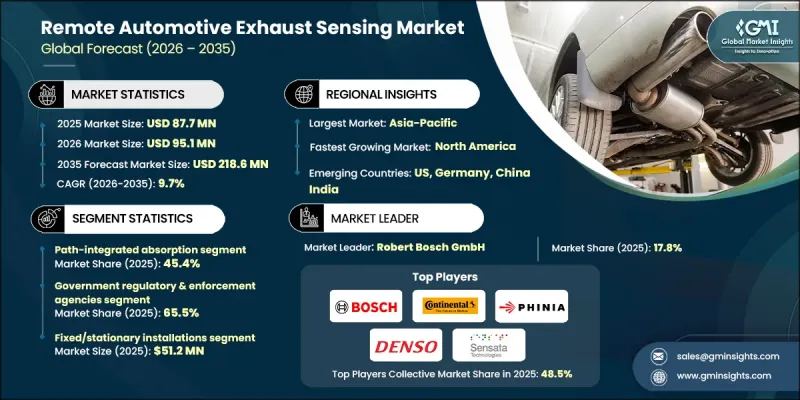
세계 주요 자동차 지역의 배출가스 규제 강화가 시장 확대 요인으로 작용하고 있으며, 실주행 차량 배출가스 모니터링 솔루션의 도입을 촉진하고 있습니다. 정부는 대기질 관리를 위해 원격 배기가스 감지 인프라에 많은 투자를 하고 있으며, 특히 도시지역과 교통량이 많은 지역에서 많은 투자를 하고 있습니다. 기존의 실험실 테스트나 불시 점검과 달리, 이 기술은 차량에서 배출가스 데이터를 실시간으로 수집하기 때문에 당국이 보다 효과적으로 오염 대책을 시행할 수 있습니다. 또한, 도시 대기질 개선 이니셔티브에 대한 공공 자금 지원과 배기 가스 센서의 스마트 시티 교통 네트워크 통합이 시장을 뒷받침하고 있습니다. 감지 정확도, 데이터 분석, 자동 보고 기능의 발전으로 환경 및 교통 당국의 신뢰가 높아져 보급이 가속화되고 있습니다. 도시 대기오염에 대한 우려 증가와 진화하는 배출 규제에 대한 대응은 전 세계적으로 원격 감지 시스템의 꾸준한 도입을 촉진하고 있습니다.
| 시장 범위 | |
|---|---|
| 개시 연도 | 2025년 |
| 예측 연도 | 2026-2035년 |
| 개시 금액 | 8,770만 달러 |
| 예측 금액 | 2억 1,860만 달러 |
| CAGR | 9.7% |
2025년 기준, 패스 통합형 흡수 부문은 45.4%의 점유율을 차지했습니다. 이 센서는 장거리에서 질소산화물(NOx), 일산화탄소(CO), 미립자 물질을 실시간으로 매우 정확하게 측정할 수 있는 능력으로 인해 선호되고 있습니다. 교통량이 많은 도로에서 지속적인 모니터링이 가능하며, 자동화된 도로변 스테이션과 통합할 수 있어 배출가스 규제 및 차량 관리 프로그램 준수를 지원합니다. 신뢰할 수 있는 데이터를 제공하는 효율성으로 인해 도시 및 규제 관련 용도의 기반 기술이 되었습니다.
자동차 제조업체 부문은 2026년부터 2035년까지 연평균 복합 성장률(CAGR) 9.6%를 나타낼 것으로 예측됩니다. 자동차 OEM 제조업체 및 상용차 운영사들은 실주행 시 배출가스 성능 평가, 엔진 캘리브레이션 최적화, 국내외 배출가스 기준 준수를 위해 원격 배기가스 센서의 도입을 확대하고 있습니다. 규제 당국의 감시 강화와 기업의 지속가능성에 대한 노력은 특히 유럽, 북미, 동아시아 지역에서 배출가스 성능이 지속적으로 평가되고 있는 상황에서 제조업체들의 노상 센싱 솔루션 채택을 촉진하고 있습니다.
북미 원격 자동차 배기가스 감지 시장은 2025년 18.9%의 점유율을 차지할 것으로 예측됩니다. 이 지역 시장 성장은 엄격한 EPA 배출가스 기준, 도시 대기질 개선 프로그램 확대, 실시간 배출가스 모니터링에 대한 수요 증가에 의해 주도되고 있습니다. 교통량이 많은 도시에서는 도로 감지 장치의 도입이 확대되고 있으며, 당국과 민간 차량이 NOx 및 미립자 물질의 배출을 지속적으로 모니터링 할 수 있습니다. IoT 지원 센서와 AI 기반 데이터 분석에 대한 투자는 배출가스를 실시간으로 추적할 수 있는 능력을 강화하여 신속한 대응과 규제 준수를 가능하게 합니다.
자주 묻는 질문
목차
제1장 조사 방법과 범위
제2장 주요 요약
제3장 업계 인사이트
제4장 경쟁 구도
제5장 시장 추산·예측 : 감지 방식별, 2022-2035년
제6장 시장 추산·예측 : 대상 오염물질별, 2022-2035년
제7장 시장 추산·예측 : 제공별, 2022-2035년
제8장 시장 추산·예측 : 도입 형태별, 2022-2035년
제9장 시장 추산·예측 : 차량 유형별, 2022-2035년
제10장 시장 추산·예측 : 최종사용자별, 2022-2035년
제11장 시장 추산·예측 : 지역별, 2022-2035년
제12장 기업 개요
LSH 26.03.26The Global Remote Automotive Exhaust Sensing Market was valued at USD 87.7 million in 2025 and is estimated to grow at a CAGR of 9.7% to reach USD 218.6 million by 2035.

The market is expanding due to stringent emission standards in major automotive regions worldwide, which are driving the adoption of real-world vehicle emissions monitoring solutions. Governments are heavily investing in remote exhaust sensing infrastructure, particularly in urban centers and high-traffic areas, to manage air quality. Unlike traditional laboratory testing or random inspections, these technologies capture real-time emissions data from vehicles, enabling authorities to address pollution more effectively. The market is further supported by public funding for urban air quality initiatives and integration of exhaust sensors into smart city transportation networks. Advances in sensing accuracy, data analytics, and automated reporting have increased trust among environmental and transport authorities, accelerating widespread deployment. Rising concerns over urban air pollution and compliance with evolving emission regulations are fueling the steady adoption of remote sensing systems globally.
| Market Scope | |
|---|---|
| Start Year | 2025 |
| Forecast Year | 2026-2035 |
| Start Value | $87.7 Million |
| Forecast Value | $218.6 Million |
| CAGR | 9.7% |
The path-integrated absorption segment held 45.4% share in 2025. These sensors are preferred for their ability to deliver highly accurate, real-time measurements of nitrogen oxides (NOx), carbon monoxide (CO), and particulate matter over extended distances. They enable continuous monitoring on busy roadways and can be integrated with automated roadside stations, supporting compliance with emission regulations and fleet management programs. Their efficiency in providing reliable data has made them a cornerstone technology for urban and regulatory applications.
The vehicle manufacturers segment is projected to grow at a CAGR of 9.6% during 2026 to 2035. Automotive OEMs and commercial fleet operators are increasingly deploying remote exhaust sensors to evaluate real-world emissions performance, optimize engine calibration, and comply with local and international emission standards. Heightened regulatory scrutiny and corporate sustainability initiatives are encouraging manufacturers to adopt on-road sensing solutions, especially across Europe, North America, and East Asia, where emissions performance is under continuous evaluation.
North America Remote Automotive Exhaust Sensing Market accounted for 18.9% share in 2025. Market growth in the region is driven by strict EPA emission standards, growing urban air quality programs, and rising demand for real-time emissions monitoring. Deployment of roadside sensing units is expanding in cities with high traffic density, enabling authorities and private fleets to monitor NOx and particulate matter emissions continuously. Investments in IoT-enabled sensors and AI-driven data analytics are enhancing the capability to track emissions in real time, allowing for prompt interventions and regulatory compliance.
Key players in the Global Remote Automotive Exhaust Sensing Market include Amphenol Advanced Sensors, AVL List GmbH, Continental AG, Denso Corporation, Hager Environmental & Atmospheric Technologies (HEAT), HELLA GmbH & Co. KGaA, Korea Environment Corporation (K-eco), Niterra India PVT. LTD., Opus Group AB, PHINIA Inc., Robert Bosch GmbH, Sensata Technologies, Inc., and Valeo SA. Companies in the Remote Automotive Exhaust Sensing Market are adopting multiple strategies to strengthen their market position. They are investing in advanced sensor technologies to improve accuracy, range, and data processing speed. Strategic collaborations with government agencies, transport authorities, and fleet operators are enabling early adoption and integration into smart city programs. Firms are expanding their global presence through partnerships, joint ventures, and localized manufacturing to meet regional regulatory requirements. Incorporation of AI, machine learning, and cloud-based analytics enhances predictive maintenance, emissions reporting, and fleet optimization services.
Table of Contents
Chapter 1 Methodology and Scope
- 1.1 Market scope and definition
- 1.2 Research design
- 1.2.1 Research approach
- 1.2.2 Data collection methods
- 1.3 Data mining sources
- 1.3.1 Global
- 1.3.2 Regional/Country
- 1.4 Base estimates and calculations
- 1.4.1 Base year calculation
- 1.4.2 Key trends for market estimation
- 1.5 Primary research and validation
- 1.5.1 Primary sources
- 1.6 Forecast model
- 1.7 Research assumptions and limitations
Chapter 2 Executive Summary
- 2.1 Industry 360° synopsis, 2022 - 2035
- 2.2 Key market trends
- 2.2.1 Sensing modality trends
- 2.2.2 Target pollutant trends
- 2.2.3 Offering trends
- 2.2.4 Deployment configuration trends
- 2.2.5 End user trends
- 2.2.6 Vehicle type trends
- 2.2.7 Regional trends
- 2.3 TAM Analysis, 2026-2035
- 2.4 CXO perspectives: Strategic imperatives
- 2.4.1 Executive decision points
- 2.4.2 critical success factors
- 2.5 Future outlook and strategic recommendations
Chapter 3 Industry Insights
- 3.1 Industry ecosystem analysis
- 3.1.1 Supplier Landscape
- 3.1.2 Profit Margin
- 3.1.3 Cost structure
- 3.1.4 Value addition at each stage
- 3.1.5 Factor affecting the value chain
- 3.1.6 Disruptions
- 3.2 Industry impact forces
- 3.2.1 Growth drivers
- 3.2.1.1 Stricter vehicle emission rules by governments globally
- 3.2.1.2 Government investment in roadside remote sensing programs
- 3.2.1.3 Rising urban air quality compliance monitoring needs
- 3.2.1.4 Need for fast on-road vehicle emission checks
- 3.2.1.5 Advances in infrared spectroscopy and data analytics
- 3.2.2 Industry pitfalls and challenges
- 3.2.2.1 Accuracy variability under weather and traffic conditions
- 3.2.2.2 High installation and system maintenance costs
- 3.2.3 Market opportunities
- 3.2.3.1 Support for smart city air monitoring programs
- 3.2.3.2 Use by fleet operators for emission tracking
- 3.2.1 Growth drivers
- 3.3 Growth potential analysis
- 3.4 Regulatory landscape
- 3.4.1 North America
- 3.4.2 Europe
- 3.4.3 Asia Pacific
- 3.4.4 Latin America
- 3.4.5 Middle East & Africa
- 3.5 Porter’s analysis
- 3.6 PESTEL analysis
- 3.7 Technology and Innovation landscape
- 3.7.1 Current technological trends
- 3.7.2 Emerging technologies
- 3.8 Price trends
- 3.8.1 By region
- 3.8.2 By product
- 3.9 Pricing Strategies
- 3.10 Emerging Business Models
- 3.11 Compliance Requirements
- 3.12 Patent and IP analysis
- 3.13 Geopolitical and trade dynamics
Chapter 4 Competitive Landscape, 2025
- 4.1 Introduction
- 4.2 Company market share analysis
- 4.2.1 By region
- 4.2.1.1 North America
- 4.2.1.2 Europe
- 4.2.1.3 Asia Pacific
- 4.2.1.4 Latin America
- 4.2.1.5 Middle East & Africa
- 4.2.2 Market concentration analysis
- 4.2.1 By region
- 4.3 Competitive benchmarking of key players
- 4.3.1 Financial performance comparison
- 4.3.1.1 Revenue
- 4.3.1.2 Profit margin
- 4.3.1.3 R&D
- 4.3.2 Product portfolio comparison
- 4.3.2.1 Product range breadth
- 4.3.2.2 Technology
- 4.3.2.3 Innovation
- 4.3.3 Geographic presence comparison
- 4.3.3.1 Global footprint analysis
- 4.3.3.2 Service network coverage
- 4.3.3.3 Market penetration by region
- 4.3.4 Competitive positioning matrix
- 4.3.4.1 Leaders
- 4.3.4.2 Challengers
- 4.3.4.3 Followers
- 4.3.4.4 Niche players
- 4.3.5 Strategic outlook matrix
- 4.3.1 Financial performance comparison
- 4.4 Key developments
- 4.4.1 Mergers and acquisitions
- 4.4.2 Partnerships and collaborations
- 4.4.3 Technological advancements
- 4.4.4 Expansion and investment strategies
- 4.4.5 Digital transformation initiatives
- 4.5 Emerging/ startup competitors landscape
Chapter 5 Market Estimates and Forecast, By Sensing Modality, 2022 - 2035 (USD Million & Units)
- 5.1 Key trends
- 5.2 Path-integrated absorption
- 5.3 Laser ranging / active laser
- 5.4 Particle-phase optical
- 5.5 Imaging spectroscopy
Chapter 6 Market Estimates and Forecast, By Target Pollutant, 2022 - 2035 (USD Million & Units)
- 6.1 Key trends
- 6.2 Gas-Phase
- 6.2.1 NOx (NO, NO2)
- 6.2.2 CO
- 6.2.3 CO2
- 6.2.4 HC/VOC
- 6.2.5 NH3
- 6.2.6 SO2
- 6.3 Other regulated/target gases (HCHO, CH4)
Chapter 7 Market Estimates and Forecast, By Offering, 2022 - 2035 (USD Million & Units)
- 7.1 Key trends
- 7.2 Hardware
- 7.3 Software & analytics
- 7.4 Services
Chapter 8 Market Estimates and Forecast, By Deployment Configuration, 2022 - 2035 (USD Million & Units)
- 8.1 Key trends
- 8.2 Fixed/stationary installations
- 8.3 Mobile enforcement platforms
- 8.4 Portable handheld/field devices
- 8.5 Networked sensor arrays
Chapter 9 Market Estimates and Forecast, By Vehicle Type, 2022 - 2035 (USD Million & Units)
- 9.1 Key trends
- 9.2 Light-duty vehicles
- 9.3 Heavy-duty vehicle
- 9.4 Two-wheelers
- 9.5 Non-road engines & off-highway equipment vehicle
Chapter 10 Market Estimates and Forecast, By End-User, 2022 - 2035 (USD Million & Units)
- 10.1 Key trends
- 10.2 Government regulatory & enforcement agencies
- 10.3 Vehicle manufacturers
- 10.4 Third-party inspection & certification bodies
- 10.5 Academic & research institutions
- 10.6 Commercial fleet owners
Chapter 11 Market Estimates and Forecast, By Region, 2022 - 2035 (USD Million & Units)
- 11.1 Key trends
- 11.2 North America
- 11.2.1 U.S.
- 11.2.2 Canada
- 11.3 Europe
- 11.3.1 Germany
- 11.3.2 UK
- 11.3.3 France
- 11.3.4 Spain
- 11.3.5 Italy
- 11.4 Asia Pacific
- 11.4.1 China
- 11.4.2 India
- 11.4.3 Japan
- 11.4.4 Australia
- 11.4.5 South Korea
- 11.5 Latin America
- 11.5.1 Brazil
- 11.5.2 Mexico
- 11.5.3 Argentina
- 11.6 Middle East and Africa
- 11.6.1 South Africa
- 11.6.2 Saudi Arabia
- 11.6.3 UAE
Chapter 12 Company Profiles
- 12.1 Global Key Players
- 12.1.1 Robert Bosch GmbH
- 12.1.2 Continental AG
- 12.1.3 Denso Corporation
- 12.1.4 Sensata Technologies, Inc.
- 12.1.5 Valeo SA
- 12.1.6 HELLA GmbH & Co. KGaA
- 12.2 Regional key players
- 12.2.1 North America
- 12.2.1.1 Amphenol Advanced Sensors
- 12.2.1.2 Opus Group AB
- 12.2.2 Asia Pacific
- 12.2.2.1 Niterra India PVT. LTD.
- 12.2.2.2 Korea Environment Corporation (K-eco)
- 12.2.3 Europe
- 12.2.3.1 AVL List GmbH
- 12.2.3.2 PHINIA Inc.
- 12.2.3.3 Hager Environmental & Atmospheric Technologies (HEAT)
- 12.2.1 North America

