
|
시장보고서
상품코드
1959567
지도제작용 LiDAR 시장 기회, 성장요인, 업계 동향 분석 및 예측(2026-2035년)LiDAR in Mapping Market Opportunity, Growth Drivers, Industry Trend Analysis, and Forecast 2026 - 2035 |
||||||
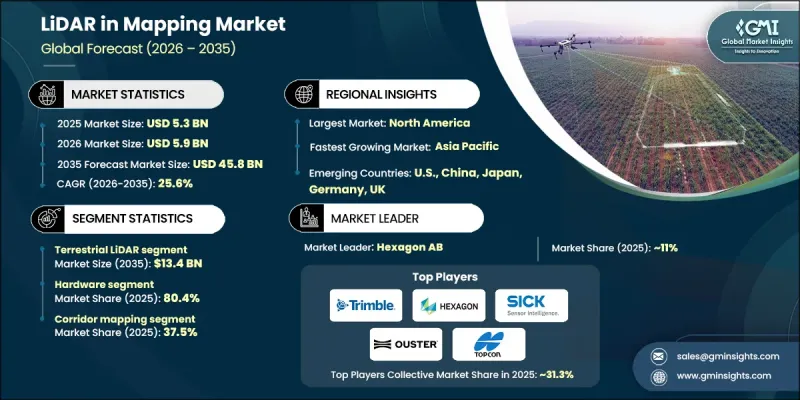
세계의 지도제작용 LiDAR 시장은 2025년에 53억 달러로 평가되었고, 2035년까지 연평균 복합 성장률(CAGR) 25.6%로 성장하여 458억 달러에 이를 것으로 예측됩니다.

시장 확대의 배경에는 LiDAR와 인공지능(AI), 지리정보시스템(GIS) 플랫폼, 신흥 디지털 트윈 솔루션과의 통합이 진행되고 있다는 점을 들 수 있습니다. 이를 통해 실시간 공간 분석과 자동 특징 추출이 가능해져 측량 워크플로우를 혁신적으로 변화시키고 있습니다. 구독형 및 서비스형 매핑(Mapping as a Service, MaaS)의 등장으로 막대한 초기 하드웨어 투자가 필요 없어져 LiDAR를 보다 쉽게 이용할 수 있게 되었습니다. 클라우드 기반 인프라는 공동 프로젝트 관리, 실시간 데이터 공유, 데이터 수집부터 전달까지 엔드 투 엔드 지형 공간 워크플로우 지원을 더욱 가능하게 합니다. 특히 북미와 유럽의 중소기업에서 채택이 두드러지고 있으며, 대규모 설비 투자 없이도 확장 가능한 처리의 이점을 누리고 있습니다. 정부 기관과 민간 기업 모두 효율적인 대규모 매핑과 실시간 지리적 공간 정보를 필요로 하는 가운데, LiDAR와 무인항공기(UAV), 자율주행차, 디지털 트윈의 통합이 시장 형성을 가속화하고 있습니다.
| 시장 범위 | |
|---|---|
| 개시 연도 | 2025년 |
| 예측 연도 | 2026-2035년 |
| 개시 금액 | 53억 달러 |
| 예측 금액 | 458억 달러 |
| CAGR | 25.6% |
지상형 LiDAR 부문은 2035년까지 134억 달러에 달할 것으로 예측됩니다. 인프라 개발, 건설, 도시계획 프로젝트에서의 활용이 성장을 주도하고 있습니다. 도로, 공공시설, 건물의 고정밀 매핑을 통해 엔지니어는 오차를 최소화하고, 자재 사용을 최적화하며, 공정을 가속화할 수 있습니다. 북미, 유럽, 아시아태평양의 각국 정부는 도시 개발 및 스마트시티 프로젝트에서 LiDAR 도입을 점점 더 의무화하고 있습니다. 또한, 모바일 및 핸드헬드형 지상 LiDAR 시스템의 발전으로 중규모 조직에서도 이러한 솔루션을 보다 쉽게 사용할 수 있게 되었습니다. AI 기반 점군 처리, BIM, GIS 플랫폼과의 통합으로 유틸리티, 산업 플랜트, 환경 모니터링의 예지보전, 실시간 의사결정, 효율성이 향상됩니다.
하드웨어 부문은 2025년 80.4%의 점유율을 차지했습니다. 항공기 탑재형, 지상형, UAV(무인항공기) 용도를 위한 첨단 LiDAR 센서 및 스캐닝 장비의 신뢰성, 비용 효율성, 규제 승인 등 다양한 이점이 있습니다. 정밀 매핑, 인프라 모니터링, 환경 분석에는 고밀도의 정확한 점군 데이터를 생성할 수 있는 전문 LiDAR 하드웨어가 요구되고 있으며, 북미, 유럽, 아시아태평양에서의 보급을 촉진하고 있습니다.
북미 매핑용 LiDAR 시장은 2025년 49.8%의 점유율을 차지할 것으로 예측됩니다. 이 지역의 성장은 대규모 인프라 프로젝트, 도시화, 교통망의 발전에 의해 주도되고 있습니다. 스마트시티, 홍수 매핑, 자산 관리 등 정부의 이니셔티브는 정밀한 지형 및 지형 공간 데이터 수집을 위해 LiDAR에 대한 의존도가 높아지고 있으며, 계획 수립, 운영 효율성, 도시 복원력 향상에 기여하고 있습니다. 이 지역에서는 UAV(무인항공기) 및 항공기 탑재형 LiDAR 시스템의 높은 도입률과 주요 제조업체의 강력한 R&D 투자가 시장 확대를 더욱 촉진하고 있습니다.
자주 묻는 질문
목차
제1장 조사 방법과 범위
제2장 주요 요약
제3장 업계 인사이트
제4장 경쟁 구도
제5장 시장 추산·예측 : 플랫폼별, 2022-2035년
제6장 시장 추산·예측 : 측거 원리별, 2022-2035년
제7장 시장 추산·예측 : 스캐닝 방식별, 2022-2035년
제8장 시장 추산·예측 : 컴포넌트별, 2022-2035년
제9장 시장 추산·예측 : 용도별, 2022-2035년
제10장 시장 추산·예측 : 지역별, 2022-2035년
제11장 기업 개요
LSH 26.03.26The Global LiDAR in Mapping Market was valued at USD 5.3 billion in 2025 and is estimated to grow at a CAGR of 25.6% to reach USD 45.8 billion by 2035.
Market expansion is driven by the growing integration of LiDAR with artificial intelligence, GIS platforms, and emerging digital twin solutions, which are transforming mapping workflows by enabling real-time spatial analytics and automated feature extraction. The rise of subscription-based and Mapping as a Service (MaaS) offerings is making LiDAR more accessible by eliminating significant upfront hardware investments. Cloud-based infrastructure further allows for collaborative project management, real-time data sharing, and end-to-end geospatial workflow support from data capture to delivery. Adoption is particularly strong among small to mid-sized enterprises in North America and Europe, which benefit from scalable processing without heavy capital expenditure. The integration of LiDAR with UAVs, autonomous vehicles, and digital twins is increasingly shaping the market, as both government bodies and private enterprises seek efficient, large-scale mapping and real-time geospatial insights.
| Market Scope | |
|---|---|
| Start Year | 2025 |
| Forecast Year | 2026-2035 |
| Start Value | $5.3 Billion |
| Forecast Value | $45.8 Billion |
| CAGR | 25.6% |
The terrestrial LiDAR segment is projected to reach USD 13.4 billion by 2035. Growth is fueled by its use in infrastructure development, construction, and urban planning projects. High-precision mapping of roads, utilities, and buildings allows engineers to minimize errors, optimize material usage, and accelerate timelines. Governments across North America, Europe, and Asia-Pacific are increasingly mandating LiDAR adoption for urban development and smart city projects. Advancements in mobile and handheld terrestrial LiDAR systems are also making these solutions more accessible for mid-sized organizations. Integration with AI-powered point-cloud processing, BIM, and GIS platforms enhances predictive maintenance, real-time decision-making, and efficiency in utilities, industrial plants, and environmental monitoring.
The hardware segment accounted for 80.4% share in 2025. Its dominance is due to the reliability, cost-effectiveness, and regulatory approval of advanced LiDAR sensors and scanning equipment for airborne, terrestrial, and UAV applications. Precision mapping, infrastructure monitoring, and environmental analysis demand specialized LiDAR hardware capable of generating dense and accurate point-cloud data, driving widespread adoption in North America, Europe, and Asia-Pacific.
North America LiDAR in Mapping Market contributed 49.8% share in 2025. Growth in the region is driven by extensive infrastructure projects, urbanization, and transportation development. Government initiatives in smart cities, flood mapping, and asset management increasingly rely on LiDAR for precise topographic and geospatial data, enhancing planning, operational efficiency, and urban resilience. The region benefits from high adoption of UAV and airborne LiDAR systems and strong R&D investments by leading manufacturers, which further propels market expansion.
Key companies in the Global LiDAR in Mapping Market include Hexagon AB, Teledyne Technologies Inc., Trimble Inc., RIEGL, FARO, Topcon, Vaisala, NV5 Global, Inc., Pix4D SA, Hesai Group, Valeo, Quanergy Solutions, Inc., Ouster Inc., Shanghai Slamtec Co., Ltd., and SICK AG. Companies in the LiDAR in mapping market are adopting multiple strategies to strengthen their presence. They are investing heavily in R&D to enhance sensor accuracy, range, and integration with AI, GIS, and digital twin platforms. Strategic collaborations with UAV, autonomous vehicle, and mapping service providers expand deployment opportunities. Cloud-based solutions and subscription models reduce upfront costs, broadening accessibility for small and mid-sized firms. Geographic expansion, localized support, and training programs help capture regional demand. Firms also focus on software ecosystem development, including AI-powered point-cloud processing, predictive maintenance, and real-time analytics, ensuring long-term adoption and recurring revenue streams.
Table of Contents
Chapter 1 Methodology and Scope
- 1.1 Market scope and definition
- 1.2 Research design
- 1.2.1 Research approach
- 1.2.2 Data collection methods
- 1.3 Data mining sources
- 1.3.1 Global
- 1.3.2 Regional/Country
- 1.4 Base estimates and calculations
- 1.4.1 Base year calculation
- 1.4.2 Key trends for market estimation
- 1.5 Primary research and validation
- 1.5.1 Primary sources
- 1.6 Forecast model
- 1.7 Research assumptions and limitations
Chapter 2 Executive Summary
- 2.1 Industry 360° synopsis, 2022 - 2035
- 2.2 Key market trends
- 2.2.1 System type trends
- 2.2.2 Deployment model trends
- 2.2.3 End-user industry trends
- 2.2.4 Regional trends
- 2.3 TAM analysis, 2025-2034
- 2.4 CXO perspectives: Strategic imperatives
- 2.4.1 Executive decision points
- 2.4.2 Critical success factors
- 2.5 Future outlook and strategic recommendations
Chapter 3 Industry Insights
- 3.1 Industry ecosystem analysis
- 3.1.1 Supplier landscape
- 3.1.2 Profit margin analysis
- 3.1.3 Cost structure
- 3.1.4 Value addition at each stage
- 3.1.5 Factor affecting the value chain
- 3.1.6 Disruptions
- 3.2 Industry impact forces
- 3.2.1 Growth drivers
- 3.2.1.1 Rising demand for high-accuracy geospatial data
- 3.2.1.2 Rapid infrastructure development & urbanization
- 3.2.1.3 Increasing government-led national mapping & resilience programs
- 3.2.1.4 Rapid adoption of UAV-based lidar mapping
- 3.2.1.5 Growth in environmental monitoring & climate applications
- 3.2.2 Industry pitfalls and challenges
- 3.2.2.1 High initial capital cost
- 3.2.2.2 Complex data processing & skill requirements
- 3.2.3 Market opportunities
- 3.2.3.1 Growth of subscription-based & mapping-as-a-service models
- 3.2.3.2 Expansion opportunities in underpenetrated markets
- 3.2.1 Growth drivers
- 3.3 Regulatory landscape
- 3.3.1 North America
- 3.3.2 Europe
- 3.3.3 Asia Pacific
- 3.3.4 Latin America
- 3.3.5 Middle East & Africa
- 3.4 Porter’s analysis
- 3.5 PESTEL analysis
- 3.6 Technology and innovation landscape
- 3.6.1 Current technological trends
- 3.6.2 Emerging technologies
- 3.7 Emerging business models
- 3.8 Compliance requirements
- 3.9 Patent and IP analysis
- 3.10 Geopolitical and trade dynamics
Chapter 4 Competitive Landscape, 2024
- 4.1 Introduction
- 4.2 Company market share analysis
- 4.2.1 By region
- 4.2.1.1 North America
- 4.2.1.2 Europe
- 4.2.1.3 Asia Pacific
- 4.2.1.4 Latin America
- 4.2.1.5 Middle East & Africa
- 4.2.1 By region
- 4.3 Competitive benchmarking of key players
- 4.3.1 Financial performance comparison
- 4.3.1.1 Revenue
- 4.3.1.2 Profit margin
- 4.3.1.3 R&D
- 4.3.2 Product portfolio comparison
- 4.3.2.1 Product range breadth
- 4.3.2.2 Technology
- 4.3.2.3 Innovation
- 4.3.3 Geographic presence comparison
- 4.3.3.1 Global footprint analysis
- 4.3.3.2 Service network coverage
- 4.3.3.3 Market penetration by region
- 4.3.4 Competitive positioning matrix
- 4.3.4.1 Leaders
- 4.3.4.2 Challengers
- 4.3.4.3 Followers
- 4.3.4.4 Niche players
- 4.3.5 Strategic outlook matrix
- 4.3.1 Financial performance comparison
- 4.4 Key developments, 2021-2024
- 4.4.1 Mergers and acquisitions
- 4.4.2 Partnerships and collaborations
- 4.4.3 Technological advancements
- 4.4.4 Expansion and investment strategies
- 4.4.5 Digital transformation initiatives
- 4.5 Emerging/ startup competitors’ landscape
Chapter 5 Market Estimates and Forecast, By Platform, 2022 - 2035 (USD Mn)
- 5.1 Key trends
- 5.1.1 Drone
- 5.1.1.1 Fixed wing drones
- 5.1.1.2 Single rotor drones
- 5.1.1.3 Multi rotor drones
- 5.1.2 Terrestrial LiDAR
- 5.1.2.1 Stationary
- 5.1.2.2 Mobile
- 5.1.3 Manned Airborne LiDAR
- 5.1.4 Handheld / Backpack LiDAR Specialized pallets
- 5.1.1 Drone
Chapter 6 Market Estimates and Forecast, By Ranging Principle, 2022 - 2035 (USD Mn)
- 6.1 Key trends
- 6.2 Time-of-Flight (ToF) LiDAR
- 6.3 Phase Shift LiDAR
- 6.4 Frequency-Modulated Continuous Wave (FMCW)
Chapter 7 Market Estimates and Forecast, By Scanning Architecture, 2022 - 2035 (USD Mn)
- 7.1 Key trends
- 7.2 Mechanical Scanning
- 7.3 Solid-State Scanning
Chapter 8 Market Estimates and Forecast, By Component, 2022 - 2035 (USD Mn)
- 8.1 Key trends
- 8.2 Hardware
- 8.3 Software
Chapter 9 Market Estimates and Forecast, By Application, 2022 - 2035 (USD Mn)
- 9.1 Key trends
- 9.2 Corridor mapping
- 9.3 Construction & Surveying
- 9.4 Agriculture & Forestry
- 9.5 Mining & Quarrying
- 9.6 Education
- 9.7 Environmental
- 9.8 Transport
- 9.9 Emergency services
- 9.10 Others
Chapter 10 Market Estimates and Forecast, By Region, 2022 - 2035 (USD Mn)
- 10.1 Key trends
- 10.2 North America
- 10.2.1 U.S.
- 10.2.2 Canada
- 10.3 Europe
- 10.3.1 Germany
- 10.3.2 UK
- 10.3.3 France
- 10.3.4 Spain
- 10.3.5 Italy
- 10.3.6 Netherlands
- 10.4 Asia Pacific
- 10.4.1 China
- 10.4.2 India
- 10.4.3 Japan
- 10.4.4 Australia
- 10.4.5 South Korea
- 10.5 Latin America
- 10.5.1 Brazil
- 10.5.2 Mexico
- 10.5.3 Argentina
- 10.6 Middle East and Africa
- 10.6.1 South Africa
- 10.6.2 Saudi Arabia
- 10.6.3 UAE
Chapter 11 Company Profiles
- 11.1 Trimble Inc.
- 11.2 Hexagon AB
- 11.3 SICK AG
- 11.4 Topcon
- 11.5 Ouster Inc.
- 11.6 RIEGL
- 11.7 FARO
- 11.8 Quanergy Solutions, Inc.
- 11.9 Teledyne Technologies Inc.
- 11.10 Valeo
- 11.11 NV5 Global, Inc.
- 11.12 Shanghai Slamtec Co., Ltd.
- 11.13 Vaisala
- 11.14 Hesai Group.
- 11.15 Pix4D SA
