
|
시장보고서
상품코드
1959576
위협 감지 장비 시장 기회, 성장요인, 업계 동향 분석 및 예측(2026-2035년)Threat Detection Equipment Market Opportunity, Growth Drivers, Industry Trend Analysis, and Forecast 2026 - 2035 |
||||||
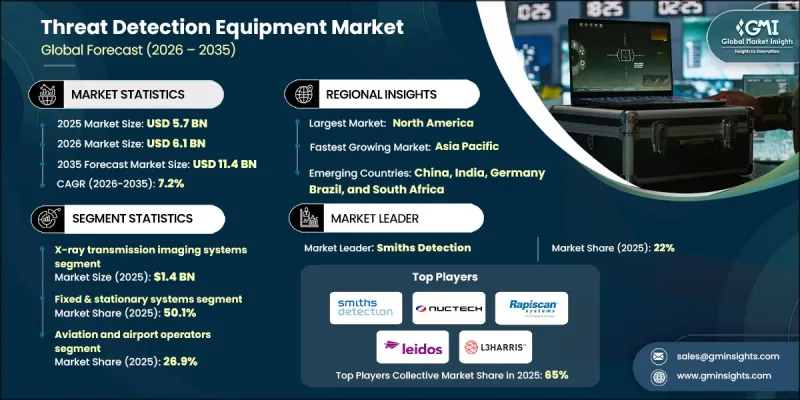
세계의 위협 감지 장비 시장은 2025년에 57억 달러로 평가되었고, 2035년까지 연평균 복합 성장률(CAGR) 7.2%로 성장하여 114억 달러에 이를 것으로 예측됩니다.

시장 확대의 주요 요인으로는 항공보안 규제 강화, 도시 감시 인프라 확충, 국방 및 국토안보 분야 지출의 지속적인 증가를 들 수 있습니다. 또한, 세계 무역량이 증가함에 따라 고위험 수준에 대응할 수 있는 첨단 화물 검사 기술 및 항만 보호 기술에 대한 수요도 증가하고 있습니다. 감지 플랫폼에 인공지능(AI)을 통합하여 위협 식별 정확도를 크게 향상시키고 오탐을 줄이며 스크리닝 효율을 개선하고 있습니다. 세계 각국의 보안 당국은 여객, 수하물, 화물 검사 기준을 강화하고, 검사 인프라의 현대화를 가속화하고 있습니다. 영상 검사, 흔적 감지, 생체 인식, 방사선 모니터링을 통합 플랫폼에 결합한 다층 감지 시스템으로의 전환은 업계 상황을 변화시키고 있습니다. 이러한 변화는 2010년대 초반에 더욱 가속화되었으며, 운영업체들이 확장성과 중앙집중식 지휘통제 통합을 우선시하는 가운데 2030년까지 지속될 것으로 예측됩니다. 또한, 조직이 감시 체계 강화, 인력 배치 최적화, 위협 해결의 신속성을 요구함에 따라 원격 및 중앙 집중식 스크리닝 모델의 채택이 가속화되고 있습니다.
| 시장 범위 | |
|---|---|
| 개시 연도 | 2025년 |
| 예측 연도 | 2026-2035년 |
| 개시 연도 가치 | 57억 달러 |
| 예측 금액 | 114억 달러 |
| CAGR | 7.2% |
X선 투과 이미징 시스템 부문은 2025년 14억 달러에 달할 것으로 예측됩니다. 이 시스템은 검증된 신뢰성과 규제 당국의 승인으로 교통 허브, 국경 관리 지점, 화물 시설 및 교통량이 많은 공공 장소에서 높은 채택률을 유지하고 있습니다. 수하물, 소포, 화물을 빠른 처리 속도로 검사할 수 있는 능력은 엄격한 보안 환경에서도 지속적인 운영을 가능하게 합니다. 확립된 교육 체계와 운영 숙련도는 대량 검사 환경에서 이 시스템의 선도적 입지를 더욱 강화합니다.
고정형 시스템 부문은 2025년 50.1%의 점유율을 차지했습니다. 이 장비들은 중단 없는 대용량 스크리닝이 요구되는 교통 관문 및 중요 인프라 시설에 널리 도입되고 있습니다. 안정적인 성능, 규제 준수, 중앙 집중식 관리 플랫폼과의 호환성이 장기적인 수요를 뒷받침하고 있습니다. 광범위한 보안 네트워크와의 통합을 통해 연계 모니터링과 효율적인 대응 프로토콜을 가능하게 하여 위협 감지 장비 업계에서 지배적인 점유율을 강화하고 있습니다.
북미 위협 감지 장비 시장은 2025년 31%의 점유율을 차지했습니다. 이 지역의 성장은 엄격한 규제 요건, 지속적인 국토 안보 기금, 교통 및 인프라 자산 전반에 걸친 검사 기술의 지속적인 업그레이드를 통해 뒷받침되고 있습니다. 당국과 민간 사업자들은 진화하는 연방 기준과 위험 관리 프레임워크에 부합하기 위해 첨단 이미징 기술, 컴퓨터 단층 촬영(CT), 방사선 모니터링, 생체 인식 시스템 도입을 확대하고 있습니다. AI 기반 분석, 자동 검사 레인, 통합 지휘통제 솔루션에 대한 투자는 지역 전체에 걸쳐 감지 정확도와 운영 효율성을 향상시키고 있습니다.
자주 묻는 질문
목차
제1장 조사 방법과 범위
제2장 주요 요약
제3장 업계 인사이트
제4장 경쟁 구도
제5장 시장 추산 및 예측 : 감지 기술별, 2022-2035
제6장 시장 추산 및 예측 : 감지 위협 카테고리별, 2022-2035
제7장 시장 추산 및 예측 : 제품 형태별, 2022-2035
제8장 시장 추산 및 예측 : 도입 형태별, 2022-2035
제9장 시장 추산 및 예측 : 최종사용자별, 2022-2035
제10장 시장 추산 및 예측 : 지역별, 2022-2035
제11장 기업 개요
LSH 26.03.18The Global Threat Detection Equipment Market was valued at USD 5.7 billion in 2025 and is estimated to grow at a CAGR of 7.2% to reach USD 11.4 billion by 2035.
Market expansion is driven by tightening aviation security regulations, expanding urban surveillance infrastructure, and sustained growth in defense and homeland security spending. Increasing global trade flows are also strengthening demand for advanced cargo inspection and port protection technologies capable of managing elevated risk levels. The integration of artificial intelligence into detection platforms is significantly enhancing threat identification accuracy, reducing false positives, and improving screening efficiency. Security authorities worldwide are reinforcing standards for passenger, baggage, and cargo inspection, accelerating the modernization of screening infrastructure. A transition toward multi-layered detection systems that combine imaging, trace detection, biometric verification, and radiation monitoring into unified platforms is reshaping the industry landscape. This shift, which gained traction earlier in the decade, is expected to continue through 2030 as operators prioritize scalability and centralized command integration. Additionally, remote and centralized screening models are gaining momentum as organizations seek improved oversight, workforce optimization, and faster threat resolution.
| Market Scope | |
|---|---|
| Start Year | 2025 |
| Forecast Year | 2026-2035 |
| Start Value | $5.7 Billion |
| Forecast Value | $11.4 Billion |
| CAGR | 7.2% |
The X-ray transmission imaging systems segment reached USD 1.4 billion in 2025. These systems maintain strong adoption across transportation hubs, border control points, cargo facilities, and high-traffic public locations due to their proven reliability and regulatory acceptance. Their capability to screen baggage, parcels, and freight at high throughput rates supports continuous operations in demanding security environments. Established training frameworks and operational familiarity further reinforce their leadership position in high-volume inspection settings.
The fixed and stationary systems segment accounted for 50.1% share in 2025. These installations are widely deployed at transportation gateways and critical infrastructure facilities where uninterrupted, high-capacity screening is required. Their consistent performance, regulatory compliance, and compatibility with centralized command platforms sustain long-term demand. Integration with broader security networks enables coordinated monitoring and streamlined response protocols, strengthening their dominant share within the threat detection equipment industry.
North America Threat Detection Equipment Market held 31% share in 2025. Regional growth is supported by stringent regulatory requirements, sustained homeland security funding, and continuous upgrades of inspection technologies across transportation and infrastructure assets. Authorities and private operators are increasingly implementing advanced imaging, computed tomography, radiation monitoring, and biometric systems to align with evolving federal standards and risk management frameworks. Investment in AI-driven analytics, automated inspection lanes, and integrated command-and-control solutions is enhancing detection precision and operational efficiency throughout the region.
Key companies operating in the Global Threat Detection Equipment Market include Smiths Detection, Rapiscan Systems, L3Harris Technologies, Thales, Lockheed Martin, Raytheon Technologies, Safran Electronics & Defense, Nuctech Company Limited, Leidos Holdings, Inc., Honeywell International, Analogic Corporation, Astrophysics Inc., Garrett Metal Detectors, Chemring Group, FLIR Systems (Teledyne FLIR), and CEIA S.p.A. Companies in the Threat Detection Equipment Market are reinforcing their competitive advantage through technology innovation, system integration, and long-term government partnerships. Leading vendors are investing in AI-powered analytics, automation capabilities, and multi-sensor fusion platforms to enhance detection accuracy and reduce inspection time. Strategic collaborations with aviation authorities, defense agencies, and border security organizations support multi-year procurement contracts and recurring service revenue. Firms are also expanding global service networks to provide maintenance, upgrades, and training solutions.
Table of Contents
Chapter 1 Methodology and Scope
- 1.1 Market scope and definition
- 1.2 Research design
- 1.2.1 Research approach
- 1.2.2 Data collection methods
- 1.3 Data mining sources
- 1.3.1 Global
- 1.3.2 Regional/Country
- 1.4 Base estimates and calculations
- 1.4.1 Base year calculation
- 1.4.2 Key trends for market estimation
- 1.5 Primary research and validation
- 1.5.1 Primary sources
- 1.6 Forecast model
- 1.7 Research assumptions and limitations
Chapter 2 Executive Summary
- 2.1 Industry 360° synopsis, 2022 - 2035
- 2.2 Key market trends
- 2.2.1 Detection technology trends
- 2.2.2 Threat category detected trends
- 2.2.3 Product form factor trends
- 2.2.4 Deployment mode trends
- 2.2.5 End-User trends
- 2.2.6 Regional trends
- 2.3 TAM Analysis, 2026-2035
- 2.4 CXO perspectives: Strategic imperatives
- 2.4.1 Executive decision points
- 2.4.2 Critical success factors
- 2.5 Future outlook and strategic recommendations
Chapter 3 Industry Insights
- 3.1 Industry ecosystem analysis
- 3.1.1 Supplier Landscape
- 3.1.2 Profit Margin
- 3.1.3 Cost structure
- 3.1.4 Value addition at each stage
- 3.1.5 Factor affecting the value chain
- 3.1.6 Disruptions
- 3.2 Industry impact forces
- 3.2.1 Growth drivers
- 3.2.2 Stricter aviation security mandates worldwide
- 3.2.3 Urbanization driving smart city surveillance deployments
- 3.2.4 Increased defense and homeland security budgets
- 3.2.5 AI-powered analytics improving detection accuracy
- 3.2.6 Growth in cross-border trade and ports
- 3.2.7 Industry pitfalls and challenges
- 3.2.8 False alarms causing operational disruptions
- 3.2.9 Interoperability issues across legacy systems
- 3.2.10 Market opportunities
- 3.2.11 AI retrofits for installed detection systems
- 3.2.12 Public-private security modernization programs
- 3.3 Growth potential analysis
- 3.4 Regulatory landscape
- 3.4.1 North America
- 3.4.2 Europe
- 3.4.3 Asia Pacific
- 3.4.4 Latin America
- 3.4.5 Middle East & Africa
- 3.5 Porter's analysis
- 3.6 PESTEL analysis
- 3.7 Technology and Innovation landscape
- 3.7.1 Current technological trends
- 3.7.2 Emerging technologies
- 3.8 Price trends
- 3.8.1 By region
- 3.8.2 By product
- 3.9 Pricing Strategies
- 3.10 Emerging Business Models
- 3.11 Compliance Requirements
- 3.12 Patent and IP analysis
- 3.13 Geopolitical and trade dynamics
Chapter 4 Competitive Landscape, 2025
- 4.1 Introduction
- 4.2 Company market share analysis
- 4.2.1 By region
- 4.2.1.1 North America
- 4.2.1.2 Europe
- 4.2.1.3 Asia Pacific
- 4.2.1.4 Latin America
- 4.2.1.5 Middle East & Africa
- 4.2.2 Market concentration analysis
- 4.2.1 By region
- 4.3 Competitive benchmarking of key players
- 4.3.1 Financial performance comparison
- 4.3.1.1 Revenue
- 4.3.1.2 Profit margin
- 4.3.1.3 R&D
- 4.3.2 Product portfolio comparison
- 4.3.2.1 Product range breadth
- 4.3.2.2 Technology
- 4.3.2.3 Innovation
- 4.3.3 Geographic presence comparison
- 4.3.3.1 Global footprint analysis
- 4.3.3.2 Service network coverage
- 4.3.3.3 Market penetration by region
- 4.3.4 Competitive positioning matrix
- 4.3.4.1 Leaders
- 4.3.4.2 Challengers
- 4.3.4.3 Followers
- 4.3.4.4 Niche players
- 4.3.5 Strategic outlook matrix
- 4.3.1 Financial performance comparison
- 4.4 Key developments
- 4.4.1 Mergers and acquisitions
- 4.4.2 Partnerships and collaborations
- 4.4.3 Technological advancements
- 4.4.4 Expansion and investment strategies
- 4.4.5 Digital transformation initiatives
- 4.5 Emerging/ startup competitors landscape
Chapter 5 Market Estimates and Forecast, By Detection Technology, 2022 - 2035 (USD Million)
- 5.1 Key trends
- 5.2 X-ray transmission imaging systems
- 5.3 Trace detection systems
- 5.4 Spectroscopy-based detection systems
- 5.5 Radiation detection systems
- 5.6 Metal detection systems
- 5.7 Millimeter-wave imaging systems
Chapter 6 Market Estimates and Forecast, By Threat Category Detected, 2022 - 2035 (USD Million)
- 6.1 Key trends
- 6.2 Explosives & improvised explosive devices (IEDS)
- 6.3 Weapons & metallic threats
- 6.4 Multi-threat detection systems
- 6.5 Narcotics & contraband
- 6.6 Biological agents
- 6.7 Chemical agents & toxic industrial chemicals (TICS)
- 6.8 Radiological & nuclear materials
Chapter 7 Market Estimates and Forecast, By Product Form Factor, 2022 - 2035 (USD Million)
- 7.1 Key trends
- 7.2 Fixed & stationary systems
- 7.3 Portable & transportable systems
- 7.4 Handheld devices
- 7.5 Vehicle-mounted & mobile systems
- 7.6 Wearable detection systems
Chapter 8 Market Estimates and Forecast, By Deployment Mode, 2022 - 2035 (USD Million)
- 8.1 Key trends
- 8.2 Checkpoint & access control screening
- 8.3 Perimeter & standoff detection
- 8.4 Area & ambient monitoring
- 8.5 Mobile & patrol-based detection
- 8.6 Cargo & freight inspection
Chapter 9 Market Estimates and Forecast, By End-User, 2022 - 2035 (USD Million)
- 9.1 Key trends
- 9.2 Aviation & airport operators
- 9.3 Government security & regulatory agencies
- 9.4 Defense & military organizations
- 9.5 Corrections & justice system operators
- 9.6 Critical infrastructure operators
- 9.7 Transportation & logistics operators
- 9.8 Commercial & private sector
Chapter 10 Market Estimates and Forecast, By Region, 2022 - 2035 (USD Million)
- 10.1 Key trends
- 10.2 North America
- 10.2.1 U.S.
- 10.2.2 Canada
- 10.3 Europe
- 10.3.1 Germany
- 10.3.2 UK
- 10.3.3 France
- 10.3.4 Spain
- 10.3.5 Italy
- 10.3.6 Russia
- 10.4 Asia Pacific
- 10.4.1 China
- 10.4.2 India
- 10.4.3 Japan
- 10.4.4 Australia
- 10.4.5 South Korea
- 10.5 Latin America
- 10.5.1 Brazil
- 10.5.2 Mexico
- 10.5.3 Argentina
- 10.6 Middle East and Africa
- 10.6.1 South Africa
- 10.6.2 Saudi Arabia
- 10.6.3 UAE
Chapter 11 Company Profiles
- 11.1 Global Key Players
- 11.1.1 Smith's Detection
- 11.1.2 Raytheon Technologies
- 11.1.3 Lockheed Martin
- 11.1.4 L3Harris Technologies
- 11.1.5 Thales
- 11.2 Regional key players
- 11.2.1 North America
- 11.2.1.1 Rapiscan Systems
- 11.2.1.2 Leidos Holdings, Inc.
- 11.2.1.3 FLIR Systems (Teledyne FLIR)
- 11.2.1.4 Analogic Corporation
- 11.2.2 Asia Pacific
- 11.2.2.1 Nuctech Company Limited
- 11.2.3 Europe
- 11.2.3.1 Safran Electronics & Defense
- 11.2.3.2 CEIA S.p.A.
- 11.2.3.3 Chemring Group
- 11.2.1 North America
- 11.3 Niche Players/Disruptors
- 11.3.1 Astrophysics Inc.
- 11.3.2 Garrett Metal Detectors
- 11.3.3 Honeywell International
