


|
시장보고서
상품코드
1959629
배터리 전기버스 시장 기회, 성장요인, 업계 동향 분석 및 예측(2026-2035년)Battery Electric Buses Market Opportunity, Growth Drivers, Industry Trend Analysis, and Forecast 2026 - 2035 |
||||||
세계의 배터리 전기버스 시장은 2025년에 430억 달러로 평가되었고, 2035년에는 16.1%의 연평균 복합 성장률(CAGR)로 성장하여 1,968억 달러에 이를 것으로 예측됩니다.
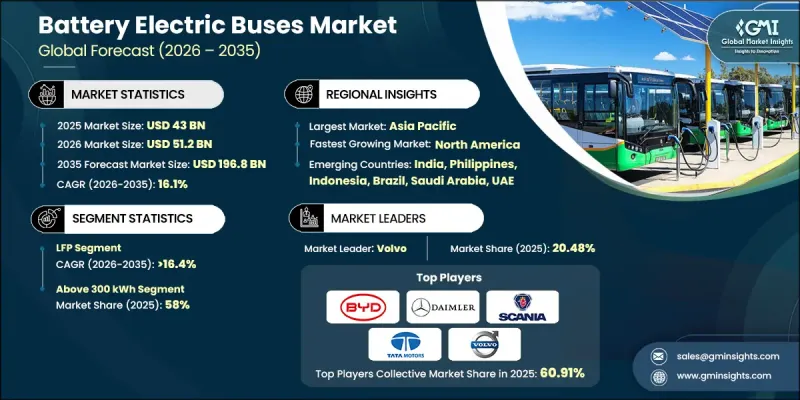
무공해 대중교통으로의 전환은 전 세계 도시 간 및 도시 내 버스 차량의 계획, 조달 및 운영을 변화시키고 있습니다. 배터리 전기버스(BEB)는 도시 대기오염, 온실가스 배출, 소음 공해에 대한 대책으로 지속가능한 모빌리티 구상의 핵심이 되고 있습니다. 승용 전기차와 달리 BEB는 고정된 경로를 고빈도로 운행하기 때문에 신뢰성, 충전 시간, 총소유비용이 장기적인 차량 도입에 있어 매우 중요합니다. 도시 전기화에 대한 투자 증가, 민관 협력, 배터리 리스, Fleet-as-a-Service와 같은 혁신적인 자금 조달 모델이 시장을 견인하고 있습니다. 도시와 교통 당국은 노선 최적화, 에너지 효율적인 충전 인프라, 수명주기 비용 관리를 우선시하고 있으며, BEB는 현대적이고 지속 가능한 교통 네트워크의 필수적인 요소로 자리 잡고 있습니다.
| 시장 범위 | |
|---|---|
| 개시 연도 | 2025년 |
| 예측 연도 | 2026-2035년 |
| 개시 연도 가치 | 430억 달러 |
| 예측 금액 | 1,968억 달러 |
| CAGR | 16.1% |
배터리 전기버스는 디젤 버스의 단순한 개조가 아닌 통합된 모빌리티 솔루션으로 개발되고 있습니다. 대용량 배터리 팩, 전기 트랙션 모터, 회생 브레이크, 첨단 파워 일렉트로닉스, 에너지 관리 소프트웨어와 같은 주요 시스템은 효율성, 항속거리, 승객 수용 능력을 극대화하기 위해 통합적으로 설계되었습니다. OEM 제조업체와 교통 사업자는 현재 초기 비용보다 노선 적합성, 차량 기지 인프라, 장기적인 유지 관리 비용과 같은 운영 요소에 초점을 맞추었습니다. 지자체, 에너지 사업자, 충전 인프라 제공업체의 협력적 접근 방식은 도입을 가속화하는 동시에 프로젝트 리스크를 감소시키고 있습니다. 일괄 계약, 배터리 리스 모델, 차고 기반 충전 네트워크를 통해 사업자는 차량군의 안정적인 성능 유지와 재정적 지속가능성을 실현할 수 있습니다.
리튬인산철(LFP) 배터리 부문은 2025년 57%의 점유율을 차지할 것으로 예상되며, 2035년까지 연평균 복합 성장률(CAGR) 16.4%를 나타낼 것으로 예측됩니다. LFP 배터리는 우수한 열 안정성, 안전성, 긴 수명 주기를 특징으로 하기 때문에 가동률이 높은 시내버스(BEB)에 가장 적합한 선택으로 전기 버스(BEB)에 채택되고 있습니다. 잦은 충방전 사이클을 견디면서 과열 위험을 최소화하는 특성은 인구가 밀집된 도시 지역에서 매우 중요합니다. 비용 효율성과 내구성이 뛰어나며, 지속가능한 대중교통의 표준 솔루션으로 차량 운영업체들이 LFP 기술을 채택하는 것을 더욱 촉진하고 있습니다.
2025년 기준 40-70석 규모의 버스 부문이 큰 비중을 차지하며, 도시 및 교외 대중교통 네트워크의 표준 구성이 될 것으로 예측됩니다. 이 좌석 수는 승객 수용력, 이동성, 노선 유연성 사이에서 최적의 균형을 제공합니다. 기존 도로, 차량 기지, 충전 인프라와의 호환성을 통해 기존 교통 시스템에 원활하게 통합할 수 있으며, 이 카테고리는 차량 운영 사업자들 사이에서 가장 광범위하게 채택되고 있습니다. 고주파 노선을 효율적으로 운행할 수 있는 능력과 지속적인 사용 하에서 운영 성능 유지가 시장에서의 우위를 뒷받침하고 있습니다.
중국의 배터리 전기버스 시장은 2026년부터 2035년까지 견조한 CAGR로 확대될 것으로 예측됩니다. 국가 및 지방 정부는 적극적인 전기화 의무화, 대규모 조달 계획, 보조금, 세제 혜택, 무공해 차량 전용 기금 등 재정적 인센티브를 제공합니다. 도시지역에서는 이미 버스 차량의 전기화가 거의 완료되어 안정적이고 표준화된 기술 도입 환경이 확보되어 있습니다. 정부 주도의 프로그램은 차고 충전 시설과 에너지 관리 시스템을 포함한 인프라 확충을 지원하여 도입을 더욱 촉진하고 있습니다. 정책 주도의 추진과 국내 제조 역량이 결합되어 이 지역의 BEB(배터리 전기버스)에 유리한 성장 환경이 조성되고 있습니다.
자주 묻는 질문
목차
제1장 조사 방법
제2장 주요 요약
제3장 업계 인사이트
제4장 경쟁 구도
제5장 시장 추산 및 예측 : 배터리 화학별, 2022-2035
제6장 시장 추산 및 예측 : 배터리 용량별, 2022-2035
제7장 시장 추산 및 예측 : 버스 길이별, 2022-2035
제8장 시장 추산 및 예측 : 좌석수별, 2022-2035
제9장 시장 추산 및 예측 : 용도별, 2022-2035
제10장 시장 추산 및 예측 : 최종 용도별, 2022-2035
제11장 시장 추산 및 예측 : 지역별, 2022-2035
제12장 기업 개요
LSH 26.03.16The Global Battery Electric Buses Market was valued at USD 43 billion in 2025 and is estimated to grow at a CAGR of 16.1% to reach USD 196.8 billion in 2035.

The shift toward zero-emission public transportation is transforming the planning, procurement, and operation of urban and intercity bus fleets worldwide. Battery electric buses (BEBs) are becoming central to sustainable mobility initiatives, tackling urban air pollution, greenhouse gas emissions, and noise pollution. Unlike passenger EVs, BEBs operate on high-frequency, fixed routes, making reliability, charging time, and total cost of ownership crucial for long-term fleet deployment. The market is benefiting from increasing investment in urban electrification, public-private partnerships, and innovative financing models such as battery leasing and fleet-as-a-service. Cities and transit authorities are prioritizing route optimization, energy-efficient charging infrastructure, and lifecycle cost management, making BEBs an essential component of modern, sustainable transportation networks.
| Market Scope | |
|---|---|
| Start Year | 2025 |
| Forecast Year | 2026-2035 |
| Start Value | $43 Billion |
| Forecast Value | $196.8 Billion |
| CAGR | 16.1% |
Battery electric buses are being developed as integrated mobility solutions rather than simple conversions of diesel buses. Key systems such as high-capacity battery packs, electric traction motors, regenerative braking, advanced power electronics, and energy management software are designed together to maximize efficiency, range, and passenger capacity. OEMs and transit operators now focus on operational factors like route compatibility, depot infrastructure, and long-term maintenance costs over upfront pricing. Collaborative approaches among city governments, energy utilities, and charging infrastructure providers are accelerating adoption while reducing project risks. Bundled contracts, battery leasing models, and depot-based charging networks are enabling operators to maintain consistent fleet performance and financial sustainability.
The LFP (Lithium Iron Phosphate) battery segment accounted for 57% share in 2025 and is projected to grow at a CAGR of 16.4% through 2035. LFP batteries are preferred in BEBs for their enhanced thermal stability, safety profile, and long cycle life, making them ideal for high-utilization urban buses. They can endure frequent charging and discharging cycles while minimizing risks of overheating, which is critical in densely populated urban areas. Their cost efficiency and durability further encourage fleet operators to adopt LFP technology as a standard solution for sustainable public transportation.
The buses with 40-70 seats segment held a sizeable share in 2025, representing the standard configuration for urban and suburban public transit networks. This seating range offers the optimal balance between passenger capacity, maneuverability, and route flexibility. Compatibility with existing roads, depots, and charging infrastructure facilitates seamless integration into current transit systems, making this category the most widely adopted among fleet operators. Their ability to serve high-frequency routes efficiently while maintaining operational performance under continuous use drives their market dominance.
China Battery Electric Buses Market will grow at a decent CAGR during 2026-2035. National and local governments are implementing aggressive electrification mandates, large-scale procurement initiatives, and financial incentives such as subsidies, tax benefits, and dedicated funding for zero-emission fleets. Urban centers have already achieved near-full electrification of bus fleets, ensuring a stable and standardized technology deployment environment. Government-led programs support infrastructure expansion, including depot charging and energy management systems, further strengthening adoption. The policy-driven push, combined with domestic manufacturing capabilities, is creating a favorable growth ecosystem for BEBs in the region.
Key players in the Global Battery Electric Buses Market include Volvo, BYD, MAN Bus, Scania, Daimler, Zhongtong Bus, Tata Motors, NFI, Proterra, and Solaris Bus & Coach. Companies in the Global Battery Electric Buses Market are strengthening their presence by investing in R&D to enhance battery efficiency, reduce charging times, and increase vehicle range. Strategic alliances with energy providers, city transit authorities, and technology partners allow manufacturers to offer integrated mobility solutions. Expansion into emerging markets, development of scalable depot-based charging infrastructure, and deployment of fleet-as-a-service and battery leasing models help operators manage capital costs while ensuring operational reliability. OEMs are also standardizing vehicle components, modularizing designs for different fleet sizes, and enhancing after-sales support to maintain performance and build long-term customer relationships, thereby solidifying market foothold and accelerating adoption worldwide.
Table of Contents
Chapter 1 Methodology
- 1.1 Research approach
- 1.2 Quality commitments
- 1.2.1 GMI AI policy & data integrity commitment
- 1.3 Research trail & confidence scoring
- 1.3.1 Research trail components
- 1.3.2 Scoring components
- 1.4 Data collection
- 1.4.1 Partial list of primary sources
- 1.5 Data mining sources
- 1.5.1 Paid sources
- 1.6 Base estimates and calculations
- 1.6.1 Base year calculation
- 1.7 Forecast model
- 1.8 Research transparency addendum
Chapter 2 Executive Summary
- 2.1 Industry 360° synopsis, 2022 - 2035
- 2.2 Key market trends
- 2.2.1 Regional
- 2.2.2 Battery Chemistry
- 2.2.3 Battery Capacity
- 2.2.4 Bus Length
- 2.2.5 Seating Capacity
- 2.2.6 Application
- 2.2.7 End Use
- 2.3 TAM Analysis, 2026-2035
- 2.4 CXO perspectives: Strategic imperatives
Chapter 3 Industry Insights
- 3.1 Industry ecosystem analysis
- 3.1.1 Supplier landscape
- 3.1.2 Profit margin analysis
- 3.1.3 Cost structure
- 3.1.4 Value addition at each stage
- 3.1.5 Factor affecting the value chain
- 3.1.6 Disruptions
- 3.2 Industry impact forces
- 3.2.1 Growth drivers
- 3.2.1.1 Rise in government subsidies and public transport electrification programs
- 3.2.1.2 Surge in urban air pollution and stringent emission regulations
- 3.2.1.3 Increase in battery performance and decline in battery costs
- 3.2.1.4 Rise in fuel prices and operating costs of diesel buses
- 3.2.2 Industry pitfalls and challenges
- 3.2.2.1 High upfront cost of battery electric buses
- 3.2.2.2 Battery degradation and replacement cost concerns
- 3.2.3 Market opportunities
- 3.2.3.1 Increase in adoption of high-capacity battery electric buses
- 3.2.3.2 Surge in participation of private fleet operators
- 3.2.3.3 Rise in battery recycling and second-life applications
- 3.2.3.4 Increase in deployment of smart and connected electric bus solutions
- 3.2.1 Growth drivers
- 3.3 Growth potential analysis
- 3.4 Regulatory landscape
- 3.4.1 North America
- 3.4.1.1 Federal Transit Administration (FTA) Low or No Emission Bus Program
- 3.4.1.2 EPA Clean School Bus Program
- 3.4.1.3 California Advanced Clean Fleets (ACF) Regulation.
- 3.4.2 Europe
- 3.4.2.1 European Union: Clean Vehicles Directive (CVD)
- 3.4.2.2 Germany: Federal Zero-Emission Bus Funding Program
- 3.4.2.3 United Kingdom: Zero-Emission Bus Regional Areas (ZEBRA & ZEBRA 2) Program
- 3.4.2.4 France: Energy Transition for Green Growth Law
- 3.4.3 Asia Pacific
- 3.4.3.1 China: New Energy Bus (NEB) Promotion & Procurement Policies
- 3.4.3.2 Japan: Green Growth Strategy for Decarbonized Public Transport
- 3.4.3.3 South Korea: Eco-Friendly Vehicle Roadmap for Public Transport
- 3.4.3.4 Singapore: Green Public Transport Programme (GPTP)
- 3.4.4 Latin America
- 3.4.4.1 Brazil: Municipal Zero-Emission Bus Procurement Mandates
- 3.4.4.2 Mexico: Clean Transport and Public Fleet Modernization Policies
- 3.4.4.3 Chile: National Electric Mobility Strategy
- 3.4.5 MEA
- 3.4.5.1 United Arab Emirates: National Sustainable Transport & Smart Mobility Policies
- 3.4.5.2 Saudi Arabia: Vision 2030 Public Transport Electrification Framework
- 3.4.5.3 South Africa:Green Transport Strategy
- 3.4.1 North America
- 3.5 Porter’s analysis
- 3.6 PESTEL analysis
- 3.7 Technology and Innovation landscape
- 3.7.1 Current technological trends
- 3.7.2 Emerging technologies
- 3.8 Patent analysis
- 3.9 Sustainability and environmental impact analysis
- 3.9.1 Sustainable practices
- 3.9.2 Waste reduction strategies
- 3.9.3 Energy efficiency in production
- 3.9.4 Eco-friendly initiatives
- 3.9.5 Carbon footprint considerations
- 3.10 Cost breakdown analysis
- 3.11 Sustainability and environmental impact analysis
- 3.11.1 Sustainable practices
- 3.11.2 Waste reduction strategies
- 3.11.3 Energy efficiency in production
- 3.11.4 Eco-friendly initiatives
- 3.11.5 Carbon footprint considerations
- 3.12 Charging Infrastructure & Grid Readiness Assessment
- 3.13 Fleet Transition & Deployment Models
- 3.14 Future outlook & opportunities
Chapter 4 Competitive Landscape, 2025
- 4.1 Introduction
- 4.2 Company market share analysis
- 4.2.1 North America
- 4.2.2 Europe
- 4.2.3 Asia Pacific
- 4.2.4 Latin America
- 4.2.5 MEA
- 4.3 Competitive analysis of major market players
- 4.4 Competitive positioning matrix
- 4.5 Key developments
- 4.5.1 Mergers & acquisitions
- 4.5.2 Partnerships & collaborations
- 4.5.3 New Product Launches
- 4.5.4 Expansion Plans and funding
Chapter 5 Market Estimates & Forecast, By Battery Chemistry, 2022 - 2035 ($Bn, Units)
- 5.1 Key trends
- 5.2 LFP
- 5.3 NCM/NMC
- 5.4 NCA
- 5.5 Others
Chapter 6 Market Estimates & Forecast, By Battery Capacity, 2022 - 2035 ($Bn, Units)
- 6.1 Key trends
- 6.2 Below 100 kWh
- 6.3 100-300 kWh
- 6.4 Above 300 kWh
Chapter 7 Market Estimates & Forecast, By Bus Length, 2022 - 2035 ($Bn, Units)
- 7.1 Key trends
- 7.2 Less than 9 meters
- 7.3 9-14 meters
- 7.4 More than 14 meters
Chapter 8 Market Estimates & Forecast, By Seating Capacity, 2022 - 2035 ($Bn, Units)
- 8.1 Key trends
- 8.2 Below 40 Seats
- 8.3 40-70 Seats
- 8.4 Above 70 Seats
Chapter 9 Market Estimates & Forecast, By Application, 2022 - 2035 ($Bn, Units)
- 9.1 Key trends
- 9.2 Transit & City Buses
- 9.3 School Buses
- 9.4 Coaches
- 9.5 Other
Chapter 10 Market Estimates & Forecast, By End Use, 2022 - 2035 ($Bn, Units)
- 10.1 Key trends
- 10.2 Government & Public Sector
- 10.3 Private Operators
Chapter 11 Market Estimates & Forecast, By Region, 2022 - 2035 ($Bn, Units)
- 11.1 Key trends
- 11.2 North America
- 11.2.1 US
- 11.2.2 Canada
- 11.3 Europe
- 11.3.1 Germany
- 11.3.2 UK
- 11.3.3 France
- 11.3.4 Italy
- 11.3.5 Spain
- 11.3.6 Russia
- 11.3.7 Belgium
- 11.3.8 Netherlands
- 11.3.9 Sweden
- 11.4 Asia Pacific
- 11.4.1 China
- 11.4.2 India
- 11.4.3 Japan
- 11.4.4 Australia
- 11.4.5 South Korea
- 11.4.6 Philippines
- 11.4.7 Indonesia
- 11.4.8 Singapore
- 11.5 Latin America
- 11.5.1 Brazil
- 11.5.2 Mexico
- 11.5.3 Argentina
- 11.6 MEA
- 11.6.1 South Africa
- 11.6.2 Saudi Arabia
- 11.6.3 UAE
Chapter 12 Company Profiles
- 12.1 Global Players
- 12.1.1 Alexander Dennis (ADL)
- 12.1.2 BYD Company
- 12.1.3 Daimler Truck (Mercedes-Benz Buses)
- 12.1.4 Higer Bus Company
- 12.1.5 King Long United Automotive Industry
- 12.1.6 MAN Truck & Bus
- 12.1.7 NFI (New Flyer)
- 12.1.8 Scania
- 12.1.9 VDL Bus & Coach
- 12.1.10 Volvo
- 12.1.11 Yutong
- 12.1.12 Zhongtong Bus
- 12.2 Regional Players
- 12.2.1 Ashok Leyland
- 12.2.2 Blue Bird
- 12.2.3 Ebusco
- 12.2.4 Gillig
- 12.2.5 Irizar e-mobility
- 12.2.6 Lion Electric Company
- 12.2.7 Solaris Bus & Coach
- 12.2.8 Tata Motors
- 12.2.9 Temsa
- 12.3 Emerging Players
- 12.3.1 Ankai Automobile
- 12.3.2 Arrival
- 12.3.3 CRRC Electric Vehicle
- 12.3.4 Foton Motor
- 12.3.5 GreenPower Motor Company.
- 12.3.6 JBM Auto
- 12.3.7 Phoenix Motor
- 12.3.8 Switch Mobility
- 12.3.9 Wrightbus
