
|
시장보고서
상품코드
1982268
P2L(Power to Liquid) 물류 시장 기회, 성장 촉진요인, 업계 동향 분석 및 예측(2026-2035년)Power-to-Liquids Logistics Market Opportunity, Growth Drivers, Industry Trend Analysis, and Forecast 2026 - 2035 |
||||||
세계의 P2L(Power to Liquid) 물류 시장은 2025년에 4,610만 달러로 평가되었으며, CAGR 8.2%로 성장하여 2035년까지 9,870만 달러에 달할 것으로 추정됩니다.

항공, 해운 등 전기화가 어려운 운송 분야의 탈탄소화를 위한 전 세계적인 노력이 가속화됨에 따라 시장 성장세는 더욱 탄력을 받고 있습니다. 이 시장은 재생 가능 전력 및 회수된 탄소로부터 합성된 연료를 관리하기 위한 전문 인프라에 대한 수요 증가를 반영하고 있습니다. 이러한 상승 추세는 기후변화 대응을 위한 규제, 진화하는 지속가능성 목표, 그리고 합성연료의 상업화 진전에 힘입은 바 큽니다. 생산기지는 일반적으로 재생에너지 집적지나 탄소 회수 시설 근처에 위치하기 때문에 최종사용자에게 안전한 공급을 보장하기 위해서는 효율적인 저장, 취급 및 운송 시스템이 필수적입니다. 그 결과, 이해관계자들은 P2L(전력-액체연료) 물류 요구사항에 맞춰 터미널 업그레이드, 첨단 운송 네트워크, 디지털 모니터링 플랫폼에 대한 투자를 진행하고 있습니다. 지원적인 정책 프레임워크가 인프라 개발을 계속 형성하는 한편, 혁신은 공급망 전반의 운영 신뢰성, 추적성, 안전 표준을 향상시키고 있습니다.
| 시장 범위 | |
|---|---|
| 시작 연도 | 2025년 |
| 예측 기간 | 2026-2035 |
| 개시시 시장 규모 | 4,610만 달러 |
| 예측액 | 9,870만 달러 |
| CAGR | 8.2% |
P2L(Power to Liquid) 물류 시장은 탄소 배출량 감축을 위한 규제 조치로 인해 큰 수혜를 받고 있습니다. 정책적 인센티브와 컴플라이언스 프레임워크는 저장 및 유통 시스템 전반에 걸친 인프라 업그레이드와 민간 투자를 촉진하고 있습니다. 기술의 발전은 물류의 성능을 변화시키고 있으며, 현대화된 파이프라인이 합성연료를 사용할 수 있도록 개조되고, 새롭게 설계된 철도 차량, 선박, 유조선 시스템이 도입되고 있습니다. 에너지 생산자, 물류 사업자, 기술 기업이 협력하여 통합 유통 모델을 구축함으로써 업계 간 협력이 발전을 가속화하고 있습니다. 기업들은 업무의 효율성을 높이기 위해 디지털 추적 플랫폼, 자동화 도구 및 첨단 안전 시스템을 도입하고 있습니다. 공동 이니셔티브는 전문 블렌딩 시설의 건설, 강화된 저장 시설의 정비, 생산 공장과 멀티모달 운송 회랑의 원활한 연결을 지원하고 있습니다.
P2L(Power to Liquid) 물류 시장에서 합성 디젤 부문은 2025년 40%의 점유율을 차지하며 1,820만 달러의 시장 규모를 창출할 것으로 예상됩니다. 이러한 선도적 지위는 해운 및 운송 분야에서의 강력한 채택에 힘입은 바 있습니다. 합성 디젤은 기존 디젤 인프라와 호환성이 있어 저장 터미널이나 연료 유통 시스템을 대대적으로 개조하지 않고도 기존 도로, 철도, 해상 네트워크를 통해 운송할 수 있습니다. 이러한 운영상의 유연성은 비용 효율성을 높이고 시장 보급을 가속화할 수 있습니다.
운송 서비스 부문은 2025년 62.7%의 점유율을 차지했으며, 2035년에는 6,030만 달러에 달할 것으로 예측됩니다. 생산시설이 소비지로부터 지리적으로 멀리 떨어져 있는 경우가 많기 때문에 운송은 여전히 P2L 물류 시장에서 가장 중요한 요소로 작용하고 있습니다. 합성연료 공장은 일반적으로 재생에너지 자원이나 탄소 회수 지역 근처에 위치하지만, 산업 클러스터, 항만, 공항 등 주요 수요 거점은 다른 곳에 위치합니다. 수요와 공급 사이의 물리적 격차로 인해 조정된 복합운송 네트워크에 대한 의존도가 높아지면서 물류는 전체 프로젝트 비용과 시장 성장에 크게 기여하는 요소로 부상하고 있습니다.
미국의 P2L(Power to Liquid) 물류 시장은 2025년 860만 달러에 달할 것으로 예상됩니다. 미국은 상업적 규모의 합성연료 생산의 전략적 요충지로 부상하고 있으며, 이는 물류 확대에 직접적인 영향을 미치고 있습니다. 연방 및 주정부 차원의 지속가능성 정책은 증가하는 연료량을 처리하기 위해 설계된 전용 저장 시설, 철도 연결, 해상 수출 능력 및 도로 운송 솔루션에 대한 자본 배분을 촉진하고 있습니다. 국내 생산능력이 확대됨에 따라 지역 간 통로 전체에서 통합되고 규정을 준수하는 물류 시스템에 대한 요구가 계속 증가하고 있습니다.
자주 묻는 질문
목차
제1장 조사 방법
제2장 주요 요약
제3장 업계 인사이트
제4장 경쟁 구도
제5장 시장 추정 및 예측 : 연료별, 2022-2035
제6장 시장 추정 및 예측 : 물류 서비스별, 2022-2035
제7장 시장 추정 및 예측 : 최종 용도별, 2022-2035
제8장 시장 추정 및 예측 : 지역별, 2022-2035
제9장 기업 개요
KSM 26.04.10The Global Power-to-Liquids Logistics Market was valued at USD 46.1 million in 2025 and is estimated to grow at a CAGR of 8.2% to reach USD 98.7 million by 2035.
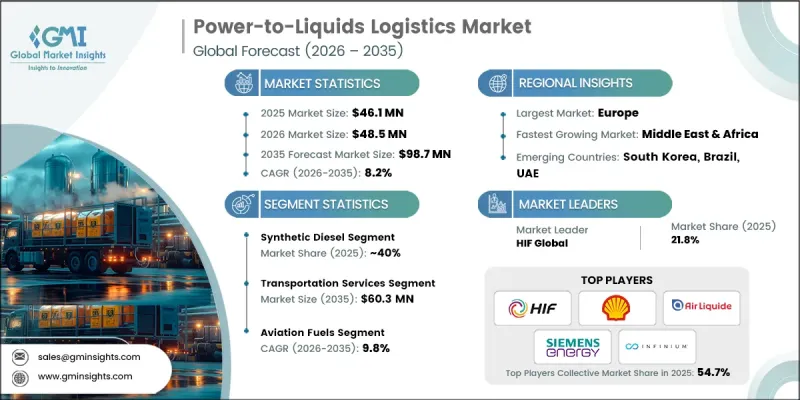
Market growth is gaining momentum as global industries accelerate efforts to decarbonize hard-to-electrify transportation segments such as aviation and maritime shipping. The market reflects the growing need for specialized infrastructure to manage fuels synthesized from renewable electricity and captured carbon. This upward trajectory is fueled by climate-driven regulations, evolving sustainability targets, and the increasing commercialization of synthetic fuels. Because production sites are typically located near renewable energy hubs or carbon capture facilities, efficient storage, handling, and transportation systems are crucial to ensure safe delivery to end-users. As a result, stakeholders are channeling investments into upgraded terminals, advanced transport networks, and digital monitoring platforms tailored to power-to-liquids logistics requirements. Supportive policy frameworks continue to shape infrastructure development, while innovation is improving operational reliability, traceability, and safety standards across the supply chain.
| Market Scope | |
|---|---|
| Start Year | 2025 |
| Forecast Year | 2026-2035 |
| Start Value | $46.1 Million |
| Forecast Value | $98.7 Million |
| CAGR | 8.2% |
The power-to-liquids logistics market is benefiting significantly from regulatory mandates designed to lower carbon emissions. Policy incentives and compliance frameworks are encouraging infrastructure upgrades and private investment across storage and distribution systems. Technological progress is also transforming logistics performance, with modernized pipelines being adapted to accommodate synthetic fuels and newly engineered railcars, marine vessels, and tanker systems entering service. Industry collaboration is accelerating development, as energy producers, logistics providers, and technology companies work together to create integrated distribution models. Companies are deploying digital tracking platforms, automation tools, and advanced safety systems to streamline operations. Joint initiatives are supporting the construction of specialized blending facilities, reinforced storage installations, and seamless connectivity between production plants and multimodal transport corridors.
Within the power-to-liquids logistics market, the synthetic diesel segment accounted for 40% of the share in 2025, generating USD 18.2 million. Its leadership position is driven by strong adoption across marine and transportation applications. Synthetic diesel offers compatibility with conventional diesel infrastructure, allowing it to move through established road, rail, and maritime networks without requiring extensive modifications to storage terminals or fuel distribution systems. This operational flexibility enhances cost efficiency and accelerates market uptake.
The transportation services segment held 62.7% share in 2025 and is forecast to reach USD 60.3 million by 2035. Transportation remains the most critical component of the power-to-liquids logistics market because production facilities are often geographically distant from consumption centers. Synthetic fuel plants are typically positioned near renewable energy resources and carbon capture zones, while major demand hubs, including industrial clusters, ports, and airports, are located elsewhere. The physical separation between supply and demand increases reliance on coordinated, multimodal transport networks, making logistics a substantial contributor to overall project costs and market growth.
U.S. Power-to-Liquids Logistics Market reached USD 8.6 million in 2025. The United States is emerging as a strategic center for commercial-scale synthetic fuel production, which directly stimulates logistics expansion. Federal and state-level sustainability policies are encouraging capital allocation toward specialized storage, rail connectivity, marine export capacity, and road transport solutions designed to handle growing fuel volumes. As domestic production capacity scales, the need for integrated and compliant logistics systems continues to strengthen across regional corridors.
Key participants operating in the Global Power-to-Liquids Logistics Market include Air Liquide, BP, HIF Global, INERATEC, Infinium, Nordic Electrofuel, Shell, Siemens Energy, Sunfire, and Twelve. Companies competing in the Power-to-Liquids Logistics Market are strengthening their foothold through strategic partnerships, infrastructure investments, and technology integration. Many players are forming alliances with renewable energy producers, carbon capture developers, and transportation operators to secure long-term supply and distribution agreements. Firms are also investing in upgraded storage terminals, specialized tanker fleets, and adaptable pipeline systems to improve operational flexibility. Digitalization remains a central strategy, with companies deploying real-time tracking systems, predictive maintenance tools, and data-driven optimization platforms to enhance efficiency and safety.
Table of Contents
Chapter 1 Methodology
- 1.1 Research approach
- 1.2 Quality commitments
- 1.2.1 GMI AI policy & data integrity commitment
- 1.3 Research trail & confidence scoring
- 1.3.1 Research trail components
- 1.3.2 Scoring components
- 1.4 Data collection
- 1.4.1 Partial list of primary sources
- 1.5 Data mining sources
- 1.5.1 Paid sources
- 1.6 Base estimates and calculations
- 1.6.1 Base year calculation
- 1.7 Forecast model
- 1.8 Research transparency addendum
Chapter 2 Executive Summary
- 2.1 Industry 360° synopsis, 2022 - 2035
- 2.2 Key market trends
- 2.2.1 Regional
- 2.2.2 Fuel
- 2.2.3 Logistics Service
- 2.2.4 End-Use
- 2.3 TAM analysis, 2026-2035
- 2.4 CXO perspectives: Strategic imperatives
Chapter 3 Industry Insights
- 3.1 Industry ecosystem analysis
- 3.1.1 Supplier landscape
- 3.1.2 Profit margin
- 3.1.3 Cost structure
- 3.1.4 Value addition at each stage
- 3.1.5 Factor affecting the value chain
- 3.1.6 Disruptions
- 3.2 Industry impact forces
- 3.2.1 Growth drivers
- 3.2.1.1 Rising sustainable aviation fuel (SAF) mandates
- 3.2.1.2 Stringent global decarbonization and net-zero targets
- 3.2.1.3 Government incentives and carbon pricing mechanisms
- 3.2.1.4 Development of cross-border green fuel trade corridors
- 3.2.2 Industry pitfalls and challenges
- 3.2.2.1 Limited dedicated storage and transport facilities
- 3.2.2.2 Dependence on renewable power availability
- 3.2.3 Market opportunities
- 3.2.3.1 Development of dedicated e-fuel export terminals
- 3.2.3.2 Public-private partnerships for sustainable fuel corridors
- 3.2.3.3 Expansion into emerging renewable-rich regions
- 3.2.1 Growth drivers
- 3.3 Growth potential analysis
- 3.4 Regulatory landscape
- 3.4.1 North America
- 3.4.1.1 U.S. Environmental Protection Agency (EPA)
- 3.4.1.2 Federal Energy Regulatory Commission (FERC)
- 3.4.1.3 National Renewable Energy Laboratory (NREL)
- 3.4.1.4 Canada Energy Regulator (CER)
- 3.4.2 Europe
- 3.4.2.1 Renewable Fuels Regulators Club (REFUREC)
- 3.4.2.2 European Commission - DG ENERGY
- 3.4.2.3 Council of European Energy Regulators (CEER)
- 3.4.2.4 European Union Aviation Safety Agency (EASA)
- 3.4.3 Asia Pacific
- 3.4.3.1 ASEAN Energy Regulators’ Network (AERN)
- 3.4.3.2 Energy Regulatory Commission (Thailand)
- 3.4.3.3 National Energy Administration (China)
- 3.4.3.4 Australian Renewable Energy Agency (ARENA)
- 3.4.4 Latin America
- 3.4.4.1 National Agency of Petroleum, Natural Gas and Biofuels (ANP)
- 3.4.4.2 Comision Reguladora de Energia (CRE)
- 3.4.4.3 National Energy Policy Council (CNPE)
- 3.4.5 Middle East & Africa
- 3.4.5.1 RAERESA
- 3.4.5.2 National Energy Regulator of South Africa (NERSA)
- 3.4.5.3 Gulf Cooperation Council Interconnection Authority (GCCIA)
- 3.4.1 North America
- 3.5 Porter's analysis
- 3.6 PESTEL analysis
- 3.7 Technology and innovation landscape
- 3.7.1 Current technological trends
- 3.7.1.1 Electrolyzer efficiency improvements
- 3.7.1.2 Fischer Tropsch synthesis optimization
- 3.7.1.3 Renewable hydrogen integration into fuel synthesis
- 3.7.2 Emerging technologies
- 3.7.2.1 Direct air capture (DAC) integration with PtL systems
- 3.7.2.2 Solid oxide electrolysis (SOEC) at commercial scale
- 3.7.1 Current technological trends
- 3.8 Production statistics
- 3.8.1 Production hubs
- 3.8.2 Consumption hubs
- 3.8.3 Export and import
- 3.9 Price trends
- 3.9.1 By region
- 3.9.2 By fuel
- 3.10 Cost breakdown analysis
- 3.11 Sustainability and environmental impact
- 3.11.1 Environmental impact assessment
- 3.11.2 Social impact & community benefits
- 3.11.3 Governance & corporate responsibility
- 3.11.4 Sustainable finance & investment trends
- 3.12 Infrastructure Readiness & Capacity Analysis
- 3.12.1 Global PtL production facility mapping
- 3.12.2 Logistics infrastructure gaps by region
- 3.12.3 Terminal and blending facility availability
- 3.12.4 Pipeline and transportation network adequacy
- 3.12.5 Future infrastructure investment requirements
- 3.13 Logistics Risk Assessment & Mitigation
- 3.13.1 Storage stability and degradation risks
- 3.13.2 Transportation safety protocols
- 3.13.3 Supply chain disruption scenarios
- 3.13.4 Contingency planning and alternative routing
- 3.14 Case studies
- 3.15 Future outlook & opportunities
Chapter 4 Competitive Landscape, 2025
- 4.1 Introduction
- 4.2 Company market share analysis
- 4.2.1 North America
- 4.2.2 Europe
- 4.2.3 Asia Pacific
- 4.2.4 LATAM
- 4.2.5 MEA
- 4.3 Competitive analysis of major market players
- 4.4 Competitive positioning matrix
- 4.5 Key developments
- 4.5.1 Mergers & acquisitions
- 4.5.2 Partnerships & collaborations
- 4.5.3 New product launches
- 4.5.4 Expansion plans and funding
Chapter 5 Market Estimates & Forecast, By Fuel, 2022 - 2035 ($Mn)
- 5.1 Key trends
- 5.2 Synthetic Aviation Fuel (SAF)
- 5.3 Synthetic diesel
- 5.4 E-methanol
- 5.5 Others
Chapter 6 Market Estimates & Forecast, By Logistics Service, 2022 - 2035 ($Mn)
- 6.1 Key trends
- 6.2 Transportation services
- 6.2.1 Rail
- 6.2.2 Road
- 6.2.3 Sea
- 6.2.4 Pipeline
- 6.3 Storage services
- 6.4 Others
Chapter 7 Market Estimates & Forecast, By End Use, 2022 - 2035 ($Mn)
- 7.1 Key trends
- 7.2 Aviation fuels
- 7.3 Marine fuels
- 7.4 Road transport fuels
Chapter 8 Market Estimates & Forecast, By Region, 2022 - 2035 ($Mn)
- 8.1 Key trends
- 8.2 North America
- 8.2.1 US
- 8.2.2 Canada
- 8.3 Europe
- 8.3.1 Germany
- 8.3.2 UK
- 8.3.3 France
- 8.3.4 Italy
- 8.3.5 Spain
- 8.3.6 Belgium
- 8.3.7 Russia
- 8.3.8 Netherlands
- 8.4 Asia Pacific
- 8.4.1 China
- 8.4.2 India
- 8.4.3 Japan
- 8.4.4 South Korea
- 8.4.5 Australia
- 8.4.6 Singapore
- 8.4.7 Malaysia
- 8.4.8 Indonesia
- 8.4.9 Vietnam
- 8.4.10 Thailand
- 8.5 Latin America
- 8.5.1 Brazil
- 8.5.2 Mexico
- 8.5.3 Argentina
- 8.5.4 Colombia
- 8.6 MEA
- 8.6.1 South Africa
- 8.6.2 Saudi Arabia
- 8.6.3 UAE
Chapter 9 Company Profiles
- 9.1 Global players
- 9.1.1 HIF Global
- 9.1.2 Infinium
- 9.1.3 Siemens Energy
- 9.1.4 Sunfire
- 9.1.5 Shell
- 9.1.6 Air Liquide
- 9.1.7 BP
- 9.2 Regional players
- 9.2.1 Nordic Electrofuel
- 9.2.2 P2X Solutions
- 9.2.3 Repsol
- 9.2.4 Twelve
- 9.2.5 INERATEC
- 9.2.6 Linde
- 9.3 Logistics players
- 9.3.1 Kuehne + Nagel
- 9.3.2 DHL
- 9.3.3 Hoyer
- 9.4 Emerging players
- 9.4.1 Synhelion
- 9.4.2 Aemetis
- 9.4.3 Carbon Engineering
- 9.4.4 Dimensional Energy

