
|
시장보고서
상품코드
1982301
안전 밸브 시장의 기회, 성장 요인, 업계 동향 분석 및 예측(2026-2035년)Safety Valves Market Opportunity, Growth Drivers, Industry Trend Analysis, and Forecast 2026 - 2035 |
||||||
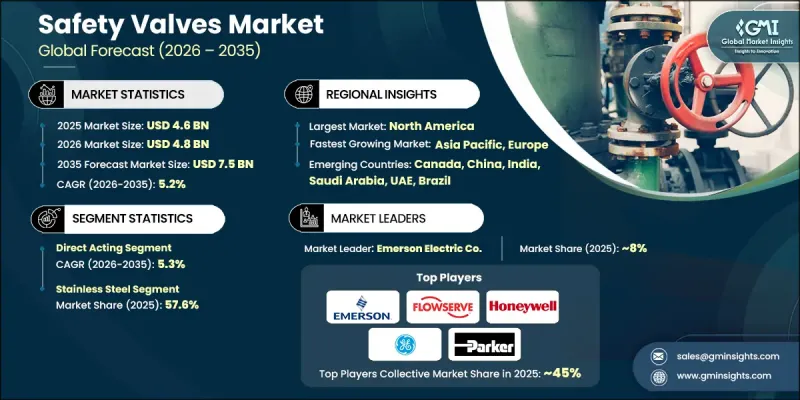
세계의 안전 밸브 시장은 2025년 46억 달러로 평가되었고 CAGR은 5.2%를 나타낼 것으로 보이며, 2035년까지 75억 달러에 이를 것으로 추정됩니다.

최근 몇 년간 안전 규제의 강화, 산업 인프라의 현대화, 주요 산업 분야의 고압 처리 시스템 도입 증가에 힘입어 시장 성장은 꾸준한 추세를 유지해 왔습니다. 산업 운영이 더욱 복잡해지고 규제 체계가 강화됨에 따라 기업들은 신뢰할 수 있는 과압 방지 시스템에 더욱 중점을 두고 있습니다. 안전 밸브는 압력 관련 고장을 방지함으로써 장비, 인원 및 생산 연속성을 보호하는 필수 컴포넌트로서의 역할을 계속하고 있습니다. 플랜트 업그레이드에 대한 투자 증가, 노후화된 산업 자산의 확장, 운영 신뢰성에 대한 관심 증대는 세계적인 수요를 뒷받침하고 있습니다. 파일럿 작동 시스템, 고압 직접 작동 모델, 벨로우즈 밀봉 설계 등 첨단 구성 방식이 진화하는 공정 요구 사항을 충족하기 위해 더욱 널리 채택되고 있습니다. 그러나 기술적으로 진보된 밸브 시스템의 통합은 자본 집약성과 대규모 시설 요구 사항으로 인해 여전히 과제로 남아 있습니다. 이러한 제약에도 불구하고 지속적인 산업화와 규정 준수를 위한 조달 전략은 안전 밸브 시장의 장기적인 성장을 계속해서 주도하고 있습니다.
| 시장 범위 | |
|---|---|
| 시작 연도 | 2025년 |
| 예측 기간 | 2026-2035년 |
| 시작 시장 규모 | 46억 달러 |
| 예측 금액 | 75억 달러 |
| CAGR | 5.2% |
직동식 밸브 부문은 2025년에 21억 달러의 매출을 기록했으며, 2026년부터 2035년까지 연평균 성장률(CAGR) 5.3%로 성장할 것으로 예상됩니다. 이 부문은 단순한 설계, 신뢰할 수 있는 성능, 그리고 저압에서 중압 시스템에 걸친 적용성으로 인해 시장을 주도하고 있습니다. 일반 산업 공정에 폭넓게 적용 가능하다는 점은 유지보수 및 교체 주기에서 꾸준한 수요를 뒷받침합니다. 운영자들이 표준화된 압력 보호 체계 및 규제 준수 요건에 점점 더 부합해감에 따라, 직접 작동 밸브는 비용 효율적이고 신뢰할 수 있는 안전 관리를 위한 선호되는 솔루션으로 남아 있습니다.
스테인레스 스틸 부문은 57.6%의 점유율을 차지했으며 2025년에는 26억 달러 시장 규모를 기록했습니다. 스테인리스 스틸 안전 밸브는 내식성, 구조적 강도, 고온 및 고압 조건의 작동 능력으로 인해 널리 선택되고 있습니다. 가혹한 작동 환경의 내구성은 엄격한 규정 준수 및 운영 탄력성이 요구되는 산업 분야에서 이 밸브를 필수적인 요소로 만듭니다. 까다로운 공정 시스템의 설치 확대는 세계적으로 스테인리스강 밸브의 채택을 지속적으로 가속화하고 있습니다.
미국의 안전 밸브 시장은 2025년에 9억 4,240만 달러에 이르고, 2026년부터 2035년에 걸쳐 CAGR 5.4%를 나타낼 것으로 예측됩니다. 지역별 수요는 지속적인 자산 교체 프로그램, 시설 업그레이드 및 정기 유지보수 주기에 힘입어 뒷받침되고 있습니다. 추적성, 인증 및 엄격한 안전 기준 준수에 대한 강조가 커짐에 따라 구매자들은 내식성 재료와 신뢰할 수 있는 OEM(주문자 상표 부착 생산) 업체를 우선적으로 선택하고 있습니다. 규제 준수 및 운영 효율성에 대한 관심은 산업 전반에 걸쳐 꾸준한 구매 물량을 지속시키는 요인으로 작용하고 있습니다.
자주 묻는 질문
목차
제1장 조사 방법과 범위
제2장 주요 요약
제3장 업계 인사이트
- 생태계 분석
- 공급자의 상황
- 이익률
- 각 단계의 부가가치
- 밸류체인에 영향을 주는 요인
- 업계에 미치는 영향요인
- 성장 촉진요인
- 첨단 안전 밸브 시스템의 비용 상승
- 다양한 안전 밸브 기술 및 용도별 시스템의 가용성 증가
- 산업 운영자의 재정적 부담 경감에 대한 필요성 증가
- 업계의 잠재적 위험 및 과제
- 산업의 근대화 및 설비 갱신에 대한 정부 보조금
- 표준화된 규제나 공정 안전의 틀 부족
- 업계의 기회
- 디지털 및 정밀 기반 안전 기술의 채택 증가
- 디지털 플랫폼 및 주문형 산업 안전 서비스 확대
- 성장 촉진요인
- 성장 가능성 분석
- 장래 시장 동향
- 기술 및 혁신 동향
- 현재의 기술 동향
- 신흥 기술
- 가격 동향
- 지역별
- 제품 유형별
- 규제 상황
- 규격 및 규정 준수 요건
- 지역별 규제 프레임워크
- 인증기준
- Porter's Five Forces 분석
- PESTEL 분석
제4장 경쟁 구도
- 소개
- 기업의 시장 점유율 분석
- 지역별
- 북미
- 유럽
- 아시아태평양
- 라틴아메리카
- 중동 및 아프리카
- 지역별
- 기업 매트릭스 분석
- 주요 시장 기업의 경쟁 분석
- 경쟁 포지셔닝 매트릭스
- 주요 발전
- 합병 및 인수
- 제휴 및 협업
- 신제품 발매
- 사업 확대 계획
제5장 안전 밸브 시장 추계 및 예측 : 유형별(2022-2035년)
- 직동식
- 벨로우즈
- 파일럿 작동식
제6장 안전밸브 시장 추계 및 예측 : 재료별(2022-2035년)
- 스테인레스 스틸
- 탄소강
- 황동
- 플라스틱
- 기타(인코넬 등)
제7장 안전 밸브 시장 추계 및 예측 : 크기별(2022-2035년)
- 1인치 이하
- 1-6인치
- 6-25인치
- 25-50인치
- 50인치 이상
제8장 안전 밸브 시장 추계 및 예측 : 압력 범위별(2022-2035년)
- 35MPa 미만
- 35-70MPa
- 70-110MPa
- 400MPa
- 700MPa
- 20kpsi
- 60kpsi
제9장 안전 밸브 시장 추계 및 예측 : 최종 사용자별(2022-2035년)
- 석유 및 가스
- 상하수도처리
- 전력업계
- 화학산업
- 기타
제10장 안전 밸브 시장 추계 및 예측 : 유통 채널별(2022-2035년)
- 직접 판매
- 간접 판매
제11장 안전 밸브 시장 추계 및 예측 : 지역별(2022-2035년)
- 북미
- 미국
- 캐나다
- 유럽
- 독일
- 영국
- 프랑스
- 이탈리아
- 스페인
- 아시아태평양
- 중국
- 인도
- 일본
- 한국
- 호주
- 라틴아메리카
- 브라질
- 멕시코
- 중동 및 아프리카(MEA)
- 사우디아라비아
- 아랍에미리트(UAE)
제12장 기업 프로파일
- Burkert Fluid Control Systems
- Cameron
- Crane Co.
- Emerson Electric Co.
- Flowserve Corporation
- GE Measurement &Control Solutions
- Honeywell International Inc.
- Moog Inc.
- Parker Hannifin Corporation
- Pentair plc
- Rotork Plc
- Schneider Electric SE
- Spirax Sarco Limited
- ValvTechnologies, Inc.
- Watts Water Technologies, Inc.
The Global Safety Valves Market was valued at USD 4.6 billion in 2025 and is estimated to grow at a CAGR of 5.2% to reach USD 7.5 billion by 2035.
Market growth has remained steady in recent years, supported by stricter safety mandates, modernization of industrial infrastructure, and rising deployment of high-pressure processing systems across critical industries. As industrial operations become more complex and regulatory frameworks tighten, companies are placing stronger emphasis on reliable overpressure protection systems. Safety valves continue to serve as essential components that safeguard equipment, personnel, and production continuity by preventing pressure-related failures. Growing investment in plant upgrades, expansion of aging industrial assets, and heightened focus on operational reliability are reinforcing global demand. Advanced configurations, including pilot-operated systems, high-pressure direct-acting models, and bellows-sealed designs, are gaining wider adoption to meet evolving process requirements. However, integrating technologically advanced valve systems remains a challenge due to capital intensity and large-scale facility requirements. Despite these constraints, sustained industrialization and compliance-driven procurement strategies continue to drive long-term growth in the safety valves market.
| Market Scope | |
|---|---|
| Start Year | 2025 |
| Forecast Year | 2026-2035 |
| Start Value | $4.6 Billion |
| Forecast Value | $7.5 Billion |
| CAGR | 5.2% |
The direct-acting valves segment generated USD 2.1 billion in 2025 and is anticipated to grow at a CAGR of 5.3% from 2026 to 2035. This category leads the market due to its straightforward engineering, dependable performance, and adaptability across low- to mid-pressure systems. Its broad suitability for general industrial processes supports consistent demand in maintenance and replacement cycles. As operators increasingly align with standardized pressure protection frameworks and regulatory compliance requirements, direct-acting valves remain the preferred solution for cost-efficient and reliable safety management.
The stainless steel segment held 57.6% share, generating USD 2.6 billion in 2025. Stainless steel safety valves are widely selected for their corrosion resistance, structural strength, and ability to perform under high-temperature and high-pressure conditions. Their durability in harsh operating environments makes them indispensable in industries requiring stringent compliance and operational resilience. Expanding installation of demanding processing systems continues to accelerate the adoption of stainless steel valves worldwide.
U.S. Safety Valves Market reached USD 942.4 million in 2025 and is projected to grow at a CAGR of 5.4% between 2026 and 2035. Regional demand is supported by ongoing asset replacement programs, facility upgrades, and routine maintenance cycles. Increasing emphasis on traceability, certification, and adherence to strict safety standards is encouraging buyers to prioritize corrosion-resistant materials and trusted original equipment manufacturers. The focus on regulatory compliance and operational efficiency continues to sustain steady procurement volumes across industrial sectors.
Key participants in the Global Safety Valves Market include Emerson Electric Co., Flowserve Corporation, Crane Co., Parker Hannifin Corporation, Honeywell International Inc., Schneider Electric SE, Pentair plc, Rotork Plc, Spirax Sarco Limited, Watts Water Technologies, Inc., Moog Inc., ValvTechnologies, Inc., Burkert Fluid Control Systems, Cameron, and GE Measurement & Control Solutions. Companies in the Global Safety Valves Market are reinforcing their competitive position through product innovation, certification expansion, and strategic partnerships. Manufacturers are investing in advanced materials, digital monitoring integration, and enhanced pressure-control technologies to improve reliability and lifecycle performance. Expanding global distribution networks and strengthening aftermarket services help companies secure recurring revenue through maintenance and replacement contracts. Strategic collaborations with engineering firms and industrial operators enable customized valve solutions for complex applications. Firms are also prioritizing compliance with international safety standards and obtaining third-party certifications to build trust and credibility.
Table of Contents
Chapter 1 Methodology & Scope
- 1.1 Market scope and definition
- 1.2 Research design
- 1.2.1 Research approach
- 1.2.2 Data collection methods
- 1.3 Data mining sources
- 1.3.1 Global
- 1.3.2 Regional/Country
- 1.4 Base estimates and calculations
- 1.4.1 Base year calculation
- 1.4.2 Key trends for market estimation
- 1.5 Primary research and validation
- 1.5.1 Primary sources
- 1.6 Forecast model
- 1.7 Research assumptions and limitations
Chapter 2 Executive Summary
- 2.1 Industry 360° synopsis
- 2.2 Key market trends
- 2.2.1 Regional
- 2.2.2 Type
- 2.2.3 Material
- 2.2.4 Size
- 2.2.5 Pressure Range
- 2.2.6 End User
- 2.2.7 Distribution Channel
Chapter 3 Industry Insights
- 3.1 Industry ecosystem analysis
- 3.1.1 Supplier landscape
- 3.1.2 Profit margin
- 3.1.3 Value addition at each stage
- 3.1.4 Factor affecting the value chain
- 3.2 Industry impact forces
- 3.2.1 Growth drivers
- 3.2.1.1 Rising cost of advanced safety valve systems
- 3.2.1.2 Growing availability of diverse safety valve technologies and application specific systems
- 3.2.1.3 Increasing need to reduce financial burden on industrial operators
- 3.2.2 Industry pitfalls & challenges
- 3.2.2.1 Government subsidies for industrial modernization and equipment upgrades
- 3.2.2.2 Lack of standardized regulations and process-safety frameworks.
- 3.2.3 Industry Opportunities
- 3.2.3.1 Increasing adoption of digital and precision based safety technologies
- 3.2.3.2 Expansion of digital platforms and on demand industrial safety services
- 3.2.1 Growth drivers
- 3.3 Growth potential analysis
- 3.4 Future market trends
- 3.5 Technology and innovation landscape
- 3.5.1 Current technological trends
- 3.5.2 Emerging technologies
- 3.6 Price trends
- 3.6.1 By region
- 3.6.2 By Product type
- 3.7 Regulatory landscape
- 3.7.1 Standards and compliance requirements
- 3.7.2 Regional regulatory frameworks
- 3.7.3 Certification standards
- 3.8 Porter’s analysis
- 3.9 PESTEL analysis
Chapter 4 Competitive Landscape, 2025
- 4.1 Introduction
- 4.2 Company market share analysis
- 4.2.1 By Region
- 4.2.1.1 North America
- 4.2.1.2 Europe
- 4.2.1.3 Asia Pacific
- 4.2.1.4 Latin America
- 4.2.1.5 Middle East & Africa
- 4.2.1 By Region
- 4.3 Company matrix analysis
- 4.4 Competitive analysis of major market players
- 4.5 Competitive positioning matrix
- 4.6 Key developments
- 4.6.1 Mergers & acquisitions
- 4.6.2 Partnerships & collaborations
- 4.6.3 New product launches
- 4.6.4 Expansion plans
Chapter 5 Safety Valves Market Estimates & Forecast, By Type, 2022 - 2035, (USD Billion) (Thousand Units)
- 5.1 Key trends
- 5.2 Direct acting
- 5.3 Bellows
- 5.4 Pilot-operated
Chapter 6 Safety Valves Market Estimates & Forecast, By Material, 2022 - 2035, (USD Billion) (Thousand Units)
- 6.1 Key trends
- 6.2 Stainless Steel
- 6.3 Carbon Steel
- 6.4 Brass
- 6.5 Plastic
- 6.6 Others (Inconel, etc.)
Chapter 7 Safety Valves Market Estimates & Forecast, By Size, 2022 - 2035, (USD Billion) (Thousand Units)
- 7.1 Key trends
- 7.2 Up to 1"
- 7.3 1" to 6"
- 7.4 6" to 25"
- 7.5 25" to 50"
- 7.6 50" and Larger
Chapter 8 Safety Valves Market Estimates & Forecast, By Pressure Range, 2022 - 2035, (USD Billion) (Thousand Units)
- 8.1 Key trends
- 8.2 < 35MPa
- 8.3 35 - 70 MPa
- 8.4 70 - 110 MPa
- 8.5 400 MPa
- 8.6 700 MPa
- 8.7 20 kpsi
- 8.8 60 kpsi
Chapter 9 Safety Valves Market Estimates & Forecast, By End Users, 2022 - 2035, (USD Billion) (Thousand Units)
- 9.1 Key trends
- 9.2 Oil & Gas
- 9.3 Water & Wastewater Treatment
- 9.4 Power Industry
- 9.5 Chemical Industry
- 9.6 Others
Chapter 10 Safety Valves Market Estimates & Forecast, By Distribution Channel, 2022 - 2035, (USD Billion) (Thousand Units)
- 10.1 Key trends
- 10.2 Direct Sales
- 10.3 Indirect Sales
Chapter 11 Safety Valves Market Estimates & Forecast, By Region, 2022 - 2035, (USD Billion) (Thousand Units)
- 11.1 Key trends
- 11.2 North America
- 11.2.1 U.S.
- 11.2.2 Canada
- 11.3 Europe
- 11.3.1 Germany
- 11.3.2 UK
- 11.3.3 France
- 11.3.4 Italy
- 11.3.5 Spain
- 11.4 Asia Pacific
- 11.4.1 China
- 11.4.2 India
- 11.4.3 Japan
- 11.4.4 South Korea
- 11.4.5 Australia
- 11.5 Latin America
- 11.5.1 Brazil
- 11.5.2 Mexico
- 11.6 MEA
- 11.6.1 Saudi Arabia
- 11.6.2 UAE
Chapter 12 Company Profiles
- 12.1 Burkert Fluid Control Systems
- 12.2 Cameron
- 12.3 Crane Co.
- 12.4 Emerson Electric Co.
- 12.5 Flowserve Corporation
- 12.6 GE Measurement & Control Solutions
- 12.7 Honeywell International Inc.
- 12.8 Moog Inc.
- 12.9 Parker Hannifin Corporation
- 12.10 Pentair plc
- 12.11 Rotork Plc
- 12.12 Schneider Electric SE
- 12.13 Spirax Sarco Limited
- 12.14 ValvTechnologies, Inc.
- 12.15 Watts Water Technologies, Inc.
