
|
시장보고서
상품코드
1982363
바지선 운송 시장 기회, 성장 기회, 산업 동향 분석 및 예측(2026-2035년)Barge Transportation Market Opportunity, Growth Drivers, Industry Trend Analysis, and Forecast 2026 - 2035 |
||||||
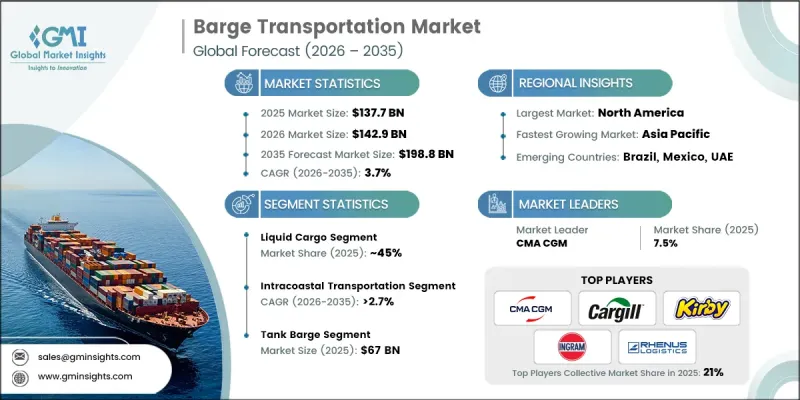
세계의 바지선 운송 시장은 2025년 1,377억 달러로 평가되었으며 CAGR 3.7%로 성장해 2035년까지 1,988억 달러에 이를 것으로 추정됩니다.

세계 무역량이 증가하고 효율적이고 안전하며 환경적으로 지속 가능한 화물 운송에 대한 요구가 증가함에 따라 내륙 수로 운송 수요가 증가하고 시장이 확대되고 있습니다. 북미, 유럽, 아시아태평양의 낮은 배출 운송을 촉진하는 규제 인센티브, 지속가능성에 대한 의무 및 정부 정책을 통해 플릿 소유자, 물류 사업자 및 바지선 운항 사업자는 고급 플릿 관리, 예지 보전 및 운항 최적화 솔루션의 도입을 촉진하고 있습니다. 선박의 가동률을 극대화하고, 연료 효율을 개선하고, 엄격한 안전 및 환경 기준을 충족하는 압력에 의해 엔진 진단, 선체 유지 보수, 보조 시스템의 점검, 자동 항행 및 배출 가스 제어 기술에 대한 투자가 촉진되고 있습니다. 플릿의 현대화, 내륙 수송 회랑 확대, 컨테이너 화물 및 벌크 화물용 바지의 도입은 고효율로 데이터 구동형 솔루션의 보급을 더욱 뒷받침하고 있는 한편, IoT를 활용한 모니터링, 텔레매틱스, 통합 퍼포먼스 플랫폼이 기존의 바지 운항을 변화시키고 있습니다.
| 시장 범위 | |
|---|---|
| 시작 연도 | 2025년 |
| 예측 기간 | 2026-2035년 |
| 시작 금액 | 1,377억 달러 |
| 예측 금액 | 1,988억 달러 |
| CAGR | 3.7% |
액체 화물 부문은 45%의 점유율을 차지하며 2035년까지 연평균 복합 성장률(CAGR) 2.9%를 나타낼 것으로 예측됩니다. 석유, 화학제품 및 기타 벌크 액체를 내륙 수로 및 해안 바지선 항로로 수송하는 것은 세계 무역, 에너지 공급 및 산업 활동에 여전히 매우 중요하기 때문에 액체 화물이 시장을 독점하고 있습니다. 높은 상업적 가치, 안정적인 수요 및 엄격한 규제 취급 요건으로 인해 해운 회사와 물류 사업자는 일관되게 바지선 플릿을 활용하고 있습니다.
해안 내수로 운송 부문은 2025년에 60%의 점유율을 차지했으며, 2035년까지 연평균 복합 성장률(CAGR) 2.7%를 나타낼 것으로 예측됩니다. 해안 내수로는 항만, 산업 거점 및 상업 중심지 간의 대량화물 운송을 지원하며 벌크 액체, 석유 제품, 화학제품 및 컨테이너 화물을 처리합니다. 운항사는 이러한 회랑의 신뢰성이 높고 효율적이고 규제에 따른 운송을 보장하기 위해 선박운항, 안전 프로토콜 및 화물 취급의 표준화를 진행하고 있습니다.
미국 바지선 운송 시장은 83%의 점유율을 차지했으며, 2025년에는 383억 달러 시장 규모를 창출했습니다. 이 지역은 성숙한 내륙 수로망, 광범위한 선박 운영 및 고급 항만 인프라의 혜택을 누리고 있습니다. 정비된 하천시스템, 플릿 관리 도입, 예지보전 기술로 안전하고 고용량의 바지선 운송에서 북미의 리더십을 강화하고 있습니다.
자주 묻는 질문
목차
제1장 조사 방법과 범위
제2장 주요 요약
제3장 업계 인사이트
- 생태계 분석
- 공급자의 상황
- 이익률
- 비용 구조
- 각 단계에서의 부가가치
- 밸류체인에 영향을 주는 요인
- 혁신
- 업계에 미치는 영향요인
- 성장 촉진요인
- 내륙 수로 운송에 대한 수요 증가
- 차량의 현대화와 디지털화
- 지속가능한 운송에 대한 규제면의 지원
- 무역회랑 확대
- 업계의 잠재적 위험 및 과제
- 높은 운용 및 유지관리 비용
- 인프라의 제약
- 시장 기회
- 그린 및 하이브리드 추진 기술
- 예지보전 및 AI를 활용한 차량 관리
- 복합 일관 수송 및 컨테이너 수송
- 첨단 예지보전 서비스
- 성장 촉진요인
- 성장 가능성 분석
- 규제 상황
- 북미
- 미국 : EPA, 미국 해안 경비대, 수질 정화법, NTSB
- 캐나다 : 캐나다 교통부, CMVSS 305
- 유럽
- 독일 : BMDV, 유로 6/7
- 프랑스 : 교통부, 유로 6/7
- 영국 : 교통부, 유로 6/7
- 이탈리아 : 인프라 및 운수부
- 아시아태평양
- 중국 : MIIT, 중국 6/7 기준
- 일본 : 국토교통성, JIS 배출가스 규제
- 한국 : 국토교통부(MOLIT), 한국(KS) 배출기준
- 인도 : MoRTH, BS6 기준
- 라틴아메리카
- 브라질 : DENATRAN, CONAMA의 기준
- 멕시코 : 통신 운수성, NOM 배출 가스 규제
- 중동 및 아프리카
- UAE : RTA, ESMA 배출규제
- 사우디아라비아 : 교통부, SASO 배출 기준
- 북미
- Porter's Five Forces 분석
- PESTEL 분석
- 기술 및 혁신의 동향
- 현재의 기술 동향
- 신흥기술
- 가격 동향
- 지역별
- 제품별
- 비용 내역 분석
- 특허 분석
- 지속가능성과 환경면
- 지속가능한 대처
- 폐기물 감축 전략
- 생산의 에너지 효율
- 친환경 이니셔티브
- 탄소발자국에 관한 고찰
- 이용 사례 시나리오
- 내륙 수로의 인프라 및 운송 능력 평가
- 인터모달 접속성과 모달 시프트의 동향
- 차량의 연령 구성 및 갱신 사이클 분석
제4장 경쟁 구도
- 소개
- 기업의 시장 점유율 분석
- 북미
- 유럽
- 아시아태평양
- 라틴아메리카
- 중동 및 아프리카
- 주요 시장 기업의 경쟁 분석
- 경쟁 포지셔닝 매트릭스
- 전략적 전망 매트릭스
- 주요 발전
- 합병 및 인수
- 제휴 및 협업
- 신제품 발매
- 사업 확대 계획과 자금 조달
제5장 시장 추계 및 예측 : 화물별(2022-2035년)
- 액체 화물
- 기체 화물
- 건화물
제6장 시장 추계 및 예측 : 바지선 플릿별(2022-2035년)
- 커버 바지선
- 오픈 바지선
- 탱크 바지선
제7장 시장 추계 및 예측 : 바지선 운송 활동별(2022-2035년)
- 연안 내 운송
- 내륙 수로 운송
제8장 시장 추계 및 예측 : 규모별(2022-2035년)
- 140-180피트
- 195-250피트
- 260-300피트
- 300피트 이상
제9장 시장 추계 및 예측 : 용도별(2022-2035년)
- 석탄
- 원유 및 석유 제품
- 액체화학제품
- 식품 펄프 및 기타 액체
- 농산물
- 금속 광석 및 금속 가공제품
- 의약품
- 건조 및 기체 화학제품
- LPG, CNG 및 기타 가스 제품
- 전자기기 및 디지털 기기
- 기타
제10장 시장 추계 및 예측 : 지역별(2022-2035년)
- 북미
- 미국
- 캐나다
- 유럽
- 영국
- 독일
- 프랑스
- 이탈리아
- 스페인
- 벨기에
- 네덜란드
- 스웨덴
- 아시아태평양
- 중국
- 인도
- 일본
- 호주
- 싱가포르
- 한국
- 베트남
- 인도네시아
- 라틴아메리카
- 브라질
- 멕시코
- 아르헨티나
- 중동 및 아프리카(MEA)
- 아랍에미리트(UAE)
- 남아프리카
- 사우디아라비아
제11장 기업 프로파일
- 글로벌 기업
- American Commercial Barge Line
- Cargill Marine & Terminal
- CMA CGM
- Contargo
- Ingram Barge
- Kirby
- Marquette Transportation
- McAllister Towing &Transportation
- Rhenus
- SEACOR
- 지역 기업
- HGK Shipping
- Danser
- Argosy International
- Blessey Marine Services
- Ergon
- Haeger and Schmidt Logistics
- Heartland Barge Management
- Livingston International
- Maritime
- Waalhaven
The Global Barge Transportation Market was valued at USD 137.7 billion in 2025 and is estimated to grow at a CAGR of 3.7% to reach USD 198.8 billion by 2035.
The market is expanding as demand for inland waterway transport rises alongside global trade volumes and the need for efficient, safe, and environmentally sustainable cargo movement. Regulatory incentives promoting low-emission transport, sustainability mandates, and government policies in North America, Europe, and Asia Pacific are encouraging fleet owners, logistics providers, and barge operators to adopt advanced fleet management, predictive maintenance, and operational optimization solutions. Pressure to maximize vessel uptime, improve fuel efficiency, and meet strict safety and environmental standards is driving investment in engine diagnostics, hull maintenance, auxiliary system checks, automated navigation, and emission control technologies. Fleet modernization, expansion of inland shipping corridors, and adoption of containerized and bulk cargo barges further support the uptake of high-efficiency, data-driven solutions, while IoT-enabled monitoring, telematics, and integrated performance platforms are transforming traditional barge operations.
| Market Scope | |
|---|---|
| Start Year | 2025 |
| Forecast Year | 2026-2035 |
| Start Value | $137.7 Billion |
| Forecast Value | $198.8 Billion |
| CAGR | 3.7% |
The liquid cargo segment held a 45% share and is expected to grow at a CAGR of 2.9% through 2035. Liquid cargo dominates because transporting petroleum, chemicals, and other bulk liquids via inland waterways and coastal barge routes remains critical for global trade, energy supply, and industrial activities. The high commercial value, steady demand, and strict regulatory handling requirements ensure that barge fleets are consistently utilized by shipping companies and logistics providers.
The intracoastal transportation segment accounted for 60% share in 2025 and is projected to grow at a CAGR of 2.7% through 2035. Intracoastal routes support high-volume cargo movement between ports, industrial hubs, and commercial centers, handling bulk liquids, petroleum products, chemicals, and containerized goods. Operators are standardizing vessel operations, safety protocols, and cargo handling to ensure reliable, efficient, and compliant transport along these corridors.
US Barge Transportation Market held an 83% share, generating USD 38.3 billion in 2025. The region benefits from a mature inland waterway network, extensive fleet operations, and advanced port infrastructure. Well-developed river systems, fleet management adoption, and predictive maintenance technologies strengthen North America's leadership in safe, high-capacity barge transportation.
Key players operating in the Global Barge Transportation Market include Kirby Corporation, Cargill Marine & Terminal, American Commercial Barge Line, Marquette Transportation, McAllister Towing & Transportation, CMA CGM Group, Contargo, SEACOR, Rhenus Group, and Ingram Barge Company. Companies in the barge transportation market are employing multiple strategies to enhance their presence and strengthen their market foothold. Operators are investing in fleet modernization and adopting predictive maintenance solutions to maximize uptime and minimize operational costs. Integration of IoT, telematics, and automated navigation systems improves fuel efficiency, route optimization, and cargo monitoring. Strategic partnerships with logistics providers, port authorities, and industrial clients help expand route coverage and operational reach. Firms are focusing on specialized vessels for liquid and bulk cargo, compliance with safety and environmental regulations, and sustainability initiatives to gain a competitive edge.
Table of Contents
Chapter 1 Methodology & Scope
- 1.1 Market scope and definition
- 1.2 Research design
- 1.2.1 Research approach
- 1.2.2 Data collection methods
- 1.3 Data mining sources
- 1.3.1 Global
- 1.3.2 Regional/Country
- 1.4 Base estimates and calculations
- 1.4.1 Base year calculation
- 1.4.2 Key trends for market estimation
- 1.5 Primary research and validation
- 1.5.1 Primary sources
- 1.6 Forecast
- 1.7 Research assumptions and limitations
Chapter 2 Executive Summary
- 2.1 Industry 360° synopsis, 2022 - 2035
- 2.2 Key market trends
- 2.2.1 Regional
- 2.2.2 Cargo
- 2.2.3 Barge Fleet
- 2.2.4 Barging Activity
- 2.2.5 Size
- 2.2.6 Application
- 2.3 TAM Analysis, 2026-2035
- 2.4 CXO perspectives: Strategic imperatives
- 2.4.1 Executive decision points
- 2.4.2 Critical success factors
- 2.5 Future outlook and strategic recommendations
Chapter 3 Industry Insights
- 3.1 Industry ecosystem analysis
- 3.1.1 Supplier Landscape
- 3.1.2 Profit Margin
- 3.1.3 Cost structure
- 3.1.4 Value addition at each stage
- 3.1.5 Factor affecting the value chain
- 3.1.6 Disruptions
- 3.2 Industry impact forces
- 3.2.1 Growth drivers
- 3.2.1.1 Rising demand for inland waterway transport
- 3.2.1.2 Fleet modernization and digitalization
- 3.2.1.3 Regulatory support for sustainable transport
- 3.2.1.4 Expansion of trade corridors
- 3.2.2 Industry pitfalls and challenges
- 3.2.2.1 High operational and maintenance costs
- 3.2.2.2 Infrastructure limitations
- 3.2.3 Market opportunities
- 3.2.3.1 Green and hybrid propulsion technologies
- 3.2.3.2 Predictive maintenance and AI-driven fleet management
- 3.2.3.3 Intermodal & containerized transport
- 3.2.3.4 Advanced predictive maintenance services
- 3.2.1 Growth drivers
- 3.3 Growth potential analysis
- 3.4 Regulatory landscape
- 3.4.1 North America
- 3.4.1.1 U.S.: EPA, U.S. Coast Guard, Clean Water Act, NTSB
- 3.4.1.2 Canada: Transport Canada, CMVSS 305
- 3.4.2 Europe
- 3.4.2.1 Germany: BMDV, Euro 6/7
- 3.4.2.2 France: Ministry of Transport, Euro 6/7
- 3.4.2.3 UK: Department for Transport, Euro 6/7
- 3.4.2.4 Italy: Ministry of Infrastructure & Transport
- 3.4.3 Asia Pacific
- 3.4.3.1 China: MIIT, China 6/7 Standards
- 3.4.3.2 Japan: MLIT, JIS Emission Regulations
- 3.4.3.3 South Korea: MOLIT, KS Emission Standards
- 3.4.3.4 India: MoRTH, BS6 Norms
- 3.4.4 Latin America
- 3.4.4.1 Brazil: DENATRAN, CONAMA Standards
- 3.4.4.2 Mexico: Ministry of Communications & Transport, NOM Emission Regulations
- 3.4.5 Middle East and Africa
- 3.4.5.1 UAE: RTA, ESMA Emission Regulations
- 3.4.5.2 Saudi Arabia: Ministry of Transport, SASO Emission Standards
- 3.4.1 North America
- 3.5 Porter’s analysis
- 3.6 PESTEL analysis
- 3.7 Technology and Innovation Landscape
- 3.7.1 Current technological trends
- 3.7.2 Emerging technologies
- 3.8 Price trends
- 3.8.1 By region
- 3.8.2 By product
- 3.9 Cost breakdown analysis
- 3.10 Patent analysis
- 3.11 Sustainability and Environmental Aspects
- 3.11.1 Sustainable practices
- 3.11.2 Waste reduction strategies
- 3.11.3 Energy efficiency in production
- 3.11.4 Eco-friendly initiatives
- 3.11.5 Carbon footprint considerations
- 3.12 Use case scenarios
- 3.13 Inland Waterway Infrastructure & Capacity Assessment
- 3.14 Intermodal Connectivity & Modal Shift Dynamics
- 3.15 Fleet Age Profile & Replacement Cycle Analysis
Chapter 4 Competitive Landscape, 2025
- 4.1 Introduction
- 4.2 Company market share analysis
- 4.2.1 North America
- 4.2.2 Europe
- 4.2.3 Asia Pacific
- 4.2.4 Latin America
- 4.2.5 Middle East & Africa
- 4.3 Competitive analysis of major market players
- 4.4 Competitive positioning matrix
- 4.5 Strategic outlook matrix
- 4.6 Key developments
- 4.6.1 Mergers & acquisitions
- 4.6.2 Partnerships & collaborations
- 4.6.3 New product launches
- 4.6.4 Expansion plans and funding
Chapter 5 Market Estimates & Forecast, By Cargo, 2022 - 2035 ($Bn, Million tons)
- 5.1 Key trends
- 5.2 Liquid Cargo
- 5.3 Gaseous Cargo
- 5.4 Dry Cargo
Chapter 6 Market Estimates & Forecast, By Barge Fleet, 2022 - 2035 ($Bn, Million tons)
- 6.1 Key trends
- 6.2 Covered Barge
- 6.3 Opened Barge
- 6.4 Tank Barge
Chapter 7 Market Estimates & Forecast, By Barging Activity, 2022 - 2035 ($Bn, Million tons)
- 7.1 Key trends
- 7.2 Intracoastal Transportation
- 7.3 Inland Water Transport
Chapter 8 Market Estimates & Forecast, By Size, 2022 - 2035 ($Bn, Million tons)
- 8.1 Key trends
- 8.2 140ft to 180ft
- 8.3 195ft to 250ft
- 8.4 260ft to 300ft
- 8.5 300ft and above
Chapter 9 Market Estimates & Forecast, By Application , 2022 - 2035 ($Bn, Million tons)
- 9.1 Key trends
- 9.2 Coal
- 9.3 Crude & Petroleum Products
- 9.4 Liquid Chemicals
- 9.5 Food Pulp & Other Liquid
- 9.6 Agricultural Products
- 9.7 Metal Ores and Fabricated Metal Products
- 9.8 Pharmaceuticals
- 9.9 Dry & Gaseous Chemicals
- 9.10 LPG, CNG, and Other Gaseous Products
- 9.11 Electronics & Digital Equipment
- 9.12 Others
Chapter 10 Market Estimates & Forecast, By Region, 2022 - 2035 ($Bn, Million tons)
- 10.1 Key trends
- 10.2 North America
- 10.2.1 US
- 10.2.2 Canada
- 10.3 Europe
- 10.3.1 UK
- 10.3.2 Germany
- 10.3.3 France
- 10.3.4 Italy
- 10.3.5 Spain
- 10.3.6 Belgium
- 10.3.7 Netherlands
- 10.3.8 Sweden
- 10.4 Asia Pacific
- 10.4.1 China
- 10.4.2 India
- 10.4.3 Japan
- 10.4.4 Australia
- 10.4.5 Singapore
- 10.4.6 South Korea
- 10.4.7 Vietnam
- 10.4.8 Indonesia
- 10.5 Latin America
- 10.5.1 Brazil
- 10.5.2 Mexico
- 10.5.3 Argentina
- 10.6 MEA
- 10.6.1 UAE
- 10.6.2 South Africa
- 10.6.3 Saudi Arabia
Chapter 11 Company Profiles
- 11.1 Global Player
- 11.1.1 American Commercial Barge Line
- 11.1.2 Cargill Marine & Terminal
- 11.1.3 CMA CGM
- 11.1.4 Contargo
- 11.1.5 Ingram Barge
- 11.1.6 Kirby
- 11.1.7 Marquette Transportation
- 11.1.8 McAllister Towing & Transportation
- 11.1.9 Rhenus
- 11.1.10 SEACOR
- 11.2 Regional Player
- 11.2.1 HGK Shipping
- 11.2.2 Danser
- 11.2.3 Argosy International
- 11.2.4 Blessey Marine Services
- 11.2.5 Ergon
- 11.2.6 Haeger and Schmidt Logistics
- 11.2.7 Heartland Barge Management
- 11.2.8 Livingston International
- 11.2.9 Maritime
- 11.2.10 Waalhaven
