
|
시장보고서
상품코드
1998688
전기차 충전 케이블 시장 기회, 성장요인, 업계 동향 분석 및 예측(2026-2035년)Electric Vehicle Charging Cable Market Opportunity, Growth Drivers, Industry Trend Analysis, and Forecast 2026 - 2035 |
||||||
세계의 전기차 충전 케이블 시장은 2025년에 19억 달러로 평가되었고, CAGR 10.6%로 성장하여 2035년까지 51억 달러에 달할 것으로 예측됩니다.
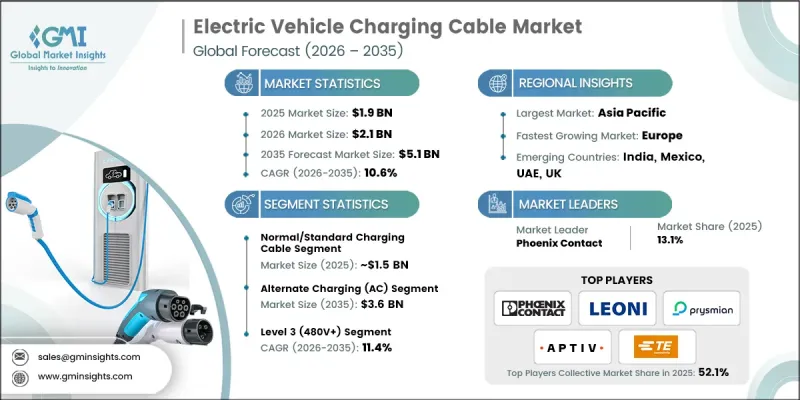
세계적으로 전기자동차 보급이 확대됨에 따라 안정적이고 효율적인 충전 인프라에 대한 수요가 꾸준히 증가하고 있으며, 충전 케이블은 전기차 충전 설비(EVSE) 생태계에서 필수적인 구성 요소로 자리 잡고 있습니다. 이 케이블은 충전소와 차량을 연결하여 안전하고 효율적인 에너지 전송을 가능하게 합니다. 정부의 인센티브, 강화된 배출가스 규제, 전기차 인프라에 대한 투자가 시장 성장을 뒷받침하고 있으며, 고출력 커넥터, 다중 차종 지원, 급속 충전 솔루션의 기술 발전은 이러한 케이블의 보급을 더욱 촉진하고 있습니다. 공공 및 민간 충전 네트워크가 빠르게 확장되고 있는 가운데, 각 제조업체들은 전 세계적으로 증가하는 전기차에 대응하기 위해 확장성, 내구성, 범용성을 갖춘 충전 솔루션 생산에 주력하고 있습니다.
| 시장 범위 | |
|---|---|
| 개시 연도 | 2025년 |
| 예측 기간 | 2026-2035년 |
| 개시 연도 시장 규모 | 19억 달러 |
| 예측액 | 51억 달러 |
| CAGR | 10.6% |
일반 또는 표준 충전 케이블 부문은 80.7%의 점유율을 차지했으며, 2025년에는 15억 달러 시장 규모를 형성할 것으로 예측됩니다. 대부분의 충전은 가정과 직장에서 이루어지며, 주로 AC 충전 인프라에 의존하고 있습니다. 표준 케이블은 널리 보급된 AC 월박스 및 공공 AC 충전기와 완벽하게 호환되기 때문에 신차 구매 및 애프터마켓 구매 시 기본 선택이 되고 있습니다. DC 급속 충전기에 비해 AC 충전기의 보급률이 높다는 점이 이 부문의 우위를 뒷받침하고 있습니다.
교류(AC) 충전 부문은 2025년 75.6%의 점유율을 차지했으며, 2035년까지 36억 달러에 달할 것으로 전망됩니다. AC 충전은 비용 효율성, 광범위한 인프라와의 호환성, 가정과 직장에서 사용하기에 적합하기 때문에 여전히 대다수의 전기차 소유자가 선호하는 충전 방식입니다. 많은 지역, 특히 신흥 시장에서는 AC 충전소의 수가 DC 급속 충전기보다 훨씬 많으며, 이는 이 부문의 지속적인 성장을 뒷받침하고 있습니다.
미국의 전기자동차 충전 케이블 시장은 2025년에 2억 4,400만 달러에 달했으며, 2026년부터 2035년까지 연평균 8.6%의 연평균 복합 성장률(CAGR)을 보일 것으로 예측됩니다. 국내 전기차 충전 네트워크의 확대, 지속가능성에 대한 노력, 그리고 전국적인 공공 충전 인프라 구축을 목표로 하는 NEVI 포뮬러 프로그램과 같은 연방 정부 프로그램이 케이블 수요를 주도하고 있습니다. 고속도로를 따라 DC 급속 충전소 설치가 증가하고 있는 것도 고출력 DC 케이블 수요를 더욱 증가시키고 있습니다.
자주 묻는 질문
목차
제1장 조사 방법
제2장 주요 요약
제3장 업계 인사이트
제4장 경쟁 구도
제5장 시장 추산 및 예측 : 케이블별, 2022-2035
제6장 시장 추산 및 예측 : 전력별, 2022-2035
제7장 시장 추산 및 예측 : 충전 레벨별, 2022-2035
제8장 시장 추산 및 예측 : 커넥터별, 2022-2035
제9장 시장 추산 및 예측 : 모드별, 2022-2035
제10장 시장 추산 및 예측 : 직경별, 2022-2035
제11장 시장 추산 및 예측 : 형태별, 2022-2035
제12장 시장 추산 및 예측 : 길이별, 2022-2035
제13장 시장 추산 및 예측 : 용도별, 2022-2035
제14장 시장 추산 및 예측 : 판매채널별, 2022-2035
제15장 시장 추산 및 예측 : 지역별, 2022-2035
제16장 기업 개요
LSH 26.04.23The Global Electric Vehicle Charging Cable Market was valued at USD 1.9 billion in 2025 and is estimated to grow at a CAGR of 10.6% to reach USD 5.1 billion by 2035.

The rising adoption of electric vehicles worldwide is driving strong demand for reliable and efficient charging infrastructure, with charging cables serving as a critical component of the EV supply equipment (EVSE) ecosystem. These cables link charging stations to vehicles, ensuring safe and efficient energy transfer. Government incentives, stricter emission regulations, and investments in EV infrastructure are supporting market growth, while technological advancements in high-power connectors, multi-vehicle compatibility, and faster charging solutions are further enhancing the adoption of these cables. With both public and private charging networks expanding rapidly, manufacturers are focusing on producing scalable, durable, and versatile charging solutions to accommodate the growing EV population globally.
| Market Scope | |
|---|---|
| Start Year | 2025 |
| Forecast Year | 2026-2035 |
| Start Value | $1.9 Billion |
| Forecast Value | $5.1 Billion |
| CAGR | 10.6% |
The normal or standard charging cable segment held 80.7% share, generating USD 1.5 billion in 2025. Most charging sessions occur at homes or workplaces, which primarily rely on AC charging infrastructure. Standard cables are fully compatible with widely deployed AC wall boxes and public AC chargers, making them the default choice for new EVs and aftermarket purchases. The broader availability of AC chargers compared to DC fast chargers drives the dominance of this segment.
The alternate current (AC) charging segment held 75.6% share in 2025 and is expected to reach USD 3.6 billion by 2035. AC charging remains the preferred choice for most EV owners due to cost-effectiveness, widespread infrastructure compatibility, and suitability for home and workplace use. In many regions, AC charging points significantly outnumber DC fast chargers, particularly in emerging markets, supporting the sustained growth of this segment.
U.S. Electric Vehicle Charging Cable Market reached USD 204.4 million in 2025 and is projected to grow at a CAGR of 8.6% between 2026 and 2035. Expansion of domestic EV charging networks, sustainability initiatives, and federal programs like the NEVI Formula Program, which aim to establish a nationwide public charging infrastructure, are driving cable demand. The increasing deployment of DC fast charging stations along highways is further boosting the requirement for high-power DC cables.
Key players operating in the Global Electric Vehicle Charging Cable Market include Phoenix Contact, TE Connectivity, Aptiv, Huber+Suhner, Sinbon Electronics, Prysmian, BRUGG, LEONI, Dyden, and Coroplast. Key strategies adopted by companies in the Electric Vehicle Charging Cable Market include developing high-performance connectors capable of supporting next-generation fast charging and grid integration. Manufacturers are investing in R&D to produce longer-lasting, weather-resistant, and multi-vehicle compatible cables. Strategic partnerships with EV manufacturers and charging station operators allow companies to expand distribution networks and enhance adoption. Emphasis on cost optimization, scalable production, and compliance with international safety standards helps firms maintain market leadership. Companies also focus on technological innovation, including smart monitoring and adaptive power management features, to differentiate their products in a rapidly evolving market.
Table of Contents
Chapter 1 Methodology
- 1.1 Research approach
- 1.2 Quality commitments
- 1.2.1 GMI AI policy & data integrity commitment
- 1.3 Research trail & confidence scoring
- 1.3.1 Research trail components
- 1.3.2 Scoring components
- 1.4 Data collection
- 1.4.1 Partial list of primary sources
- 1.5 Data mining sources
- 1.5.1 Paid sources
- 1.6 Base estimates and calculations
- 1.6.1 Base year calculation
- 1.7 Forecast model
- 1.8 Research transparency addendum
Chapter 2 Executive Summary
- 2.1 Industry 360° synopsis
- 2.2 Key market trends
- 2.2.1 Regional
- 2.2.2 Cable
- 2.2.3 Power Supply
- 2.2.4 Charging Level
- 2.2.5 Connector
- 2.2.6 Mode
- 2.2.7 Diameter
- 2.2.8 Shape
- 2.2.9 Length
- 2.2.10 Application
- 2.2.11 Sales Channel
- 2.3 TAM analysis, 2026-2035
- 2.4 CXO perspectives: Strategic imperatives
Chapter 3 Industry Insights
- 3.1 Industry ecosystem analysis
- 3.1.1 Supplier landscape
- 3.1.2 Profit margin
- 3.1.3 Cost structure
- 3.1.4 Value addition at each stage
- 3.1.5 Factor affecting the value chain
- 3.1.6 Disruptions
- 3.2 Industry impact forces
- 3.2.1 Growth drivers
- 3.2.1.1 Rapid global EV adoption & electrification mandates
- 3.2.1.2 Government incentives & charging infrastructure investments
- 3.2.1.3 Technological advancements in fast charging & liquid cooling
- 3.2.1.4 Growing consumer demand for convenient charging solutions
- 3.2.2 Industry pitfalls and challenges
- 3.2.2.1 Thermal management & heat dissipation challenges
- 3.2.2.2 Lack of universal connector standardization
- 3.2.3 Market opportunities
- 3.2.3.1 Expansion of ultra-fast charging networks (350kW+)
- 3.2.3.2 Emerging markets with low EV penetration rates
- 3.2.3.3 Development of lightweight & sustainable cable materials
- 3.2.1 Growth drivers
- 3.3 Growth potential analysis
- 3.4 Regulatory landscape
- 3.4.1 North America
- 3.4.1.1 National Electrical Code (NEC - NFPA 70)
- 3.4.1.2 UL Solutions
- 3.4.1.3 CSA Group
- 3.4.1.4 SAE International
- 3.4.2 Europe
- 3.4.2.1 European Committee for Electrotechnical Standardization (CENELEC)
- 3.4.2.2 International Electrotechnical Commission (IEC)
- 3.4.2.3 TUV Rheinland
- 3.4.2.4 DIN
- 3.4.3 Asia Pacific
- 3.4.3.1 State Administration for Market Regulation (China)
- 3.4.3.2 Standardization Administration of China (SAC)
- 3.4.3.3 Bureau of Indian Standards (BIS)
- 3.4.3.4 Japanese Industrial Standards Committee (JISC)
- 3.4.4 Latin America
- 3.4.4.1 Instituto Nacional de Metrologia Qualidade e Tecnologia (INMETRO)
- 3.4.4.2 Asociacion de Normalizacion y Certificacion (ANCE)
- 3.4.4.3 Instituto Argentino de Normalizacion y Certificacion (IRAM)
- 3.4.5 Middle East & Africa
- 3.4.5.1 Saudi Standards Metrology and Quality Organization (SASO)
- 3.4.5.2 Emirates Authority for Standardization and Metrology (ESMA)
- 3.4.5.3 South African Bureau of Standards (SABS)
- 3.4.1 North America
- 3.5 Investment & Funding Analysis
- 3.6 Porter's analysis
- 3.7 PESTEL analysis
- 3.8 Technology and innovation landscape
- 3.8.1 Current technologies
- 3.8.1.1 AC charging cables (Mode 2 & Mode 3)
- 3.8.1.2 DC fast charging (50kW-250kW)
- 3.8.1.3 Smart charging & load management systems
- 3.8.1.4 Standardized connector technologies (CCS, CHAdeMO, GB/T)
- 3.8.2 Emerging technologies
- 3.8.2.1 Ultra-fast charging cables (350 kW+)
- 3.8.2.2 Lightweight and flexible cable materials
- 3.8.2.3 Liquid-cooled charging cables
- 3.8.1 Current technologies
- 3.9 Pricing analysis (Driven by Primary Research)
- 3.9.1 Historical Price Trend Analysis
- 3.9.2 Pricing Strategy by Player Type (Premium / Value / Cost-plus)
- 3.10 Patent landscape (Driven by Primary Research)
- 3.11 Trade Data Analysis (Driven by Paid Database)
- 3.11.1 Import/Export Volume & Value Trends
- 3.11.2 Key Trade Corridors & Tariff Impact
- 3.12 Capacity & Production Landscape (Driven by Primary Research)
- 3.12.1 Installed Capacity by Region & Key Producer
- 3.12.2 Capacity Utilization Rates & Expansion Pipelines
- 3.13 Impact of AI & Generative AI on the Market
- 3.13.1 AI-driven disruption of existing business models
- 3.13.2 GenAI use cases & adoption roadmap by segment
- 3.13.3 Risks, limitations & regulatory considerations
- 3.14 EV OEM strategy alignment
- 3.15 Replacement cycle analysis
- 3.15.1 Average lifecycle of EV charging cables
- 3.15.2 Influence of usage patterns & environmental factors
- 3.15.3 Replacement cost & economic considerations
- 3.15.4 Impact of technological upgrades on replacement cycles
- 3.16 Case studies
- 3.17 Forecast assumptions & scenario analysis (Driven by Primary Research)
- 3.17.1 Base Case - key macro & industry variables driving CAGR
- 3.17.2 Optimistic Scenarios - Favorable macro and industry tailwinds
- 3.17.3 Pessimistic Scenario - Macroeconomic slowdown or industry headwinds
Chapter 4 Competitive Landscape, 2025
- 4.1 Introduction
- 4.2 Company market share analysis
- 4.2.1 North America
- 4.2.2 Europe
- 4.2.3 Asia Pacific
- 4.2.4 LATAM
- 4.2.5 MEA
- 4.3 Competitive analysis of major market players
- 4.4 Competitive positioning matrix
- 4.5 Key developments
- 4.5.1 Mergers & acquisitions
- 4.5.2 Partnerships & collaborations
- 4.5.3 New product launches
- 4.5.4 Expansion plans and funding
- 4.6 Company tier benchmarking
- 4.6.1 Tier classification criteria & qualifying thresholds
- 4.6.2 Tier positioning matrix by revenue, geography & innovation
Chapter 5 Market Estimates & Forecast, By Cable, 2022 - 2035 ($Mn, Thousand Units)
- 5.1 Key trends
- 5.2 Normal/Standard Charging Cable
- 5.3 High-Power Charging (HPC) Cable
- 5.3.1 Standard/Uncooled High-Power Charging (HPC) Cable
- 5.3.2 Liquid-Cooled High-Power Charging Cable
Chapter 6 Market Estimates & Forecast, By Power Supply, 2022 - 2035 ($Mn, Thousand Units)
- 6.1 Key trends
- 6.2 Alternate Charging (AC)
- 6.3 Direct Charging (DC)
Chapter 7 Market Estimates & Forecast, By Charging Level, 2022 - 2035 ($Mn, Thousand Units)
- 7.1 Key trends
- 7.2 Level 1 (120V)
- 7.3 Level 2 (240V)
- 7.4 Level 3 (480V+)
Chapter 8 Market Estimates & Forecast, By Connector, 2022 - 2035 ($Mn, Thousand Units)
- 8.1 Key trends
- 8.2 Type 1
- 8.3 Type 2
- 8.4 CCS 1
- 8.5 CCS 2
- 8.6 CHAdeMO
- 8.7 GB/T
- 8.8 NACS/Tesla
Chapter 9 Market Estimates & Forecast, By Mode, 2022 - 2035 ($Mn, Thousand Units)
- 9.1 Key trends
- 9.2 Mode 1 & 2
- 9.3 Mode 3
- 9.4 Mode 4
Chapter 10 Market Estimates & Forecast, By Diameter, 2022 - 2035 ($Mn, Thousand Units)
- 10.1 Key trends
- 10.2 10 mm
- 10.3 10-20 mm
- 10.4 Above 20 mm
Chapter 11 Market Estimates & Forecast, By Shape, 2022 - 2035 ($Mn, Thousand Units)
- 11.1 Key trends
- 11.2 Straight
- 11.3 Coiled
Chapter 12 Market Estimates & Forecast, By Length, 2022 - 2035 ($Mn, Thousand Units)
- 12.1 Key trends
- 12.2 Below 5 meters
- 12.3 5-10 meters
- 12.4 Above 10 meters
Chapter 13 Market Estimates & Forecast, By Application, 2022 - 2035 ($Mn, Thousand Units)
- 13.1 Key trends
- 13.2 Private Charging
- 13.3 Public Charging
- 13.3.1 Shopping malls
- 13.3.2 Airports
- 13.3.3 Highways
- 13.3.4 Commercial Parking
- 13.3.5 Others
Chapter 14 Market Estimates & Forecast, By Sales Channel, 2022 - 2035 ($Mn, Thousand Units)
- 14.1 Key trends
- 14.2 OEM
- 14.3 Aftermarket
Chapter 15 Market Estimates & Forecast, By Region, 2022 - 2035 ($Mn, Thousand Units)
- 15.1 Key trends
- 15.2 North America
- 15.2.1 US
- 15.2.2 Canada
- 15.3 Europe
- 15.3.1 Germany
- 15.3.2 UK
- 15.3.3 France
- 15.3.4 Italy
- 15.3.5 Spain
- 15.3.6 Belgium
- 15.3.7 Russia
- 15.3.8 Netherlands
- 15.4 Asia Pacific
- 15.4.1 China
- 15.4.2 India
- 15.4.3 Japan
- 15.4.4 South Korea
- 15.4.5 Australia
- 15.4.6 Singapore
- 15.4.7 Malaysia
- 15.4.8 Vietnam
- 15.4.9 Thailand
- 15.5 Latin America
- 15.5.1 Brazil
- 15.5.2 Mexico
- 15.5.3 Argentina
- 15.5.4 Colombia
- 15.6 MEA
- 15.6.1 South Africa
- 15.6.2 Saudi Arabia
- 15.6.3 UAE
Chapter 16 Company Profiles
- 16.1 Global players
- 16.1.1 Phoenix Contact
- 16.1.2 TE Connectivity
- 16.1.3 LEONI
- 16.1.4 Prysmian
- 16.1.5 Aptiv
- 16.1.6 Huber+Suhner
- 16.1.7 Dyden
- 16.1.8 Coroplast
- 16.1.9 BRUGG
- 16.1.10 Tesla
- 16.2 Regional players
- 16.2.1 Chengdu Khons
- 16.2.2 Sinbon Electronics
- 16.2.3 EV TEISON
- 16.2.4 Guchen Electronics
- 16.2.5 Manlon
- 16.2.6 Pod Point
- 16.3 Emerging players
- 16.3.1 Juice Technology
- 16.3.2 Webasto
- 16.3.3 Masterplug
- 16.3.4 Zencar
