
|
시장보고서
상품코드
1998747
첨단 교통 요금 시스템 시장 기회, 성장 촉진요인, 업계 동향 분석 및 예측(2026-2035년)Advanced Transportation Pricing System Market Opportunity, Growth Drivers, Industry Trend Analysis, and Forecast 2026 - 2035 |
||||||
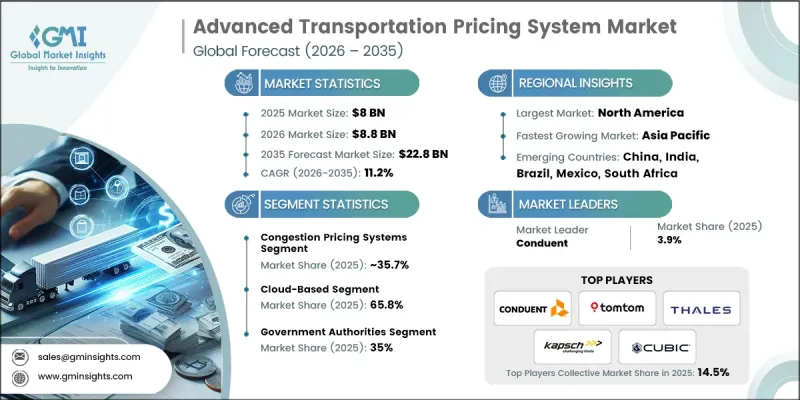
세계의 첨단 교통 요금 시스템 시장은 2025년에 80억 달러로 평가되었고, CAGR 11.2%로 성장하여 2035년까지 228억 달러에 이를 것으로 예측됩니다.

급속한 도시화, 자동차 보유 대수 증가, 주요 도시의 교통 혼잡이 심화되면서 첨단 요금 징수 솔루션에 대한 수요가 증가하고 있습니다. 정부와 민간 사업자들은 도로 이용의 효율적 관리, 교통 체증 완화 및 수익 창출을 위해 전자 요금 징수, 주행거리 모니터링 및 동적 가격 책정 모델을 도입하고 있습니다. 또한, 고속도로와 도시 도로망 모두에 적용 가능한 확장 가능한 기술 주도형 인프라에 대한 수요도 시장 성장을 견인하고 있습니다. 실시간 교통 모니터링, 데이터 분석 및 자동 요금 계산 엔진을 통해 당국은 이동성을 최적화하는 동시에 스마트 시티 구상을 지원할 수 있으며, 첨단 교통 요금 시스템은 현대 도시 계획에서 필수적인 도구가 되고 있습니다. 배리어 프리 및 프리 플로우 요금 징수로의 전환은 교통 요금 솔루션의 도입 방식을 변화시키고 있습니다. 완전 자동화된 다중 차선 요금 징수 시스템은 소프트웨어, 단속 솔루션 및 요금 책정 엔진에 대한 수요를 주도하고 있습니다. 차량 감지, 데이터 처리 및 결제 기술의 발전으로 이러한 시스템의 정확성과 효율성이 향상되고 있습니다. RFID, 자동 번호판 인식 및 차량 분류 기술의 개선으로 보다 정확한 요금 설정이 가능해졌고, 시스템 제공업체의 운영 비용도 절감할 수 있게 되었습니다.
| 시장 범위 | |
|---|---|
| 개시 연도 | 2025년 |
| 예측 연도 | 2026-2035년 |
| 개시 금액 | 80억 달러 |
| 예측액 | 228억 달러 |
| CAGR | 11.2% |
교통 체증 요금제 부문은 2025년 35.7%의 점유율을 차지했으며, 2035년까지 연평균 11.6%의 성장률을 보일 것으로 예측됩니다. 이러한 시스템은 교통 관리, 배출가스 감소, 대중교통 개선을 위한 자금 조달을 목적으로 도시 내 주요 도로와 도시 전역의 구역에서 도입이 진행되고 있습니다. 당국은 대기질 개선, 교통 흐름 최적화, 지속 가능한 수익 창출 등의 혜택을 누리고 있으며, 혼잡통행료 제도는 ATPS 솔루션의 중요한 전략적 부문으로 자리매김하고 있습니다.
클라우드 기반 도입 부문은 2025년 65.8%의 점유율을 차지했으며며, 2026년부터 2035년까지 연평균 11.4%의 성장률을 보일 것으로 전망됩니다. 클라우드 솔루션은 운영 비용을 절감하고, 시스템 실시간 업데이트가 가능하며, 확장성이 높은 인프라를 제공하기 때문에 교통 당국은 기존 On-Premise형 시스템보다 효율적으로 요금 징수 및 혼잡통행료 제도를 관리할 수 있습니다.
미국의 교통 요금 시스템 시장은 2025년 23억 달러에 달했습니다. 미국 시장 확대는 연방, 주, 지방 정부의 이니셔티브와 더불어 전자 요금 징수, 혼잡 통행료, 주행거리 모니터링 등을 도입하는 민간 사업자의 활동에 의해 주도되고 있습니다. 전기자동차 보급에 따른 연료세 수입 감소로 인해 대체 고속도로 자금 조달 솔루션의 필요성이 대두되고 있으며, 도심 교통 체증 증가로 인해 혁신적인 교통 관리 및 전용 교통 프로젝트 자금에 대한 수요가 증가하고 있습니다.
자주 묻는 질문
목차
제1장 조사 방법
제2장 주요 요약
제3장 업계 인사이트
제4장 경쟁 구도
제5장 시장 추산 및 예측 : 솔루션별, 2022년-2035년
제6장 시장 추산 및 예측 : 컴포넌트별, 2022년-2035년
제7장 시장 추산 및 예측 : 전개 형태별, 2022년-2035년
제8장 시장 추산 및 예측 : 용도별, 2022년-2035년
제9장 시장 추산 및 예측 : 최종 용도별, 2022년-2035년
제10장 시장 추산 및 예측 : 지역별, 2022년-2035년
제11장 기업 개요
LSH 26.04.23The Global Advanced Transportation Pricing System Market was valued at USD 8 billion in 2025 and is estimated to grow at a CAGR of 11.2% to reach USD 22.8 billion by 2035.
Rapid urbanization, rising vehicle ownership, and escalating traffic congestion in major cities are driving the need for sophisticated pricing solutions. Governments and private operators are adopting electronic toll collection, vehicle miles traveled monitoring, and dynamic pricing models to better manage road usage, reduce congestion, and generate revenue. The market is also being propelled by the requirement for scalable, technology-driven infrastructure that can serve both highways and urban road networks. Real-time traffic monitoring, data analytics, and automated pricing engines are enabling authorities to optimize mobility while supporting smart city initiatives, making advanced transportation pricing systems a critical tool for modern urban planning. The global shift toward barrier-free and free-flow tolling is transforming how transportation pricing solutions are deployed. Fully automated, multi-lane tolling systems are driving demand for software, enforcement solutions, and pricing engines. Advances in vehicle detection, data processing, and payment technologies are enhancing the accuracy and efficiency of these systems. Improvements in RFID, automatic license plate recognition, and vehicle classification are enabling more precise pricing while lowering operational costs for system providers.
| Market Scope | |
|---|---|
| Start Year | 2025 |
| Forecast Year | 2026-2035 |
| Start Value | $8 Billion |
| Forecast Value | $22.8 Billion |
| CAGR | 11.2% |
The congestion pricing systems segment held a 35.7% share in 2025 and is expected to grow at a CAGR of 11.6% through 2035. These systems are increasingly implemented in urban corridors and citywide zones to manage traffic, reduce emissions, and fund public transport improvements. Authorities benefit from improved air quality, optimized traffic flow, and sustainable revenue generation, establishing congestion pricing as a key strategic segment of ATPS solutions.
The cloud-based deployment segment held 65.8% share in 2025 and is projected to grow at a CAGR of 11.4% from 2026 to 2035. Cloud solutions reduce operational costs, enable real-time system updates, and provide scalable infrastructure, allowing transport authorities to manage tolling and congestion pricing more efficiently than traditional on-premise systems.
U.S. Advanced Transportation Pricing System Market reached USD 2.3 billion in 2025. Expansion in the U.S. is fueled by federal, state, and municipal initiatives, along with private operators implementing electronic tolling, congestion pricing, and vehicle miles traveled monitoring. Declining fuel tax revenues due to electric vehicle adoption have created a need for alternative highway funding solutions, while rising urban congestion has increased demand for innovative traffic management and dedicated transportation project funding.
Key players operating in the Global Advanced Transportation Pricing System Market include Conduent, Thales, Kapsch TrafficCom, TomTom, Cubic, TransCore, IBM, Siemens Mobility, Q Free, and International Road Dynamics. Key strategies adopted by companies in the Global Advanced Transportation Pricing System Market include investing in R&D to develop integrated, AI-driven pricing engines and real-time monitoring platforms. Firms are focusing on cloud-based and scalable solutions that improve operational efficiency and reduce costs for transport authorities. Strategic partnerships with government agencies and private concessionaires help expand geographic reach and project adoption. Companies are also enhancing cybersecurity, compliance, and interoperability to meet regulatory standards and integrate with smart mobility ecosystems. Market leaders are emphasizing advanced data analytics, predictive traffic management, and IoT-enabled devices to strengthen customer loyalty and maintain competitive advantage in both developed and emerging markets.
Table of Contents
Chapter 1 Methodology
- 1.1 Research approach
- 1.2 Quality commitments
- 1.2.1 GMI AI policy & data integrity commitment
- 1.3 Research trail & confidence scoring
- 1.3.1 Research trail components
- 1.3.2 Scoring components
- 1.4 Data collection
- 1.4.1 Partial list of primary sources
- 1.5 Data mining sources
- 1.5.1 Paid sources
- 1.6 Base estimates and calculations
- 1.6.1 Base year calculation
- 1.7 Forecast model
- 1.8 Research transparency addendum
Chapter 2 Executive Summary
- 2.1 Industry 360° synopsis
- 2.2 Key market trends
- 2.2.1 Regional
- 2.2.2 Solution
- 2.2.3 Component
- 2.2.4 Deployment
- 2.2.5 Application
- 2.2.6 End Use
- 2.3 TAM analysis, 2026-2035
- 2.4 CXO perspectives: Strategic imperatives
- 2.4.1 Executive decision points
- 2.4.2 Critical success factors
- 2.5 Future outlook
- 2.6 Strategic recommendations
Chapter 3 Industry Insights
- 3.1 Industry ecosystem analysis
- 3.1.1 Supplier landscape
- 3.1.2 Profit margin
- 3.1.3 Cost structure
- 3.1.4 Value addition at each stage
- 3.1.5 Factor affecting the value chain
- 3.1.6 Disruptions
- 3.2 Industry impact forces
- 3.2.1 Growth drivers
- 3.2.1.1 Increasing adoption of smart city and mobility solutions
- 3.2.1.2 Expansion of public-private partnerships in transportation systems
- 3.2.1.3 Government initiatives promoting sustainable transport infrastructure and policies
- 3.2.1.4 Rising urban congestion demands efficient traffic management solutions
- 3.2.2 Industry pitfalls and challenges
- 3.2.2.1 High initial implementation and maintenance costs
- 3.2.2.2 Resistance from consumers to dynamic pricing models
- 3.2.3 Market opportunities
- 3.2.3.1 Integration with smart city infrastructure
- 3.2.3.2 Rising demand for sustainable and eco-friendly transport
- 3.2.3.3 Advancements in IoT, AI, and big data analytics
- 3.2.3.4 Expansion of public-private partnerships (PPP) in transport projects
- 3.2.1 Growth drivers
- 3.3 Growth potential analysis
- 3.4 Regulatory landscape
- 3.4.1 North America
- 3.4.1.1 Federal Highway Administration (FHWA) - Tolling and Pricing Program
- 3.4.1.2 E-ZPass Interagency Group - ETC Interoperability Standards
- 3.4.1.3 Canada: Transport Canada - Intelligent Transportation Systems Standards
- 3.4.2 Europe
- 3.4.2.1 European Electronic Toll Service (EETS) - EU Directive 2019/520
- 3.4.2.2 EU Intelligent Transport Systems Directive (2010/40/EU) and Delegated Regulations
- 3.4.3 Asia Pacific
- 3.4.3.1 China: Ministry of Transport - ETC National Standards (GB/T Standards)
- 3.4.3.2 India: National Highways Authority of India (NHAI) - FASTag Standards
- 3.4.4 Latin America
- 3.4.4.1 Brazil: ANTT - National Land Transportation Agency Tolling Regulation
- 3.4.4.2 Mexico: SCT - Secretariat of Infrastructure, Communications and Transport
- 3.4.5 Middle East & Africa
- 3.4.5.1 UAE: Roads and Transport Authority (RTA) - Toll System Regulations
- 3.4.5.2 Saudi Arabia: SASO and Ministry of Transport - Road Pricing Standards
- 3.4.5.3 African Union: Programme for Infrastructure Development in Africa (PIDA)
- 3.4.1 North America
- 3.5 Porter's analysis
- 3.6 PESTEL analysis
- 3.7 Technology and innovation landscape
- 3.7.1 Current technological trends
- 3.7.2 Emerging technologies
- 3.8 Business Models and Monetization Framework
- 3.8.1 Revenue Models
- 3.8.2 Value Chain and Ecosystem
- 3.8.3 Go-to-Market Strategy
- 3.9 Quality Standards, Compliance, and Product Risk
- 3.9.1 Component Safety and Regulatory Compliance
- 3.9.2 Product Performance and Durability Risk
- 3.9.3 Operational and Supply Chain Risks
- 3.10 ATPS Platform Architecture
- 3.10.1 Multi-Layer ATPS System Architecture Models
- 3.10.2 Vehicle-to-Infrastructure and Connected Mobility Integration
- 3.11 Patent analysis (Driven by Primary Research)
- 3.12 Pricing Analysis (Driven by Primary Research)
- 3.12.1 Historical Price Trend Analysis
- 3.12.2 Pricing Strategy by Player Type
- 3.13 Production statistics
- 3.13.1 Production hubs
- 3.13.2 Consumption hubs
- 3.14 Trade Data Analysis (Driven by Paid Database)
- 3.14.1 Import/Export Volume & Value Trends
- 3.14.2 Key Trade Corridors & Tariff Impact
- 3.15 Sustainability and environmental aspects
- 3.15.1 Sustainable Manufacturing Practices
- 3.15.2 Energy Efficiency in Production and Operations
- 3.15.3 Carbon footprint considerations
- 3.15.3.1 GenAI use cases & adoption roadmap by segment
- 3.15.3.1.1 Tread pattern design generation
- 3.15.3.1.2 Customer service chatbots & technical support
- 3.15.3.1.3 Marketing content creation
- 3.15.3.1.4 Risks, limitations & regulatory considerations
- 3.15.3.1 GenAI use cases & adoption roadmap by segment
- 3.16 Forecast assumptions & scenario analysis (Driven by Primary Research)
- 3.16.1 Base Case - key macro & industry variables driving CAGR
- 3.16.2 Optimistic Scenarios - Favorable Macro and Industry Tailwinds
- 3.16.3 Pessimistic Scenario - Macroeconomic slowdown or industry headwinds
Chapter 4 Competitive Landscape, 2025
- 4.1 Introduction
- 4.2 Company market share analysis
- 4.2.1 North America
- 4.2.2 Europe
- 4.2.3 Asia Pacific
- 4.2.4 LATAM
- 4.2.5 MEA
- 4.3 Competitive analysis of major market players
- 4.4 Competitive positioning matrix
- 4.5 Strategic outlook matrix
- 4.6 Key developments
- 4.6.1 Mergers & acquisitions
- 4.6.2 Partnerships & collaborations
- 4.6.3 New product launches
- 4.6.4 Expansion plans and funding
Chapter 5 Market Estimates & Forecast, By Solution, 2022 - 2035 ($Mn)
- 5.1 Key trends
- 5.2 Congestion Pricing Systems
- 5.3 Vehicle Miles Traveled (VMT) Monitoring
- 5.4 Electronic Toll Collection (ETC)
- 5.5 Dynamic Fare Management
- 5.6 Parking Pricing & Management
- 5.7 Other Solutions
Chapter 6 Market Estimates & Forecast, By Component, 2022 - 2035 ($Mn, Units)
- 6.1 Key trends
- 6.2 Hardware
- 6.2.1 Transponders / OBUs
- 6.2.2 ANPR / ALPR Cameras
- 6.2.3 RFID Readers
- 6.2.4 Communication Equipment
- 6.2.5 Others
- 6.3 Software
- 6.3.1 Back-Office Tolling Platform
- 6.3.2 Payment & Settlement Software
- 6.3.3 Congestion Pricing Software
- 6.3.4 Others
- 6.4 Services
- 6.4.1 Professional Services
- 6.4.2 Managed Services
Chapter 7 Market Estimates & Forecast, By Deployment, 2022 - 2035 ($Mn)
- 7.1 Key trends
- 7.2 Cloud-based
- 7.3 On-premise
Chapter 8 Market Estimates & Forecast, By Application, 2022 - 2035 ($Mn)
- 8.1 Key trends
- 8.2 Urban Congestion Management
- 8.3 Smart City Integration
- 8.4 Freight & Logistics Pricing
- 8.5 Parking Management
- 8.6 Others
Chapter 9 Market Estimates & Forecast, By End Use, 2022 - 2035 ($Mn)
- 9.1 Key trends
- 9.2 Government Authorities
- 9.3 Private Transport Companies
- 9.4 Logistics / Fleet Operators
- 9.5 Vehicle Owners
Chapter 10 Market Estimates & Forecast, By Region, 2022 - 2035 ($Mn)
- 10.1 Key trends
- 10.2 North America
- 10.2.1 US
- 10.2.2 Canada
- 10.3 Europe
- 10.3.1 Germany
- 10.3.2 UK
- 10.3.3 France
- 10.3.4 Italy
- 10.3.5 Spain
- 10.3.6 Nordics
- 10.3.7 Russia
- 10.3.8 Norway
- 10.3.9 Denmark
- 10.3.10 Netherlands
- 10.3.11 Belgium
- 10.4 Asia Pacific
- 10.4.1 China
- 10.4.2 India
- 10.4.3 Japan
- 10.4.4 South Korea
- 10.4.5 ANZ
- 10.4.6 Vietnam
- 10.4.7 Indonesia
- 10.4.8 Singapore
- 10.4.9 Malaysia
- 10.4.10 Thailand
- 10.5 Latin America
- 10.5.1 Brazil
- 10.5.2 Mexico
- 10.5.3 Argentina
- 10.6 MEA
- 10.6.1 South Africa
- 10.6.2 Saudi Arabia
- 10.6.3 UAE
Chapter 11 Company Profiles
- 11.1 Global companies
- 11.1.1 Conduent
- 11.1.2 Cubic
- 11.1.3 Ericsson
- 11.1.4 IBM
- 11.1.5 Fluor
- 11.1.6 Hewlett Packard
- 11.1.7 International Road Dynamics
- 11.1.8 Kapsch TrafficCom
- 11.1.9 Siemens Mobility
- 11.1.10 TomTom
- 11.1.11 TransCore
- 11.1.12 Worldline
- 11.2 Regional players
- 11.2.1 ACS
- 11.2.2 INIT
- 11.2.3 Iteris
- 11.2.4 Mobiliya
- 11.2.5 Moovit
- 11.2.6 Q-Free
- 11.2.7 TollPlus
- 11.2.8 Viaplus
