
|
시장보고서
상품코드
1998768
전기 상용차 시장 기회, 성장요인, 업계 동향 분석 및 예측(2026-2035년)Electric Commercial Vehicle Market Opportunity, Growth Drivers, Industry Trend Analysis, and Forecast 2026 - 2035 |
||||||
세계의 전기 상용차 시장은 2025년에 842억 달러로 평가되며, CAGR 10.1%로 성장하며, 2035년까지 2,220억 달러에 달할 것으로 추정되고 있습니다.

이러한 견고한 성장은 차량 전기화의 가속화, 배터리 비용의 하락, 엄격한 배기가스 규제, 무공해 운송을 지원하는 정부의 강력한 인센티브에 의해 주도되고 있습니다. 전기상용차(ECV)는 낮은 총소유비용, 낮은 유지보수 요구사항, 배기가스 배출이 없습니다는 장점으로 인해 물류, 대중교통, 지자체 서비스 및 산업 분야에서 점점 더 많이 채택되고 있습니다. 배터리의 에너지 밀도, 파워 일렉트로닉스, 급속 충전 인프라의 발전으로 차량의 주행거리, 적재 능력, 운영 효율이 크게 향상되어 전기 상용차는 도시와 농촌 모두에서 실용화되어 가고 있습니다. 또한 기업의 지속가능성 요건과 ESG 컴플라이언스 목표에 따라 차량 보유 사업자들은 디젤 차량에서 탈피해야 하며, 이는 장기적인 시장 성장을 더욱 촉진하고 있습니다.
| 시장 범위 | |
|---|---|
| 시작연도 | 2025년 |
| 예측 기간 | 2026-2035년 |
| 개시 금액 | 842억 달러 |
| 예측액 | 2,220억 달러 |
| CAGR | 10.1% |
밴 부문은 2025년 37%의 점유율을 차지하며, 2026-2035년 연평균 복합 성장률(CAGR) 9.5%로 성장할 것으로 추정됩니다. 전기 밴은 컴팩트한 크기, 높은 기동성, 혼잡한 도로를 효율적으로 주행할 수 있는 능력으로 인해 도시 지역 운영에 이상적인 솔루션으로 점점 더 많은 주목을 받고 있습니다. 물류 및 배송 업체들은 E-Commerce 및 당일 배송 서비스에 대한 수요가 증가함에 따라 전기 밴을 선호하고 있습니다. 디젤 밴에 비해 전기 밴은 연료비 및 유지보수 비용이 낮아 사업자에게 장기적인 비용 절감과 업무 효율성 향상을 가져다 줍니다.
2025년에는 101-250kWh 배터리 부문이 28%의 점유율을 차지하며, 2026-2035년 연평균 복합 성장률(CAGR) 8.2%로 성장할 것으로 전망됩니다. 이 범위의 중형 배터리는 가정이나 공공 급속 충전소에서 효율적인 전력 소비와 빠른 충전을 제공합니다. 이 배터리는 대부분의 기존 충전 인프라와 호환되며, 전기 상용차의 빠른 충전과 함께 일상 업무에서 최적의 편의성과 성능을 보장합니다.
중국의 전기상용차 시장은 2025년 375억 달러에 달했습니다. 현지 생산 상용차의 높은 비용 효율성으로 인해 중국의 전기자동차 산업은 빠르게 성장하고 있습니다. 중국은 전기자동차 공급망을 강력하게 장악하고 있으며, 배터리 생산과 원자재 조달을 국내에서 진행하고 있습니다. 이러한 수직적 통합으로 생산비용이 절감되고 해외 공급업체에 대한 의존도가 낮아지면서 중국 전기상용차는 세계에서 높은 경쟁력을 갖추게 되었습니다. 또한 각 지역의 제조업체들은 다양한 시장에서 틈새 전기상용차 부문으로 사업을 확장하며 성장을 주도하고 있습니다.
자주 묻는 질문
목차
제1장 조사 방법과 범위
제2장 개요
제3장 업계 인사이트
제4장 경쟁 구도
제5장 시장 추산·예측 : 차량별, 2022-2035
제6장 시장 추산·예측 : 배터리 용량별, 2022-2035
제7장 시장 추산·예측 : 추진력별, 2022-2035
제8장 시장 추산·예측 : 용도별, 2022-2035
제9장 시장 추산·예측 : 지역별, 2022-2035
제10장 기업 개요
KSA 26.04.20The Global Electric Commercial Vehicle Market was valued at USD 84.2 billion in 2025 and is estimated to grow at a CAGR of 10.1% to reach USD 222 billion by 2035.
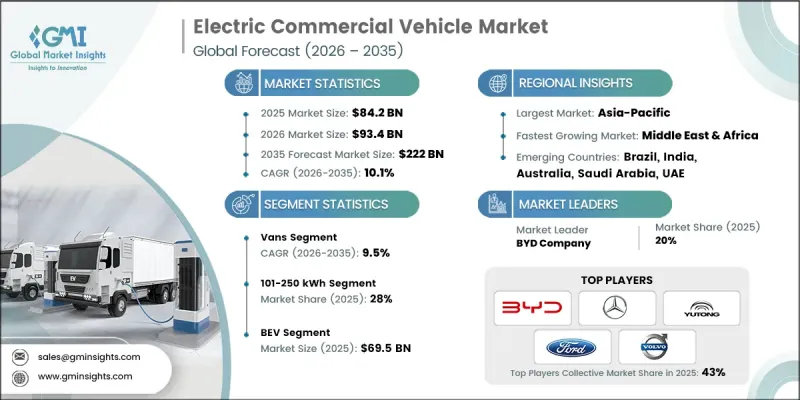
The robust growth is driven by accelerating fleet electrification, declining battery costs, stringent emission regulations, and strong government incentives supporting zero-emission transportation. Electric commercial vehicles (ECVs) are increasingly adopted across logistics, public transportation, municipal services, and industrial operations due to their lower total cost of ownership, reduced maintenance requirements, and zero tailpipe emissions. Advancements in battery energy density, power electronics, and fast-charging infrastructure are significantly improving vehicle range, payload capacity, and operational efficiency, making electric commercial vehicles viable across both urban and regional applications. In addition, corporate sustainability mandates and ESG compliance goals are compelling fleet operators to transition away from diesel-powered vehicles, further reinforcing long-term market growth.
| Market Scope | |
|---|---|
| Start Year | 2025 |
| Forecast Year | 2026-2035 |
| Start Value | $84.2 Billion |
| Forecast Value | $222 Billion |
| CAGR | 10.1% |
The vans segment held 37% share in 2025 and is estimated to grow at a CAGR of 9.5% from 2026 to 2035. Electric vans are increasingly seen as ideal solutions for urban operations due to their compact size, high maneuverability, and ability to navigate congested streets efficiently. Logistics and delivery companies favor electric vans because of the rising demand for e-commerce and same-day delivery services. Compared to diesel vans, electric vans offer lower fuel and maintenance costs, providing operators with long-term cost savings and improved operational efficiency.
The 101-250 kWh battery segment held a 28% share in 2025 and is expected to grow at a CAGR of 8.2% from 2026 to 2035. Mid-sized batteries in this range deliver efficient power consumption and faster charging, whether at home or at public fast-charging stations. These batteries are compatible with most existing charging infrastructure, allowing electric commercial vehicles to recharge quickly while ensuring optimal usability and performance for daily operations.
China Electric Commercial Vehicle Market reached USD 37.5 billion in 2025. The country's EV industry is rapidly growing due to the cost-effectiveness of locally produced commercial vehicles. China maintains strong control over its EV supply chain, producing batteries and sourcing raw materials domestically. This vertical integration lowers production costs and reduces reliance on international suppliers, making Chinese electric commercial vehicles highly competitive globally. Regional manufacturers are also expanding their footprint in niche electric commercial vehicle segments across different markets, driving further growth.
Key players operating in the Global Electric Commercial Vehicle Market include AB Volvo, BYD, Daimler Truck Holding AG, Ford Motor Company, Hyundai Motor Company, Tesla Inc., PACCAR Inc., Rivian Automotive, Traton SE, Zhengzhou Yutong Bus Co., Ltd., Tata Motors, Ashok Leyland, and NFI Group, among others. Companies in the Electric Commercial Vehicle Market are strengthening their market presence through a combination of product innovation, strategic partnerships, and capacity expansion. Leading manufacturers are investing heavily in advanced battery technologies, modular electric platforms, and ultra-fast charging capabilities to enhance vehicle performance and reduce total ownership costs. Partnerships with battery suppliers, charging infrastructure providers, and logistics operators enable faster commercialization and large-scale fleet deployments. Many players are expanding regional manufacturing facilities to localize production, reduce costs, and comply with government localization policies.
Table of Contents
Chapter 1 Methodology & Scope
- 1.1 Research approach
- 1.2 Quality Commitments
- 1.2.1 GMI AI policy & data integrity commitment
- 1.2.1.1 Source consistency protocol
- 1.2.1 GMI AI policy & data integrity commitment
- 1.3 Research Trail & Confidence Scoring
- 1.3.1 Research Trail Components
- 1.3.2 Scoring Components
- 1.4 Data Collection
- 1.4.1 Partial list of primary sources
- 1.5 Data mining sources
- 1.5.1 Paid sources
- 1.5.1.1 Sources, by region
- 1.5.1 Paid sources
- 1.6 Base estimates and calculations
- 1.6.1 Base year calculation for any one approach
- 1.7 Forecast
- 1.7.1 Quantified market impact analysis
- 1.7.1.1 Mathematical impact of growth parameters on forecast
- 1.7.1 Quantified market impact analysis
- 1.8 Research transparency addendum
- 1.8.1 Source attribution framework
- 1.8.2 Quality assurance metrics
- 1.8.3 Our commitment to trust
Chapter 2 Executive Summary
- 2.1 Industry 360° synopsis
- 2.2 Key market trends
- 2.2.1 Regional
- 2.2.2 Vehicle
- 2.2.3 Battery capacity
- 2.2.4 Propulsion
- 2.2.5 Application
- 2.3 TAM Analysis, 2026-2035
- 2.4 CXO perspectives: Strategic imperatives
Chapter 3 Industry Insights
- 3.1 Industry ecosystem analysis
- 3.1.1 Supplier landscape
- 3.1.1.1 Battery Manufacturer
- 3.1.1.2 Component Supplier
- 3.1.1.3 OEM (Original Equipment Manufacturer)
- 3.1.1.4 Distributor / Dealer
- 3.1.1. 5 End user
- 3.1.2 Cost structure
- 3.1.3 Profit margin
- 3.1.4 Value addition at each stage
- 3.1.5 Vertical integration trends
- 3.1.6 Disruptors
- 3.1.1 Supplier landscape
- 3.2 Impact on forces
- 3.2.1 Growth drivers
- 3.2.1.1 Strict emission regulations enforcement
- 3.2.1.2 E-commerce and last-mile demand growth
- 3.2.1.3 Corporate fleet electrification mandates
- 3.2.1.4 Urban air quality improvement initiatives
- 3.2.2 Industry pitfalls & challenges
- 3.2.2.1 Insufficient charging infrastructure coverage
- 3.2.2.2 Raw material and battery shortages
- 3.2.3 Market opportunities
- 3.2.3.1 High-power fast charging deployment
- 3.2.3.2 Battery cost reduction advances
- 3.2.3.3 Scalable modular vehicle platforms
- 3.2.3.4 V2G and energy storage integration
- 3.2.1 Growth drivers
- 3.3 Technology trends & innovation ecosystem
- 3.3.1 Current technologies
- 3.3.2 Emerging technologies
- 3.4 Growth potential analysis
- 3.5 Regulatory landscape
- 3.5.1 North America
- 3.5.1.1 U.S. Federal Motor Vehicle Safety Standards
- 3.5.1.2 Canadian Electric Vehicle Safety Regulations
- 3.5.2 Europe
- 3.5.2.1 UNECE Regulation
- 3.5.2.2 EU EV Labelling Regulation
- 3.5.3 Asia-Pacific
- 3.5.3.1 AIS-142 (Automotive Industry Standard, India)
- 3.5.3.2 China GB
- 3.5.4 Latin America
- 3.5.4.1 ABNT NBR
- 3.5.4.2 NOM-116-SCFI-2016
- 3.5.5 Middle East & Africa
- 3.5.5.1 SASO 2888/2018
- 3.5.5.2 SANS 1737
- 3.5.1 North America
- 3.6 Porter's analysis
- 3.7 PESTEL analysis
- 3.8 Patent analysis (Driven by Primary Research)
- 3.9 Pricing Analysis (Driven by Primary Research)
- 3.9.1 Historical Price Trend Analysis
- 3.9.2 Pricing Strategy by Player Type
- 3.10 Trade statistics (Driven by Paid Database)
- 3.10.1 Production hubs
- 3.10.2 Consumption hubs
- 3.10.3 Export and import
- 3.11 Sustainability and environmental aspects
- 3.11.1 Sustainable practices
- 3.11.2 Waste reduction strategies
- 3.11.3 Energy efficiency in production
- 3.11.4 Eco-friendly initiatives
- 3.11.5 Carbon footprint considerations
- 3.12 Impact of AI & generative AI on the market
- 3.12.1 AI-driven disruption of existing business models
- 3.12.1.1 Predictive Maintenance & Operations Optimization
- 3.12.1.2 Automated design optimization
- 3.12.1.3 Supply chain AI for demand forecasting
- 3.12.1.4 GenAI use cases & adoption roadmap by segment
- 3.12.1.4.1 Tread pattern design generation
- 3.12.1.4.2 Customer service chatbots & technical support
- 3.12.1.4.3 Marketing content creation
- 3.12.1.4.4 Risks, limitations & regulatory considerations
- 3.12.1.4.4.1 Data privacy in IoT-enabled smart products
- 3.12.1.4.4.2 AI algorithm transparency requirements
- 3.12.1.4.4.3 Liability in AI-driven product failures
- 3.12.1 AI-driven disruption of existing business models
- 3.13 Forecast assumptions & scenario analysis (Driven by Primary Research)
- 3.13.1 Base Case - key macro & industry variables driving CAGR
- 3.13.2 Optimistic Scenarios - Favorable Macro and Industry Tailwinds
- 3.13.3 Pessimistic Scenario - Macroeconomic slowdown or industry headwinds
Chapter 4 Competitive Landscape, 2025
- 4.1 Introduction
- 4.2 Company market share analysis
- 4.2.1 North America
- 4.2.2 Europe
- 4.2.3 Asia-Pacific
- 4.2.4 Latin America
- 4.2.5 Middle East & Africa
- 4.3 Competitive analysis of major market players
- 4.4 Competitive positioning matrix
- 4.5 Company Tier Benchmarking
- 4.5.1 Tier Classification Criteria & Qualifying Thresholds
- 4.5.2 Tier Positioning Matrix by Revenue, Geography & Innovation
- 4.6 Key developments
- 4.6.1 Mergers & acquisitions
- 4.6.2 Partnerships & collaborations
- 4.6.3 New product launches
- 4.6.4 Expansion plans and funding
Chapter 5 Market Estimates & Forecast, By Vehicle, 2022 - 2035 ($ Bn, Units)
- 5.1 Key trends
- 5.2 Pickup Trucks
- 5.2.1 Light-Duty Electric Pickups
- 5.2.2 Heavy Light-Duty Electric Pickups
- 5.3 Vans
- 5.3.1 Compact Electric Vans
- 5.3.2 Mid-Size Electric Vans
- 5.3.3 Full-Size Electric Vans
- 5.4 Trucks
- 5.4.1 Medium-Duty Electric Trucks
- 5.4.2 Heavy-Duty Electric Trucks
- 5.5 Buses & Coaches
- 5.5.1 Electric Transit Buses
- 5.5.2 Electric Intercity Coaches
- 5.5.3 Electric School Buses
Chapter 6 Market Estimates & Forecast, By Battery Capacity, 2022 - 2035 ($ Bn, Units)
- 6.1 Key trends
- 6.2 Less than 100 kWh
- 6.3 101-250 kWh
- 6.4 251-400 kWh
- 6.5 401-550 kWh
- 6.6 More than 550 kWh
Chapter 7 Market Estimates & Forecast, By Propulsion, 2022 - 2035 ($ Bn, Units)
- 7.1 Key trends
- 7.2 Battery Electric Vehicle (BEV)
- 7.3 Fuel Cell Electric Vehicle (FCEV)
- 7.4 Plug-in Hybrid Electric Vehicle (PHEV)
Chapter 8 Market Estimates & Forecast, By Application, 2022 - 2035 ($ Bn, Units)
- 8.1 Key trends
- 8.2 Last-Mile Delivery
- 8.3 Field Services
- 8.4 Distribution Services
- 8.5 Long-Haul Transportation
- 8.6 Others
Chapter 9 Market Estimates & Forecast, By Region, 2022 - 2035 ($ Bn, Units)
- 9.1 North America
- 9.1.1 US
- 9.1.2 Canada
- 9.2 Europe
- 9.2.1 UK
- 9.2.2 Germany
- 9.2.3 France
- 9.2.4 Italy
- 9.2.5 Spain
- 9.2.6 Belgium
- 9.2.7 Netherlands
- 9.2.8 Sweden
- 9.2.9 Russia
- 9.3 Asia Pacific
- 9.3.1 China
- 9.3.2 India
- 9.3.3 Japan
- 9.3.4 Australia
- 9.3.5 Singapore
- 9.3.6 South Korea
- 9.3.7 Vietnam
- 9.3.8 Indonesia
- 9.4 Latin America
- 9.4.1 Brazil
- 9.4.2 Mexico
- 9.4.3 Argentina
- 9.5 MEA
- 9.5.1 South Africa
- 9.5.2 Saudi Arabia
- 9.5.3 UAE
Chapter 10 Company Profiles
- 10.1 Global players
- 10.1.1 BYD Company
- 10.1.2 Mercedes-Benz
- 10.1.3 Volvo
- 10.1.4 Tesla
- 10.1.5 Yutong Bus
- 10.1.6 Ford Motor Company
- 10.1.7 Scania
- 10.1.8 Daimler Truck
- 10.1.9 PACCAR
- 10.2 Regional players
- 10.2.1 Tata Motors
- 10.2.2 Dongfeng Motor
- 10.2.3 Renault Trucks
- 10.2.4 Proterra
- 10.2.5 Arrival
- 10.2.6 VinFast Auto
- 10.2.7 Lion Electric
- 10.3 Emerging players
- 10.3.1 Rivian Automotive
- 10.3.2 Nikola
- 10.3.3 Workhorse
- 10.3.4 VDL Groep

