
|
시장보고서
상품코드
1998819
스마트 플릿 관리 시장 기회, 성장 촉진요인, 업계 동향 분석, 예측(2026-2035년)Smart Fleet Management Market Opportunity, Growth Drivers, Industry Trend Analysis, and Forecast 2026 - 2035 |
||||||
세계의 스마트 플릿 관리 시장은 2025년에 614억 달러로 평가되며, CAGR 8.9%로 성장하며, 2035년까지 1,395억 달러에 달할 것으로 예측됩니다.
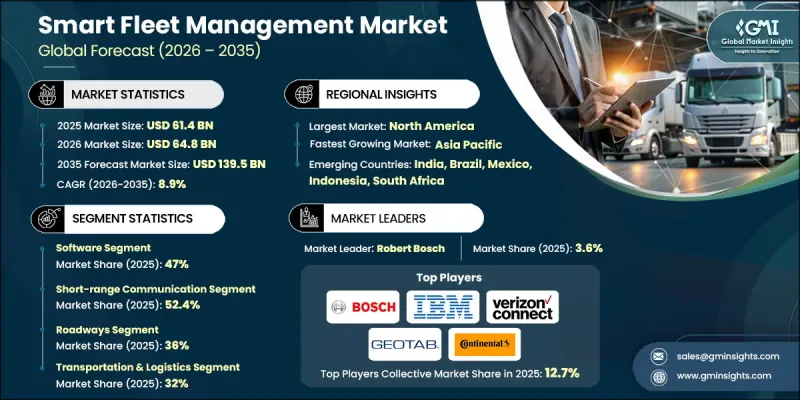
기업이 업무의 가시성과 효율성을 점점 더 중요시함에 따라 시장은 크게 성장할 것으로 예측됩니다. 차량 보유를 관리하는 기업은 차량 위치, 운전자 성과 및 운영 지표를 종합적으로 파악하기 위해 스마트 차량 관리 시스템에 대한 투자를 진행하고 있습니다. 이를 통해 관리자는 데이터에 기반한 의사결정을 내리고, 지연을 줄이고, 차량 가동률을 최적화하며, 전반적인 효율성을 향상시킬 수 있습니다. 연료비 상승과 운영상의 압박으로 인해 공회전 최소화, 경로 최적화, 운전자 행동 추적 등의 솔루션 도입이 증가하고 있습니다. 분석 기술과 텔레매틱스를 활용하면 차량 운영자는 연료 소비를 줄이고, 생산성을 향상시키며, 예지보전 전략을 실행할 수 있습니다. 커넥티드카 및 IoT 지원 시스템의 통합은 실시간 모니터링과 실행 가능한 인사이트 확보를 촉진하고 있으며, 기업은 산업을 불문하고 비용 효율성과 차량 성능을 향상시키면서 운영상의 문제를 해결할 수 있게 되었습니다.
| 시장 범위 | |
|---|---|
| 시작연도 | 2025년 |
| 예측 기간 | 2026-2035년 |
| 시작 금액 | 614억 달러 |
| 예측 금액 | 1,395억 달러 |
| CAGR | 8.9% |
2025년 기준 단거리 통신 부문은 52.4%의 점유율을 차지하고 있으며, 2035년까지 연평균 복합 성장률(CAGR) 8%를 나타낼 것으로 예측됩니다. 블루투스, RFID, Wi-Fi 등의 기술을 통해 차량 간 또는 차량과 지역 인프라 간의 제한된 거리에서 데이터를 교환할 수 있습니다. 이 솔루션은 국지적 모니터링, 센서에 의한 신속한 업데이트, 차량 기지, 적재 지점, 캠퍼스 운영 전반에 걸쳐 차량 그룹을 조정할 수 있도록 지원합니다.
2025년 기준, 운송 및 물류 부문은 32%의 점유율을 차지했습니다. 스마트 차량 관리 툴은 사업자가 차량 가동률, 경로 계획, 운전자의 운전 행동 및 연비 효율성을 최적화할 수 있도록 지원합니다. 실시간 추적, 예지보전 및 분석 기능을 통해 비용 절감, 납기 준수, 그리고 지역 및 국제 네트워크 전반의 운영 효율성을 향상시킬 수 있습니다.
미국의 스마트 차량 관리 시장은 2025년 210억 달러에 달할 것으로 예측됩니다. 미국 상용차 업체들은 연료 소비량 모니터링, 배송 경로 최적화, 운전자 성과 추적 등을 위해 텔레매틱스 활용을 확대하고 있습니다. 클라우드 기반 플랫폼과 AI를 활용한 예지보전 솔루션은 다양한 차종에서 폭넓게 채택되고 있습니다. 전자기록장치(ELD) 규정 준수는 실시간 보고 및 성능 벤치마킹을 더욱 강화하여 대규모 트럭 운송 네트워크 전반의 안전, 책임감 및 운영 효율성을 향상시키는 데 기여하고 있습니다.
자주 묻는 질문
목차
제1장 조사 방법
제2장 개요
제3장 업계 인사이트
제4장 경쟁 구도
제5장 시장 추산·예측 : 컴포넌트별, 2022-2035년
제6장 시장 추산·예측 : 접속 기술별, 2022-2035년
제7장 시장 추산·예측 : 운송 수단별, 2022-2035년
제8장 시장 추산·예측 : 최종 용도 산업별, 2022-2035년
제9장 시장 추산·예측 : 지역별, 2022-2035년
제10장 기업 개요
KSA 26.04.23The Global Smart Fleet Management Market was valued at USD 61.4 billion in 2025 and is estimated to grow at a CAGR of 8.9% to reach USD 139.5 billion by 2035.

Market growth is poised for significant growth as businesses increasingly prioritize operational visibility and efficiency. Companies managing vehicle fleets are investing in smart fleet management systems to gain comprehensive oversight of vehicle locations, driver performance, and operational metrics. This enables managers to make data-driven decisions, reduce delays, optimize fleet utilization, and improve overall efficiency. Rising fuel costs and operational pressures are driving the adoption of solutions that minimize idling, optimize routes, and track driver behavior. By leveraging analytics and telematics, fleet operators can reduce fuel consumption, enhance productivity, and implement predictive maintenance strategies. The growing integration of connected vehicles and IoT-enabled systems also facilitates real-time monitoring and actionable insights, enabling companies to address operational challenges while improving cost efficiency and fleet performance across industries.
| Market Scope | |
|---|---|
| Start Year | 2025 |
| Forecast Year | 2026-2035 |
| Start Value | $61.4 Billion |
| Forecast Value | $139.5 Billion |
| CAGR | 8.9% |
The short-range communication segment held a 52.4% share in 2025 and is expected to grow at a CAGR of 8% through 2035. Technologies such as Bluetooth, RFID, and Wi-Fi allow limited-distance data exchange between vehicles or between vehicles and local infrastructure. These solutions support localized monitoring, rapid updates via sensors, and fleet coordination across depots, loading points, and campus operations.
The transportation and logistics sector accounted for 32% share in 2025. Smart fleet management tools help operators optimize vehicle utilization, route planning, driver behavior, and fuel efficiency. Real-time tracking, predictive maintenance, and analytics reduce costs, ensure timely deliveries, and enhance operational efficiency across regional and international networks.
U.S. Smart Fleet Management Market reached USD 21 billion in 2025. Commercial fleet operators in the U.S. increasingly use telematics to monitor fuel usage, optimize delivery routes, and track driver performance. Cloud-based platforms and AI-driven predictive maintenance solutions are widely adopted across different vehicle types. Regulatory compliance for electronic logging devices (ELDs) further supports real-time reporting and performance benchmarking, improving safety, accountability, and operational efficiency across large trucking networks.
Key players in the Global Smart Fleet Management Market include IBM, Cisco Systems, Siemens, Continental, Denso, Infineon Technologies, Robert Bosch, Magellan and Trimble Navigation, Zonar Systems, and General Motors. Companies in the Smart Fleet Management Market are leveraging multiple strategies to solidify their market presence. Key approaches include investing in advanced telematics and IoT platforms that enable real-time fleet tracking and predictive analytics. Strategic partnerships with logistics operators and automotive manufacturers allow firms to expand their customer base and integrate solutions across vehicle types. Several players are enhancing their offerings through AI-driven route optimization, fuel management tools, and driver behavior monitoring systems. Expansion into new geographic regions and development of modular, scalable solutions provide flexibility for small and large fleet operators alike. Additionally, firms are focusing on regulatory compliance, cybersecurity, and cloud-based platforms to maintain trust, improve operational efficiency, and strengthen competitive positioning in the global smart fleet management market.
Table of Contents
Chapter 1 Methodology
- 1.1 Research approach
- 1.2 Quality commitments
- 1.3 GMI AI policy & data integrity commitment
- 1.4 Research trail & confidence scoring
- 1.4.1 Research trail components
- 1.4.2 Scoring components
- 1.5 Data collection
- 1.5.1 Partial list of primary sources
- 1.6 Data mining sources
- 1.6.1 Paid sources
- 1.7 Base estimates and calculations
- 1.7.1 Base year calculation
- 1.8 Forecast model
- 1.9 Research transparency addendum
Chapter 2 Executive Summary
- 2.1 Industry 360° synopsis
- 2.2 Key market trends
- 2.2.1 Regional
- 2.2.2 Component
- 2.2.3 Connectivity technology
- 2.2.4 Transport mode
- 2.2.5 End use industry
- 2.3 TAM analysis, 2026-2035
- 2.4 CXO perspectives: Strategic imperatives
Chapter 3 Industry Insights
- 3.1 Industry ecosystem analysis
- 3.1.1 Supplier landscape
- 3.1.2 Profit margin
- 3.1.3 Cost structure
- 3.1.4 Value addition at each stage
- 3.1.5 Factor affecting the value chain
- 3.1.6 Disruptions
- 3.2 Industry impact forces
- 3.2.1 Growth drivers
- 3.2.1.1 Real-time fleet visibility
- 3.2.1.2 Fuel cost optimization
- 3.2.1.3 Safety & compliance regulations
- 3.2.1.4 E-commerce & last-mile delivery growth
- 3.2.2 Industry pitfalls and challenges
- 3.2.2.1 High initial deployment costs
- 3.2.2.2 Data privacy & cybersecurity risks
- 3.2.3 Market opportunities
- 3.2.3.1 EV charging infrastructure integration
- 3.2.3.2 Emerging market expansion
- 3.2.3.3 Usage-based insurance (UBI)
- 3.2.3.4 Public sector fleet digitization
- 3.2.1 Growth drivers
- 3.3 Growth potential analysis
- 3.4 Regulatory landscape
- 3.4.1 North America
- 3.4.1.1 National Highway Traffic Safety Administration (NHTSA)
- 3.4.1.2 Transport Canada Motor Vehicle Safety Standards (CMVSS)
- 3.4.2 Europe
- 3.4.2.1 European Whole Vehicle Type Approval (WVTA)
- 3.4.2.2 ECE Regulation 124 (R124)
- 3.4.3 Asia Pacific
- 3.4.3.1 Japan Automotive Standards Organization (JASO)
- 3.4.3.2 AIS (Automotive Industry Standards) - India
- 3.4.4 Latin America
- 3.4.4.1 Brazilian National Traffic Council (CONTRAN) - Resolution 242
- 3.4.4.2 Mexican NOM Standards (Normas Oficiales Mexicanas)
- 3.4.5 Middle East & Africa
- 3.4.5.1 Emirates Authority for Standardization and Metrology (ESMA)
- 3.4.5.2 South African Bureau of Standards (SABS)
- 3.4.1 North America
- 3.5 Porter's analysis
- 3.6 PESTEL analysis
- 3.7 Technology and innovation landscape
- 3.7.1 Current technological trends
- 3.7.2 Emerging technologies
- 3.8 Pricing Analysis (Driven by Primary Research)
- 3.8.1 Historical Price Trend Analysis
- 3.8.2 Pricing Strategy by Player Type (Premium / Value / Cost-plus)
- 3.9 Cost breakdown analysis
- 3.10 Patent analysis (Driven by Primary Research)
- 3.11 Sustainability and environmental aspects
- 3.11.1 Sustainable practices
- 3.11.2 Waste reduction strategies
- 3.11.3 Energy efficiency in production
- 3.11.4 Eco-friendly initiatives
- 3.11.5 Carbon footprint considerations
- 3.12 Impact of AI & Generative AI on the Market
- 3.12.1 AI-driven disruption of existing business models
- 3.12.2 GenAI use cases & adoption roadmap by segment
- 3.12.3 Risks, limitations & regulatory considerations
- 3.13 Infrastructure & deployment landscape (driven by primary research)
- 3.13.1 Deployment penetration by region & buyer segment
- 3.13.2 Scalability constraints & infrastructure investment trends
- 3.14 Forecast assumptions & scenario analysis (driven by primary research)
- 3.14.1 Base Case - key macro & industry variables driving CAGR
- 3.14.2 Optimistic Scenarios - Favorable macro and industry tailwinds
- 3.14.3 Pessimistic Scenario - Macroeconomic slowdown or industry headwinds
Chapter 4 Competitive Landscape, 2025
- 4.1 Introduction
- 4.2 Company market share analysis
- 4.2.1 North America
- 4.2.2 Europe
- 4.2.3 Asia Pacific
- 4.2.4 LATAM
- 4.2.5 MEA
- 4.3 Competitive analysis of major market players
- 4.4 Competitive positioning matrix
- 4.5 Key developments
- 4.5.1 Mergers & acquisitions
- 4.5.2 Partnerships & collaborations
- 4.5.3 New product launches
- 4.5.4 Expansion plans and funding
- 4.6 Company tier benchmarking
- 4.6.1 Tier classification criteria & qualifying thresholds
- 4.6.2 Tier positioning matrix by revenue, geography & innovation
Chapter 5 Market Estimates & Forecast, By Component, 2022 - 2035 ($Mn, Units)
- 5.1 Key trends
- 5.2 Hardware
- 5.2.1 Tracking devices
- 5.2.2 Telematics devices
- 5.2.3 Sensors
- 5.2.4 Remote diagnostics
- 5.2.5 Communication devices
- 5.2.6 Others
- 5.3 Software
- 5.3.1 Vehicle tracking
- 5.3.2 Route optimization
- 5.3.3 Compliance & reporting
- 5.3.4 Others
- 5.4 Services
- 5.4.1 Professional services
- 5.4.1.1 Consulting & integration
- 5.4.1.2 Customization
- 5.4.1.3 System deployment
- 5.4.2 Managed services
- 5.4.2.1 Remote monitoring
- 5.4.2.2 Support & maintenance
- 5.4.1 Professional services
Chapter 6 Market Estimates & Forecast, By Connectivity Technology, 2022 - 2035 ($Mn)
- 6.1 Key trends
- 6.2 Short-range communication
- 6.3 Long-range communication
- 6.4 Hybrid
Chapter 7 Market Estimates & Forecast, By Transport Mode, 2022 - 2035 ($Mn)
- 7.1 Key trends
- 7.2 Roadways
- 7.3 Marine
- 7.4 Airways
- 7.5 Railways
Chapter 8 Market Estimates & Forecast, By End Use Industry, 2022 - 2035 ($Mn)
- 8.1 Key trends
- 8.2 Transportation & logistics
- 8.3 Retail & e-commerce
- 8.4 Healthcare & emergency services
- 8.5 Oil & gas
- 8.6 Construction & mining
- 8.7 Field services
- 8.8 Government & public sector
- 8.9 Others
Chapter 9 Market Estimates & Forecast, By Region, 2022 - 2035 ($Mn)
- 9.1 Key trends
- 9.2 North America
- 9.2.1 US
- 9.2.2 Canada
- 9.3 Europe
- 9.3.1 Germany
- 9.3.2 UK
- 9.3.3 France
- 9.3.4 Italy
- 9.3.5 Spain
- 9.3.6 Nordics
- 9.3.7 Russia
- 9.3.8 Poland
- 9.3.9 Romania
- 9.4 Asia Pacific
- 9.4.1 China
- 9.4.2 India
- 9.4.3 Japan
- 9.4.4 South Korea
- 9.4.5 ANZ
- 9.4.6 Vietnam
- 9.4.7 Indonesia
- 9.4.8 Philippines
- 9.5 Latin America
- 9.5.1 Brazil
- 9.5.2 Mexico
- 9.5.3 Argentina
- 9.6 MEA
- 9.6.1 South Africa
- 9.6.2 Saudi Arabia
- 9.6.3 UAE
Chapter 10 Company Profiles
- 10.1 Global companies
- 10.1.1 Cisco Systems
- 10.1.2 Continental
- 10.1.3 Denso
- 10.1.4 General Motors
- 10.1.5 IBM
- 10.1.6 Infineon Technologies
- 10.1.7 Magellan and Trimble Navigation
- 10.1.8 Robert Bosch
- 10.1.9 Siemens
- 10.1.10 Zonar Systems
- 10.2 Regional players
- 10.2.1 MiX Telematics
- 10.2.2 Samsara
- 10.2.3 Teletrac Navman
- 10.2.4 Omnitracs
- 10.2.5 Fleet Complete
- 10.2.6 Hitachi
- 10.2.7 Powerfleet
- 10.2.8 Gurtam (Wialon)
- 10.3 Emerging players
- 10.3.1 Azuga
- 10.3.2 CalAmp
- 10.3.3 Noregon
- 10.3.4 Zubie
