
|
시장보고서
상품코드
2019024
석유 및 가스용 여과 시스템 시장 기회, 성장 촉진요인, 업계 동향 분석 및 예측(2026-2035년)Oil and Gas Filtration System Market Opportunity, Growth Drivers, Industry Trend Analysis, and Forecast 2026 - 2035 |
||||||
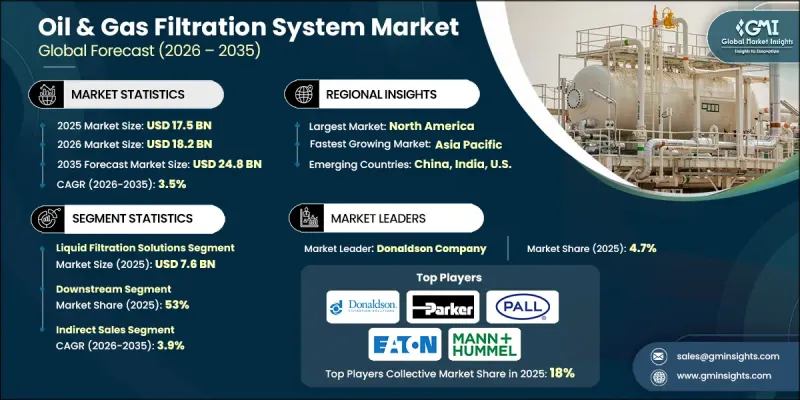
세계의 석유 및 가스용 여과 시스템 시장은 2025년에 175억 달러로 평가되었으며, CAGR 3.5%로 성장하여 2035년까지 248억 달러에 달할 것으로 추정됩니다.

석유 및 가스용 여과 시스템 산업의 성장은 엄격한 환경 기준을 충족시키면서 운영 효율성을 향상시키는 고성능 여과 솔루션에 대한 수요 증가에 힘입어 성장하고 있습니다. 특히 복잡하고 자원 집약적인 매장지에서의 탐사 및 생산 활동의 확대는 고급 여과 기술에 대한 지속적인 수요를 창출하고 있습니다. 동시에 배출 규제 및 환경 규정 준수와 관련된 규제 압력으로 인해 업계 관계자들은 보다 효율적이고 신뢰할 수 있는 시스템을 도입해야 하는 상황에 직면해 있습니다. 여과 공정에 첨단 소재와 자동화 기술의 통합을 포함한 지속적인 기술 발전으로 시스템의 성능과 내구성이 향상되고 있으며, 이러한 솔루션은 다양한 응용 분야에서 더욱 매력적인 솔루션이 되었습니다. 또한, 지속가능성과 에너지 효율에 대한 관심이 높아지면서 진화하는 산업 요구사항에 따라 차세대 여과 시스템 개발이 가속화되고 있습니다. 업스트림, 미드스티림, 다운스트림 각 사업의 투자 수준이 견조한 가운데, 석유 및 가스용 여과 시스템 시장은 예측 기간 동안 안정적인 성장 궤도를 유지할 것으로 예상됩니다.
| 시장 범위 | |
|---|---|
| 시작 연도 | 2025년 |
| 예측 기간 | 2026-2035년 |
| 시작 시점 시장 규모 | 175억 달러 |
| 예측 규모 | 248억 달러 |
| CAGR | 3.5% |
액체 여과 솔루션 부문은 2025년 76억 달러의 시장 규모를 기록했으며, 2026년부터 2035년까지 CAGR 3.8%로 성장할 것으로 예상됩니다. 이 부문은 석유 및 가스 사업에서 유체 흐름에서 오염물질을 제거하는 데 있어 매우 중요한 역할을 하며, 시스템의 효율성과 제품 품질을 보장하기 위해 주목받고 있습니다. 사업자들이 분리 성능 향상과 운영 신뢰성을 우선시하는 가운데, 보다 진보된 여과 기술의 채택은 이 부문의 확장을 더욱 촉진하고 있습니다.
다운스트림 부문은 2025년 53%의 점유율을 차지했으며, 2026년부터 2035년까지 CAGR 3.2%로 성장할 것으로 예상됩니다. 이 부문의 성장은 정제 제품에 대한 수요 증가와 효율적인 처리 시스템에 대한 요구가 뒷받침하고 있습니다. 여과 솔루션은 정제 효율 향상, 장비 마모 감소, 환경 및 운영 기준 준수에 필수적인 역할을 수행하여 다운스트림 활동에서 그 중요성이 더욱 커지고 있습니다.
미국의 석유 및 가스용 여과 시스템 시장은 2025년 76%의 점유율을 차지하며 47억 달러의 시장 규모를 기록했습니다. 이 나라의 시장 확대는 탐사 및 생산 기술의 지속적인 발전과 함께 석유 및 가스 가치사슬 전반의 운영 효율성 향상을 위한 지속적인 투자에 의해 뒷받침되고 있습니다. 채굴 및 처리 능력의 지속적인 개발은 이 지역의 고급 여과 시스템에 대한 수요를 더욱 촉진하고 있습니다.
자주 묻는 질문
목차
제1장 조사 방법과 범위
제2장 주요 요약
제3장 업계 인사이트
제4장 경쟁 구도
제5장 시장 추정 및 예측 : 여과 시스템 종류별, 2022-2035
제6장 시장 추정 및 예측 : 석유 및 가스 사업별, 2022-2035
제7장 시장 추정 및 예측 : 최종사용자별, 2022-2035
제8장 시장 추정 및 예측 : 유통 채널별, 2022-2035
제9장 시장 추정 및 예측 : 지역별, 2022-2035
제10장 기업 개요
KSM 26.05.06The Global Oil & Gas Filtration System Market was valued at USD 17.5 billion in 2025 and is estimated to grow at a CAGR of 3.5% to reach USD 24.8 billion by 2035.
Growth in the oil & gas filtration system industry is driven by the rising need for high-performance filtration solutions that enhance operational efficiency while meeting strict environmental standards. Expanding exploration and production activities, particularly in complex and resource-intensive reserves, are creating consistent demand for advanced filtration technologies. At the same time, regulatory pressure related to emissions control and environmental compliance is compelling industry participants to adopt more efficient and reliable systems. Continuous technological progress, including the integration of advanced materials and automation in filtration processes, is improving system performance and durability, making these solutions more attractive across various applications. Increasing attention toward sustainability and energy efficiency is also encouraging the development of next-generation filtration systems that align with evolving industry requirements. As investment levels remain strong across upstream, midstream, and downstream operations, the oil & gas filtration system market is expected to maintain a stable growth trajectory over the forecast period.
| Market Scope | |
|---|---|
| Start Year | 2025 |
| Forecast Year | 2026-2035 |
| Start Value | $17.5 Billion |
| Forecast Value | $24.8 Billion |
| CAGR | 3.5% |
The liquid filtration solutions segment generated USD 7.6 billion in 2025 and is anticipated to grow at a CAGR of 3.8% throughout 2026-2035. This segment is gaining traction due to its critical role in removing contaminants from liquid streams during oil and gas operations, ensuring system efficiency and product quality. The adoption of more advanced filtration technologies is further supporting segment expansion, as operators prioritize improved separation performance and operational reliability.
The downstream segment accounted for 53% share in 2025 and is expected to grow at a CAGR of 3.2% from 2026 to 2035. Growth in this segment is supported by increasing demand for refined products and the need for efficient processing systems. Filtration solutions play an essential role in enhancing refining efficiency, reducing equipment wear, and ensuring compliance with environmental and operational standards, thereby strengthening their importance in downstream activities.
United States Oil & Gas Filtration System Market held a 76% share, generating USD 4.7 billion in 2025. Market expansion in the country is supported by ongoing advancements in exploration and production technologies, along with sustained investments in improving operational efficiency across the oil and gas value chain. Continuous development of extraction and processing capabilities is further reinforcing demand for advanced filtration systems in the region.
Key players operating in the Global Oil & Gas Filtration System Market include Andritz, Donaldson Company, Eaton, Freudenberg, High Purity Northwest, Honeywell, HYDAC, John Crane, Jonell Systems, Mann+Hummel, MMP Filter, Pall Corporation, Parker Hannifin, Pentair, and Walker Filtration. Companies in the Global Oil & Gas Filtration System Market are focusing on enhancing product innovation through advanced materials and automation technologies to improve efficiency and durability. They are investing in research and development to introduce high-performance filtration solutions that meet evolving regulatory and operational requirements. Strategic partnerships and collaborations are being pursued to expand technological capabilities and global reach. Firms are also strengthening their distribution networks and service offerings to improve customer engagement and after-sales support. Additionally, companies are emphasizing sustainability by developing energy-efficient and environmentally compliant systems, while pursuing geographic expansion and competitive pricing strategies to capture a broader customer base and reinforce their market position.
Table of Contents
Chapter 1 Methodology and scope
- 1.1 Research approach
- 1.2 Quality Commitments
- 1.2.1 GMI AI policy & data integrity commitment
- 1.2.1.1 Source consistency protocol
- 1.2.1 GMI AI policy & data integrity commitment
- 1.3 Research Trail & Confidence Scoring
- 1.3.1 Research Trail Components
- 1.3.2 Scoring Components
- 1.4 Data Collection
- 1.4.1 Partial list of primary sources
- 1.5 Data mining sources
- 1.5.1 Paid sources
- 1.5.1.1 Sources, by region
- 1.5.1 Paid sources
- 1.6 Base estimates and calculations
- 1.6.1 Base year calculation for any one approach
- 1.7 Forecast model
- 1.7.1 Quantified market impact analysis
- 1.7.1.1 Mathematical impact of growth parameters on forecast
- 1.7.1 Quantified market impact analysis
- 1.8 Research transparency addendum
- 1.8.1 Source attribution framework
- 1.8.2 Quality assurance metrics
- 1.8.3 Our commitment to trust
Chapter 2 Executive summary
- 2.1 Industry 360° synopsis
- 2.2 Key market trends
- 2.2.1 Regional
- 2.2.2 Filtration system type
- 2.2.3 Oil & gas operation
- 2.2.4 End users
- 2.2.5 Distribution channel
Chapter 3 Industry insights
- 3.1 Industry ecosystem analysis
- 3.1.1 Supplier landscape
- 3.1.2 Profit margin
- 3.1.3 Value addition at each stage
- 3.1.4 Factor affecting the value chain
- 3.2 Industry impact forces
- 3.2.1 Growth drivers
- 3.2.2 Industry pitfalls & challenges
- 3.2.3 Opportunities
- 3.3 Growth potential analysis
- 3.4 Future market trends
- 3.5 Technology and innovation landscape
- 3.5.1 Current technological trends
- 3.5.2 Emerging technologies
- 3.6 Pricing analysis (Driven by Primary Research)
- 3.6.1 Historical price trend analysis (Driven by Primary Research)
- 3.6.2 Pricing strategy by player type (premium / value / cost-plus) (Driven by Primary Research)
- 3.7 Regulatory landscape
- 3.7.1 Standards and compliance requirements
- 3.7.2 Regional regulatory frameworks
- 3.7.3 Certification standards
- 3.8 Trade data analysis (Driven by Primary Research)
- 3.8.1 Import/export volume & value trends (Driven by Primary Research)
- 3.8.2 Key trade corridors & tariff impact (Driven by Primary Research)
- 3.8.3 Regional trade balance & dependency analysis
- 3.9 Impact of AI & generative ai on the market
- 3.9.1 AI-driven disruption of traditional business models
- 3.9.2 GenAI use cases & adoption roadmap by customer segment
- 3.9.3 Risks, limitations & regulatory considerations
- 3.9.4 AI-enabled smart home ecosystem integration
- 3.10 Capacity & production landscape (Driven by Primary Research)
- 3.10.1 Installed capacity by region & key producer (Driven by Primary Research)
- 3.10.2 Capacity utilization rates & expansion pipelines (Driven by Primary Research)
- 3.10.3 Manufacturing facility footprint & regional concentration
- 3.11 Porter's analysis
- 3.12 PESTEL analysis
Chapter 4 Competitive landscape, 2025
- 4.1 Introduction
- 4.2 Company market share analysis
- 4.2.1 North America
- 4.2.2 Europe
- 4.2.3 Asia Pacific
- 4.2.4 Latin America
- 4.2.5 MEA
- 4.3 Company matrix analysis
- 4.4 Competitive analysis of major market players
- 4.5 Competitive positioning matrix
- 4.6 Key developments
- 4.6.1 Mergers & acquisitions
- 4.6.2 Partnerships & collaborations
- 4.6.3 New product launches
- 4.6.4 Expansion plans
Chapter 5 Market Estimates & Forecast, By Filtration System Type, 2022 - 2035 ($Billion, Thousand Units)
- 5.1 Key trends
- 5.2 Air filtration solutions
- 5.2.1 Engine air intake filters
- 5.2.2 Turbine inlet air filtration
- 5.2.3 Compressor air intake
- 5.2.4 Dust collection systems
- 5.2.5 HVAC/control room filtration
- 5.3 Liquid filtration solutions
- 5.3.1 Fuel filtration
- 5.3.1.1 Diesel fuel filters
- 5.3.1.2 Gasoline/aviation fuel filters
- 5.3.1.3 Biodiesel/alternative fuels
- 5.3.1.4 Bulk fuel systems
- 5.3.2 Lube oil filtration
- 5.3.2.1 Engine lube filters
- 5.3.2.2 Turbine lube systems
- 5.3.2.3 Offline/kidney loop systems
- 5.3.3 Coolant filtration
- 5.3.4 Process liquid filtration
- 5.3.1 Fuel filtration
- 5.4 Hydraulic filtration solutions
- 5.4.1 Pressure line filters
- 5.4.2 Return line filters
- 5.4.3 Suction filters/strainers
- 5.4.4 Offline filtration systems
- 5.4.5 Mobile hydraulic carts
- 5.5 Gas processing filtration solutions
- 5.5.1 Gas/liquid coalescers
- 5.5.2 Gas/solid separators
- 5.5.3 Natural gas pipeline filtration
- 5.5.4 Mercury removal unit (MRU) filters
- 5.5.5 Glycol dehydration filters
- 5.5.6 LNG filtration systems
Chapter 6 Market Estimates & Forecast, By Oil & Gas Operation, 2022 - 2035 ($Billion, Thousand Units)
- 6.1 Key trends
- 6.2 Upstream operations
- 6.3 Midstream operations
- 6.4 Downstream operation
Chapter 7 Market Estimates & Forecast, By End User, 2022 - 2035 ($Billion, Thousand Units)
- 7.1 Key trends
- 7.2 Integrated oil & gas companies
- 7.3 Independent exploration and production companies
- 7.4 Oilfield services companies
- 7.5 Midstream operators
- 7.6 Refiners & petrochemical producers
Chapter 8 Market Estimates & Forecast, By Distribution Channel, 2022 - 2035 ($Billion, Thousand Units)
- 8.1 Key trends
- 8.2 Direct sales
- 8.3 Indirect sales
Chapter 9 Market Estimates & Forecast, By Region, 2022 - 2035 ($Billion, Thousand Units)
- 9.1 Key trends
- 9.2 North America
- 9.2.1 U.S.
- 9.2.2 Canada
- 9.3 Europe
- 9.3.1 Germany
- 9.3.2 UK
- 9.3.3 France
- 9.3.4 Spain
- 9.3.5 Italy
- 9.3.6 Netherlands
- 9.4 Asia Pacific
- 9.4.1 China
- 9.4.2 Japan
- 9.4.3 India
- 9.4.4 Australia
- 9.4.5 South Korea
- 9.5 Latin America
- 9.5.1 Brazil
- 9.5.2 Mexico
- 9.5.3 Argentina
- 9.6 MEA
- 9.6.1 South Africa
- 9.6.2 Saudi Arabia
- 9.6.3 UAE
Chapter 10 Company Profiles
- 10.1 Andritz
- 10.2 Donaldson Company
- 10.3 Eaton
- 10.4 Freudenberg
- 10.5 High Purity Northwest
- 10.6 Honeywell
- 10.7 HYDAC
- 10.8 John Crane
- 10.9 Jonell Systems
- 10.10 Mann+Hummel
- 10.11 MMP Filter
- 10.12 Pall Corporation
- 10.13 Parker Hannifin
- 10.14 Pentair
- 10.15 Walker Filtration

