
|
시장보고서
상품코드
2019137
차량용 디스플레이 시장 기회, 성장요인, 업계 동향 분석 및 예측(2026-2035년)Automotive Display Market Opportunity, Growth Drivers, Industry Trend Analysis, and Forecast 2026 - 2035 |
||||||
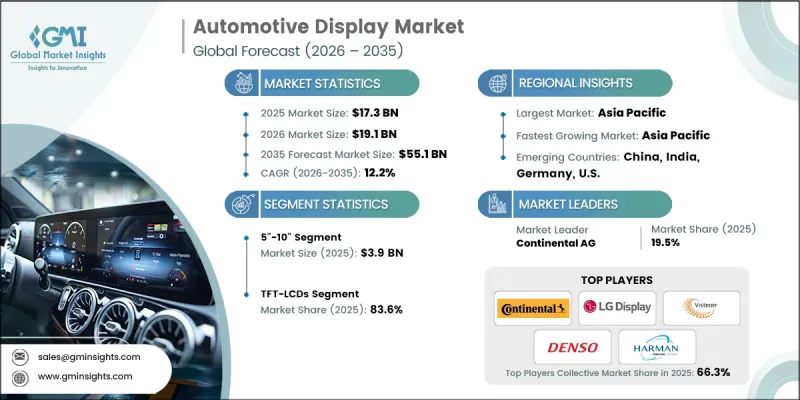
세계의 차량용 디스플레이 시장은 2025년에 173억 달러로 평가되었고, 2035년까지 연평균 복합 성장률(CAGR) 12.2%로 성장하여 551억 달러에 이를 것으로 추정되고 있습니다.
이 시장은 고해상도 계기판과 대형 센터 스택을 갖춘 완전 디지털 조종석으로의 전환에 의해 주도되고 있습니다. 소비자들은 인포테인먼트, 내비게이션, 커넥티비티에서 차량과 직관적으로 소통할 수 있는 방법을 점점 더 많이 요구하고 있으며, 이에 따라 OEM 업체들은 차량 내부에 여러 개의 디스플레이를 장착하고 있습니다. 자동차 제조업체들은 인공지능(AI), 증강현실(AR) 헤드업 디스플레이, 적응형 인터페이스를 통합하여 운전 경험을 개인화하면서 안전성을 높이고 있습니다. 이러한 지능형 디스플레이는 실시간 내비게이션, 첨단운전자보조시스템(ADAS) 분석 정보, 운전자 행동에 기반한 예측 컨텐츠를 제공하여 대시보드를 정적인 패널에서 인터랙티브한 허브로 탈바꿈시키고 있습니다. OLED, QLED, 곡면형, 울트라 와이드 등 하이엔드 디스플레이 기술에 대한 수요 증가는 특히 고급차 및 고성능 자동차에서 두드러지게 나타나고 있습니다. 또한, 각 제조업체들은 지속가능성과 에너지 효율을 중시하고 있으며, 뛰어난 시각적 성능을 제공하면서도 전력 소비를 줄이기 위해 소재와 디스플레이 패널의 혁신을 추진하고 있습니다.
| 시장 범위 | |
|---|---|
| 개시 연도 | 2025년 |
| 예측 기간 | 2026-2035년 |
| 개시 연도 시장 규모 | 173억 달러 |
| 예측액 | 551억 달러 |
| CAGR | 12.2% |
5-10인치 디스플레이 부문은 2025년 39억 달러에 달할 것으로 예측됩니다. 이 사이즈는 승용차 및 상용차에서 가장 널리 사용되고 있으며, 계기판, 인포테인먼트 화면, 센터 대시보드에서 뛰어난 시인성, 기능성 및 통합성을 제공합니다. 이 부문의 우위는 OEM의 광범위한 채택을 반영하며, 차량용 용도에서 선명도, 사용 편의성 및 비용 효율성의 균형을 제공합니다.
OLED 디스플레이 부문은 2035년까지 연평균 복합 성장률(CAGR) 15.1%를 나타낼 것으로 예측됩니다. 이러한 성장은 소비자들이 고명암비, 유연성, 곡면 디스플레이를 원하고, 프리미엄 자동차 및 전기자동차에 OLED 패널 채택이 증가하고 있기 때문입니다. 기술의 발전으로 밝은 색상의 에너지 절약형 패널을 구현하여 디지털 콕핏 및 인포테인먼트 시스템에 적합하며, 가볍고 유연한 대시보드 설계를 지원합니다.
2025년 기준 북미 자동차 디스플레이 시장은 20.9%의 점유율을 차지했습니다. 이 지역은 전기차 및 커넥티드카의 사용자 경험을 향상시키기 위해 설계된 다양한 디지털 콕핏 시스템, 인포테인먼트 솔루션, 첨단 차량 계기판 클러스터의 통합이 진행되고 있으며, 그 혜택을 누리고 있습니다. 지역 내 강력한 입지와 기술적 전문성을 갖춘 OEM 업체들이 대형 및 고해상도 디스플레이의 채택을 주도하고 있습니다. 개인화된 인터랙티브 인터페이스에 대한 소비자 선호도가 높아짐에 따라 미국 및 캐나다 전역에서 지속적인 성장이 예상됩니다.
자주 묻는 질문
목차
제1장 조사 방법과 범위
제2장 주요 요약
제3장 업계 인사이트
제4장 경쟁 구도
제5장 시장 추산 및 예측 : 기술별, 2022-2035
제6장 시장 추산 및 예측 : 디스플레이 유형별, 2022-2035
제7장 시장 추산 및 예측 : 화면 사이즈별, 2022-2035
제8장 시장 추산 및 예측 : 차종별, 2022-2035
제9장 시장 추산 및 예측 : 지역별, 2022-2035
제10장 기업 개요
LSH 26.05.08The Global Automotive Display Market was valued at USD 17.3 billion in 2025 and is estimated to grow at a CAGR of 12.2% to reach USD 55.1 billion by 2035.

The market is driven by the shift toward fully digital cockpits that feature high-resolution instrument clusters and large center stacks. Consumers are increasingly seeking intuitive ways to interact with vehicles for infotainment, navigation, and connectivity, prompting OEMs to install multiple displays across vehicle interiors. Automakers are integrating artificial intelligence, augmented reality (AR) head-up displays, and adaptive interfaces to personalize the driving experience while enhancing safety. These intelligent displays provide real-time navigation, ADAS insights, and predictive content based on driver behavior, transforming dashboards from static panels into interactive hubs. Growing demand for high-end display technologies, including OLED, QLED, curved, and ultra-wide formats, is particularly strong in luxury and performance vehicles. Manufacturers are also emphasizing sustainability and energy efficiency, driving innovation in materials and display panels to reduce power consumption while delivering superior visual performance.
| Market Scope | |
|---|---|
| Start Year | 2025 |
| Forecast Year | 2026-2035 |
| Start Value | $17.3 Billion |
| Forecast Value | $55.1 Billion |
| CAGR | 12.2% |
The 5"-10" display segment reached USD 3.9 billion in 2025. These sizes remain the most widely deployed across passenger and commercial vehicles, offering excellent visibility, functionality, and integration in instrument clusters, infotainment screens, and center dashboards. The segment's dominance reflects widespread OEM adoption, providing a balance of clarity, usability, and cost-effectiveness for in-vehicle applications.
The OLED display segment is expected to grow at a CAGR of 15.1% through 2035. The growth is driven by the increasing incorporation of OLED panels in premium and electric vehicles, as consumers demand high-contrast, flexible, and curved displays. Technological advancements have enabled energy-efficient panels with vibrant colors, making them ideal for digital cockpits and infotainment systems, while also supporting lightweight and flexible dashboard designs.
North America Automotive Display Market accounted for 20.9% share in 2025. The region is benefiting from the integration of multiple digital cockpit systems, infotainment solutions, and advanced vehicle instrument clusters designed to enhance the user experience in electric and connected vehicles. OEMs with strong regional presence and technological expertise are driving the adoption of larger, higher-resolution displays. Increasing consumer preference for personalized, interactive interfaces is expected to sustain growth across the U.S. and Canada.
Key players in the Global Automotive Display Market include Blaupunkt, Continental AG, Denso Corporation, HARMAN International, Hyundai Mobis, LG DISPLAY CO., LTD., Magneti Marelli, Mitsubishi Electric, MTA S.p.A., New Vision Display (Shenzhen) Co., Ltd., Nippon Seiki Co., Ltd., Nuline Technologies, Panasonic Automotive Systems, Pricol Ltd., Robert Bosch GmbH, SHARP, Visteon Corporation, and YAZAKI Corporation. Companies in the automotive display market are strengthening their position through continuous innovation in display technologies, including OLED, QLED, and ultra-wide formats. They are investing in R&D to improve resolution, contrast, energy efficiency, and integration with AR and AI-enabled vehicle systems. Strategic partnerships with OEMs and technology providers allow them to embed displays into connected and electric vehicles while expanding global distribution networks. Businesses are also focusing on customization, offering flexible, modular, and adaptive display solutions tailored to regional consumer preferences. Marketing, after-sales support, and software upgrades further enhance user experience and long-term adoption, enabling these companies to maintain a competitive advantage and capture a larger market share.
Table of Contents
Chapter 1 Methodology and Scope
- 1.1 Market scope and definition
- 1.2 Research design
- 1.2.1 Research approach
- 1.2.2 Data collection methods
- 1.3 Data mining sources
- 1.3.1 Global
- 1.3.2 Regional/Country
- 1.4 Base estimates and calculations
- 1.4.1 Base year calculation
- 1.4.2 Key trends for market estimation
- 1.5 Primary research and validation
- 1.5.1 Primary sources
- 1.6 Forecast model
- 1.7 Research assumptions and limitations
Chapter 2 Executive Summary
- 2.1 Industry 360° synopsis, 2022 - 2035
- 2.2 Key market trends
- 2.2.1 Technology trends
- 2.2.2 Display type trends
- 2.2.3 Screen Size trends
- 2.2.4 Vehicle type trends
- 2.2.5 Technology trends
- 2.2.6 Regional trends
- 2.3 TAM Analysis, 2026-2035
- 2.4 CXO perspectives: Strategic imperatives
Chapter 3 Industry Insights
- 3.1 Industry ecosystem analysis
- 3.1.1 Supplier Landscape
- 3.1.2 Profit Margin
- 3.1.3 Cost structure
- 3.1.4 Value addition at each stage
- 3.1.5 Factor affecting the value chain
- 3.1.6 Disruptions
- 3.2 Industry impact forces
- 3.2.1 Growth drivers
- 3.2.1.1 The rise of electric vehicles industry
- 3.2.1.2 Incorporation of ADAS in automotive
- 3.2.1.3 Growing demand for connected vehicles
- 3.2.1.4 Consumers preference towards larger display
- 3.2.1.5 Rising demand for in-car infotainment systems
- 3.2.2 Industry pitfalls and challenges
- 3.2.2.1 Threats of cyberattacks and data breaching
- 3.2.2.2 Semiconductor shortage affects production
- 3.2.3 Market opportunities
- 3.2.3.1 Expansion of OLED and advanced display adoption
- 3.2.3.2 Integration of AR/VR and heads-up displays
- 3.2.1 Growth drivers
- 3.3 Growth potential analysis
- 3.4 Regulatory landscape
- 3.4.1 North America
- 3.4.2 Europe
- 3.4.3 Asia Pacific
- 3.4.4 Latin America
- 3.4.5 Middle East & Africa
- 3.5 Porter's analysis
- 3.6 PESTEL analysis
- 3.7 Price trends (Driven by Primary Research)
- 3.7.1 Historical Price Analysis (2023-2026)
- 3.7.2 Price Trend Drivers
- 3.7.3 Regional Price Variations
- 3.7.4 Price Forecast (2027-2036)
- 3.8 Pricing Strategies (Driven by Primary Research)
- 3.8.1 Emerging Business Models
- 3.9 Trade Data Analysis (Driven by Primary Research)
- 3.9.1 Import/Export Value Trends
- 3.9.2 Key Trade Corridors & Tariff Impact
- 3.10 Impact of AI & Generative AI on the Market
- 3.10.1 AI-Driven Disruption of Existing Business Models
- 3.10.2 GenAI Use Cases & Adoption Roadmap by Segment
- 3.10.3 Risks, Limitations & Regulatory Considerations
- 3.11 Capacity & Production Landscape (Driven by Primary Research)
- 3.11.1 Installed Capacity by Region & Key Producer
- 3.11.2 Capacity Utilization Rates & Expansion Pipelines
Chapter 4 Competitive Landscape, 2025
- 4.1 Introduction
- 4.2 Company market share analysis
- 4.2.1 By region
- 4.2.1.1 North America
- 4.2.1.2 Europe
- 4.2.1.3 Asia Pacific
- 4.2.1.4 Latin America
- 4.2.1.5 Middle East & Africa
- 4.2.2 Market concentration analysis
- 4.2.1 By region
- 4.3 Competitive benchmarking of key players
- 4.3.1 Financial performance comparison
- 4.3.1.1 Revenue
- 4.3.1.2 Profit margin
- 4.3.1.3 R&D
- 4.3.2 Product portfolio comparison
- 4.3.2.1 Product range breadth
- 4.3.2.2 Technology
- 4.3.2.3 Innovation
- 4.3.3 Geographic presence comparison
- 4.3.3.1 Global footprint analysis
- 4.3.3.2 Service network coverage
- 4.3.3.3 Market penetration by region
- 4.3.4 Competitive positioning matrix
- 4.3.4.1 Leaders
- 4.3.4.2 Challengers
- 4.3.4.3 Followers
- 4.3.4.4 Niche players
- 4.3.5 Strategic outlook matrix
- 4.3.1 Financial performance comparison
- 4.4 Key developments
- 4.4.1 Mergers and acquisitions
- 4.4.2 Partnerships and collaborations
- 4.4.3 Technological advancements
- 4.4.4 Expansion and investment strategies
- 4.4.5 Digital transformation initiatives
- 4.5 Emerging/ startup competitors landscape
Chapter 5 Market Estimates and Forecast, By Technology, 2022 - 2035 (USD Million & Units)
- 5.1 Key trends
- 5.2 TFT-LCDs
- 5.3 OLEDs
Chapter 6 Market Estimates and Forecast, By Display Type, 2022 - 2035 (USD Million & Units)
- 6.1 Key trends
- 6.2 Center Stack Displays
- 6.3 Instrument Cluster Displays
- 6.3.1 Digital instrument panels
- 6.3.2 Driver information displays
- 6.3.3 Speedometer/tachometer screens
- 6.3.4 Others
- 6.4 Rear-seat Entertainment Displays
- 6.5 Head-Up Displays (HUD)
- 6.6 Others
Chapter 7 Market Estimates and Forecast, By Screen Size, 2022 - 2035 (USD Million & Units)
- 7.1 Key trends
- 7.2 Less than 5"
- 7.3 5" to 10"
- 7.4 Above 10"
Chapter 8 Market Estimates and Forecast, By Vehicle Type, 2022 - 2035 (USD Million & Units)
- 8.1 Key trends
- 8.2 Passenger Cars
- 8.2.1 Hatchback
- 8.2.2 Sedan
- 8.2.3 Utility Vehicle
- 8.3 Commercial Vehicles
- 8.3.1 Light Commercial Vehicles (LCV)
- 8.3.2 Heavy Commercial Vehicles (HCV)
Chapter 9 Market Estimates and Forecast, By Region, 2022 - 2035 (USD Million & Units)
- 9.1 Key trends
- 9.2 North America
- 9.2.1 U.S.
- 9.2.2 Canada
- 9.3 Europe
- 9.3.1 Germany
- 9.3.2 UK
- 9.3.3 France
- 9.3.4 Spain
- 9.3.5 Italy
- 9.3.6 Russia
- 9.3.7 Rest of Europe
- 9.4 Asia Pacific
- 9.4.1 China
- 9.4.2 India
- 9.4.3 Japan
- 9.4.4 Australia
- 9.4.5 South Korea
- 9.4.6 Rest of Asia-Pacific
- 9.5 Latin America
- 9.5.1 Brazil
- 9.5.2 Mexico
- 9.5.3 Argentina
- 9.5.4 Rest of Latin America
- 9.6 Middle East and Africa
- 9.6.1 South Africa
- 9.6.2 Saudi Arabia
- 9.6.3 UAE
- 9.6.4 Rest of Middle East and Africa
Chapter 10 Company Profiles
- 10.1 Global Key Players
- 10.1.1 Continental AG
- 10.1.2 Denso Corporation
- 10.1.3 HARMAN International
- 10.1.4 LG DISPLAY CO., LTD.
- 10.1.5 Mitsubishi Electric
- 10.1.6 Panasonic Automotive Systems
- 10.1.7 Robert Bosch GmbH
- 10.1.8 Visteon Corporation
- 10.2 Regional key players
- 10.2.1 North America
- 10.2.1.1 ON Semiconductor (onsemi)
- 10.2.1.2 Littelfuse, Inc.
- 10.2.1.3 Powerex, Inc.
- 10.2.2 Asia Pacific
- 10.2.2.1 Hyundai Mobis
- 10.2.2.2 Nippon Seiki Co., Ltd.
- 10.2.2.3 Pricol Ltd.
- 10.2.2.4 YAZAKI
- 10.2.2.5 SHARP
- 10.2.3 Europe
- 10.2.3.1 Magneti Marelli
- 10.2.1 North America
- 10.3 Niche Players/Disruptors
- 10.3.1 Blaupunkt
- 10.3.2 MTA S.p.A. (Italy)
- 10.3.3 New Vision Display (Shenzhen) Co, Ltd.
- 10.3.4 Nuline Technologies
