
|
시장보고서
상품코드
2019181
시안화나트륨 시장 비즈니스 기회, 성장요인, 업계 동향 분석 및 예측(2026-2035년)Sodium Cyanide Market Opportunity, Growth Drivers, Industry Trend Analysis, and Forecast 2026 - 2035 |
||||||
세계의 시안화나트륨 시장은 2025년에 28억 달러로 평가되었고, CAGR 5.6%로 성장하여 2035년까지 48억 달러에 이를 것으로 추정되고 있습니다.

이 시장의 확대는 시안화나트륨이 귀금속 추출에 시안화나트륨이 널리 사용되는 금과 은의 채굴 활동 증가에 의해 주도되고 있습니다. 진행 중인 탐사 프로젝트와 신규 광산 개발이 진행 중인 가운데, 아시아태평양, 아프리카, 라틴아메리카 수요가 특히 강세를 보이고 있습니다. 광산 회사들은 세계 금속 수요를 충족시키기 위해 생산을 확대하고 있으며, 이는 시안화나트륨의 소비를 직접적으로 증가시키고 있습니다. 시장 역학은 금 가격 변동과 귀금속에 대한 투자 확대의 영향을 받고 있습니다. 금 가격의 상승은 광산 업체들이 중단했던 작업을 재개하도록 동기를 부여하고, 수요를 더욱 견인하고 있습니다. 또한, 시안화 처리 및 광물 처리 기술의 발전으로 추출 효율이 향상되고 회수율이 높아졌으며, 저급 광석도 효과적으로 처리할 수 있게 되어 전체 시장 성장에 기여하고 있습니다. 이러한 요인들이 결합되어 시안화나트륨은 전 세계 광업 활동에서 필수적인 원료로 자리매김하고 있습니다.
| 시장 범위 | |
|---|---|
| 개시 연도 | 2025년 |
| 예측 기간 | 2026-2035년 |
| 개시 연도 시장 규모 | 28억 달러 |
| 예측액 | 48억 달러 |
| CAGR | 5.6% |
2025년 고체 시안화나트륨 부문은 20억 달러를 차지할 것으로 예상되며, 이는 산업 및 광업 응용 분야에서 선도적인 역할을 반영합니다. 수요는 가공 공정의 구체적인 요구와 효율성, 운송, 보관, 취급의 최적 형태에 따라 달라집니다. 광산 기업은 안전, 운영 비용 및 기존 가공 시스템과의 호환성을 기준으로 제품 유형을 선택합니다. 이러한 평가를 통해 다양한 광산 현장 및 화학 처리 용도에서 시안화나트륨을 효과적으로 사용할 수 있으며, 안정적인 공급과 운영의 신뢰성을 확보할 수 있습니다.
2025년, 직접 판매 채널은 16억 달러의 매출을 창출했으며, 산업 및 광업 고객에 대한 주요 공급 경로로 작용했습니다. 효율적인 유통은 조달량, 안전 기준 준수 및 위험물 취급 요건에 따라 달라집니다. 대규모 구매자는 안정적인 공급을 보장하고, 운영 중단을 최소화하고, 생산 일정을 유지하기 위해 체계적인 공급 계약과 조정된 배송 시스템에 의존하는 경우가 많습니다.
2025년 북미 시안화나트륨 시장은 5억 3,200만 달러를 차지했습니다. 이 지역 시장은 시안화나트륨이 힙리칭 및 기타 광물 처리 방법에 사용되는 금과 은의 지속적인 채굴 활동의 혜택을 누리고 있습니다. 미국은 대규모 광산 사업으로 가장 큰 점유율을 유지하고 있으며, 캐나다는 특히 광물자원의 잠재력이 높은 지역에서 확립된 광업을 통해 기여하고 있습니다. 이들 국가의 광산 생산량 증가는 시안화나트륨에 대한 지속적인 수요를 견인하고 있습니다.
자주 묻는 질문
목차
제1장 조사 방법과 범위
제2장 주요 요약
제3장 업계 인사이트
제4장 경쟁 구도
제5장 시장 추산 및 예측 : 형태별, 2022-2035
제6장 시장 추산 및 예측 : 용도별, 2022-2035
제7장 시장 추산 및 예측 : 유통 채널별, 2022-2035
제8장 시장 추산 및 예측 : 지역별, 2022-2035
제9장 기업 개요
LSH 26.05.08The Global Sodium Cyanide Market was valued at USD 2.8 billion in 2025 and is estimated to grow at a CAGR of 5.6% to reach USD 4.8 billion by 2035.
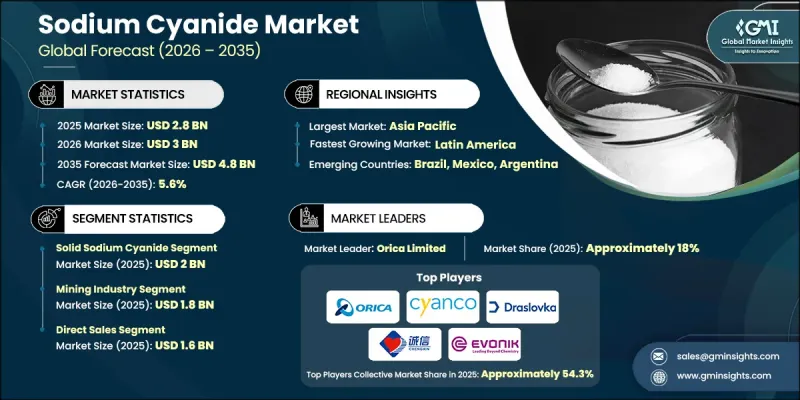
The market expansion is fueled by rising gold and silver mining activities, where sodium cyanide is extensively used for the extraction of precious metals. Demand is particularly strong across Asia Pacific, Africa, and Latin America as ongoing exploration projects and new mining sites are developed. Mining companies are increasing production to meet global metal requirements, which directly boosts sodium cyanide consumption. Market dynamics are influenced by fluctuations in gold prices and growing investment in precious metals. Higher gold valuations encourage mining companies to resume previously paused operations, driving further demand. Additionally, advancements in cyanidation and mineral processing technologies are enhancing extraction efficiency, increasing recovery rates, and enabling lower-grade ores to be processed effectively, contributing to overall market growth. These factors collectively position sodium cyanide as a critical input for global mining operations.
| Market Scope | |
|---|---|
| Start Year | 2025 |
| Forecast Year | 2026-2035 |
| Start Value | $2.8 Billion |
| Forecast Value | $4.8 Billion |
| CAGR | 5.6% |
The solid sodium cyanide segment accounted for USD 2 billion in 2025, reflecting its dominant role in industrial and mining applications. Demand varies according to the specific needs of processing operations and the preferred form for efficiency, transport, storage, and handling. Mining companies select product types based on safety considerations, operational costs, and compatibility with existing processing systems. These evaluations ensure that sodium cyanide can be used effectively across diverse mining sites and chemical processing applications, supporting consistent supply and operational reliability.
The direct sales channels generated USD 1.6 billion in 2025, serving as the primary conduit for industrial and mining customers. Efficient distribution relies on procurement volumes, safety compliance, and handling requirements for hazardous materials. Large-scale buyers often rely on structured supply agreements and coordinated delivery systems to ensure consistent availability, minimizing operational disruptions and maintaining production schedules.
North America Sodium Cyanide Market accounted for USD 532 million in 2025. The regional market benefits from ongoing gold and silver mining activities, where sodium cyanide is used for heap leaching and other mineral processing methods. The United States maintains the largest share due to significant mining operations, while Canada contributes through established mining industries, particularly in regions with high mineral potential. Increasing mining production in these countries drives continuous demand for sodium cyanide.
Key players in the Global Sodium Cyanide Market include Orica Limited, Draslovka Holdings a.s., Australian Gold Reagents Pty Ltd, CSBP Limited, Cyanco International LLC, Evonik Industries AG, Gujarat Alkalies and Chemicals Limited, Hindusthan Chemicals Company, Kanto Chemical Co., Inc, Shaanxi United Chemical Co., Ltd., Taekwang Industrial Co., Ltd, Tongsuh Petrochemical Corporation, Hebei Chengxin Co., Ltd., and Kishida Chemical Co., Ltd. Companies in the Global Sodium Cyanide Market are focusing on expanding production capacity, establishing strategic supply agreements, and diversifying regional presence to strengthen market foothold. They invest in technology to enhance production efficiency, improve safety standards, and optimize handling procedures. Strategic partnerships with mining operators and industrial consumers are used to secure long-term contracts and ensure consistent demand. Companies also emphasize regulatory compliance, quality assurance, and sustainable chemical management practices. Leveraging advanced logistics, warehousing solutions, and direct sales channels helps to improve delivery efficiency, reduce operational risk, and maintain a competitive advantage across global markets.
Table of Contents
Chapter 1 Methodology & Scope
- 1.1 Market scope and definition
- 1.2 Research design
- 1.2.1 Research approach
- 1.2.2 Data collection methods
- 1.3 Data mining sources
- 1.3.1 Global
- 1.3.2 Regional/Country
- 1.4 Base estimates and calculations
- 1.4.1 Base year calculation
- 1.4.2 Key trends for market estimation
- 1.5 Primary research and validation
- 1.5.1 Primary sources
- 1.6 Forecast model
- 1.7 Research assumptions and limitations
Chapter 2 Executive Summary
- 2.1 Industry 360° synopsis
- 2.2 Key market trends
- 2.2.1 Regional
- 2.2.2 Form
- 2.2.3 End Use Industry
- 2.2.4 Distribution Channel
- 2.3 TAM Analysis, 2026-2035
- 2.4 CXO perspectives: Strategic imperatives
- 2.4.1 Executive decision points
- 2.4.2 Critical success factors
- 2.5 Future Outlook and Strategic Recommendations
Chapter 3 Industry Insights
- 3.1 Industry ecosystem analysis
- 3.1.1 Supplier Landscape
- 3.1.2 Profit Margin
- 3.1.3 Value addition at each stage
- 3.1.4 Factor affecting the value chain
- 3.1.5 Disruptions
- 3.2 Industry impact forces
- 3.2.1 Growth drivers
- 3.2.1.1 Surge in gold & silver mining activities
- 3.2.1.2 Rising gold prices & investment demand
- 3.2.1.3 Technological advancements in cyanidation processes.
- 3.2.2 Industry pitfalls and challenges
- 3.2.2.1 Environmental concerns & catastrophic spill incidents
- 3.2.2.2 Stringent regulatory constraints & compliance costs.
- 3.2.3 Market opportunities
- 3.2.3.1 Growing mining activities in emerging economies
- 3.2.3.2 Advancements in safer cyanide handling technologies
- 3.2.1 Growth drivers
- 3.3 Growth potential analysis
- 3.4 Regulatory landscape
- 3.4.1 North America
- 3.4.2 Europe
- 3.4.3 Asia Pacific
- 3.4.4 Latin America
- 3.4.5 Middle East & Africa
- 3.5 Porter's analysis
- 3.6 PESTEL analysis
- 3.7 Price trends
- 3.7.1 By region
- 3.7.2 Product type
- 3.8 Future market trends
- 3.9 Technology and Innovation Landscape
- 3.9.1 Current technological trends
- 3.9.2 Emerging technologies
- 3.10 Patent Landscape
- 3.11 Trade statistics (HS code) (Note: the trade statistics will be provided for key countries only)
- 3.11.1 Major importing countries
- 3.11.2 Major exporting countries
- 3.12 Sustainability and environmental aspects
- 3.12.1 Sustainable practices
- 3.12.2 Waste reduction strategies
- 3.12.3 Energy efficiency in production
- 3.12.4 Eco-friendly initiatives
Chapter 4 Competitive Landscape, 2025
- 4.1 Introduction
- 4.2 Company market share analysis
- 4.2.1 By region
- 4.2.1.1 North America
- 4.2.1.2 Europe
- 4.2.1.3 Asia Pacific
- 4.2.1.4 LATAM
- 4.2.1.5 MEA
- 4.2.1 By region
- 4.3 Company matrix analysis
- 4.4 Competitive analysis of major market players
- 4.5 Competitive positioning matrix
- 4.6 Key developments
- 4.6.1 Mergers & acquisitions
- 4.6.2 Partnerships & collaborations
- 4.6.3 New product launches
- 4.6.4 Expansion plans
Chapter 5 Market Estimates and Forecast, By Form, 2022 - 2035 (USD Billion) (Tons)
- 5.1 Key trends
- 5.2 Solid sodium cyanide
- 5.2.1 Briquettes
- 5.2.2 Pellets
- 5.3 Liquid sodium cyanide
- 5.4 Powder
Chapter 6 Market Estimates and Forecast, By Application, 2022 - 2035 (USD Billion) (Tons)
- 6.1 Key trends
- 6.2 Mining industry
- 6.3 Chemical manufacturing
- 6.4 Jewelry manufacturing
- 6.5 Pharmaceuticals
- 6.6 Agriculture
- 6.7 Textiles
- 6.8 Others
Chapter 7 Market Estimates and Forecast, By Distribution Channel, 2022 - 2035 (USD Billion) (Tons)
- 7.1 Key trends
- 7.2 Direct sales
- 7.3 Distributors & wholesalers
- 7.4 Online sales
Chapter 8 Market Estimates and Forecast, By Region, 2022 - 2035 (USD Billion) (Tons)
- 8.1 Key trends
- 8.2 North America
- 8.2.1 U.S.
- 8.2.2 Canada
- 8.3 Europe
- 8.3.1 Germany
- 8.3.2 UK
- 8.3.3 France
- 8.3.4 Spain
- 8.3.5 Italy
- 8.3.6 Rest of Europe
- 8.4 Asia Pacific
- 8.4.1 China
- 8.4.2 India
- 8.4.3 Japan
- 8.4.4 Australia
- 8.4.5 South Korea
- 8.4.6 Rest of Asia Pacific
- 8.5 Latin America
- 8.5.1 Brazil
- 8.5.2 Mexico
- 8.5.3 Rest of Latin America
- 8.6 Middle East and Africa
- 8.6.1 Saudi Arabia
- 8.6.2 South Africa
- 8.6.3 UAE
- 8.6.4 Rest of Middle East and Africa
Chapter 9 Company Profiles
- 9.1 Australian Gold Reagents Pty Ltd
- 9.2 CSBP Limited
- 9.3 Cyanco International LLC
- 9.4 Draslovka Holdings a.s.
- 9.5 Evonik Industries AG
- 9.6 Gujarat Alkalies and Chemicals Limited
- 9.7 Hebei Chengxin Co., Ltd
- 9.8 Hindusthan Chemicals Company
- 9.9 Kanto Chemical Co., Inc
- 9.10 Kishida Chemical Co., Ltd.
- 9.11 Orica Limited
- 9.12 Shaanxi United Chemical Co., Ltd.
- 9.13 Taekwang Industrial Co., Ltd
- 9.14 Tongsuh Petrochemical Corporation
