
|
시장보고서
상품코드
2019198
OEM용 전동 드라이브 유닛 시장 기회, 성장요인, 업계 동향 분석 및 예측(2026-2035년)OEM Electric Drive Unit (EDU) Market Opportunity, Growth Drivers, Industry Trend Analysis, and Forecast 2026 - 2035 |
||||||
세계의 OEM용 전동 드라이브 유닛 시장은 2025년에 223억 달러로 평가되고 CAGR 20.4%로 확대하며, 2035년까지 1,396억 달러에 달할 것으로 예측됩니다.
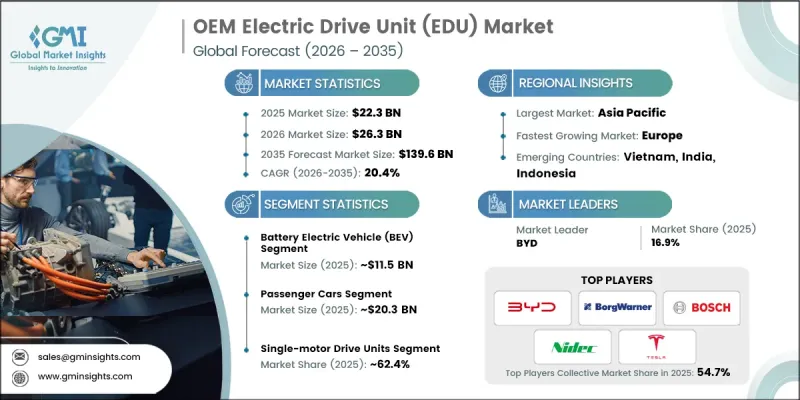
이러한 성장은 자동차의 전기화를 향한 세계적인 추세, 주요 자동차 제조업체의 투자 가속화, 배터리 기술의 지속적인 혁신에 의해 주도되고 있습니다. 세계 각국 정부는 엄격한 배출가스 규제를 도입하고 있으며, 많은 국가에서 내연기관차를 단계적으로 폐지하고 전기자동차로의 전환을 계획하고 있으며, 전기 구동장치에 대한 강력한 수요가 발생하고 있습니다. 리튬이온 배터리와 전고체 배터리의 효율 향상, 수명 연장, 비용 절감으로 전기자동차는 소비자들에게 더욱 매력적으로 다가오고 있으며, EDU의 채택이 더욱 확대되고 있습니다. 정부의 인센티브 프로그램, 보조금, 지원 정책도 시장 성장에 힘을 보태고 있습니다. 또한 OEM의 EDU에 대한 투자는 소비자의 의식 향상, 환경 문제에 대한 관심, 무공해 모빌리티 솔루션에 대한 니즈에 의해 영향을 받고 있습니다.
| 시장 범위 | |
|---|---|
| 시작연도 | 2025년 |
| 예측 기간 | 2026-2035년 |
| 개시 금액 | 223억 달러 |
| 예측액 | 1,396억 달러 |
| CAGR | 20.4% |
배터리식 전기자동차(BEV) 부문은 51.3%의 점유율을 차지하며 2025년에는 115억 달러의 시장 규모를 창출했습니다. BEV 부문의 우위는 엄격한 배출가스 규제, 자동차 OEM의 노력, 그리고 정부 인센티브에 힘입은 소비자 보급에 의해 주도되고 있습니다. 무공해차 의무화 및 높아지는 환경 의식으로 인해 제조업체들은 BEV 생산에 우선순위를 두고 있으며, 하이브리드나 연료전지차보다 고성능의 BEV에 대한 수요가 증가하고 있습니다.
승용차 부문은 2025년에 91%의 점유율을 차지하며 시장 규모는 203억 달러에 달했습니다. 이는 상용차에 비해 전기 승용차의 보급이 빠르게 진행되고 있음을 반영합니다. 다양한 모델 선택, 견고한 생산 규모, 충전 인프라 확충, 일관된 정책 프레임워크 등의 요인이 이 부문에서 지속적인 시장 주도권을 유지하고 있습니다.
미국의 OEM용 전동 구동 유닛(EDU) 시장은 2025년에 24억 달러에 달하며, 2026-2035년에 CAGR 16.5%로 성장할 것으로 예측됩니다. 연방 및 주정부의 EV 정책, 소비자 보급 추세, OEM의 전략이 수요를 견인하고 있습니다. '전국 전기자동차 인프라(NEVI) 포뮬러 프로그램'과 같은 시책은 전기자동차 충전 네트워크 구축을 지원하고 있으며, 주행거리에 대한 불안감을 줄여 간접적으로 EDU의 도입을 촉진하고 있습니다. 연방정부가 지원하는 충전소의 미국산 부품 사용 요건 변경을 포함한 정책 조정이 시장 생태계를 형성하고 있습니다.
자주 묻는 질문
목차
제1장 조사 방법
제2장 개요
제3장 업계 인사이트
제4장 경쟁 구도
제5장 시장 추산·예측 : 추진력별, 2022-2035년
제6장 시장 추산·예측 : 구동 유닛 구성별, 2022-2035년
제7장 시장 추산·예측 : 냉각 기술별, 2022-2035년
제8장 시장 추산·예측 : 차량별, 2022-2035년
제9장 시장 추산·예측 : 지역별, 2022-2035년
제10장 기업 개요
KSA 26.05.13The Global OEM Electric Drive Unit Market was valued at USD 22.3 billion in 2025 and is estimated to grow at a CAGR of 20.4% to reach USD 139.6 billion by 2035.

The growth is driven by the global shift toward vehicle electrification, accelerated investments by leading automakers, and continuous innovations in battery technology. Governments worldwide are implementing stringent emission standards, while many countries are planning to phase out internal combustion engine vehicles in favor of electric vehicles, creating strong demand for electric drive units. Improvements in lithium-ion and solid-state battery efficiency, longer life cycles, and reduced costs have made electric vehicles more appealing to consumers, further increasing the adoption of EDUs. Incentive programs, subsidies, and supportive policies from governments continue to boost market growth. OEM investments in EDUs are also influenced by increasing consumer awareness, environmental concerns, and the need for zero-emission mobility solutions.
| Market Scope | |
|---|---|
| Start Year | 2025 |
| Forecast Year | 2026-2035 |
| Start Value | $22.3 Billion |
| Forecast Value | $139.6 Billion |
| CAGR | 20.4% |
The battery electric vehicles (BEVs) segment held a 51.3% share, generating USD 11.5 billion in 2025. The BEV segment's dominance is driven by strict emission regulations, OEM commitments, and consumer adoption supported by government incentives. Zero-emission vehicle mandates and growing environmental consciousness are encouraging manufacturers to prioritize BEV production, driving demand for high-performance EDUs over hybrid and fuel cell variants.
The passenger car segment accounted for 91% share in 2025, valued at USD 20.3 billion, reflecting the faster adoption of electric passenger vehicles compared with commercial vehicles. Factors such as wider model availability, robust production scales, expanding charging infrastructure, and consistent policy frameworks support this segment's continued leadership in the market.
U.S. OEM Electric Drive Unit Market reached USD 2.4 billion in 2025 and is projected to grow at a CAGR of 16.5% from 2026 to 2035. Federal and state EV policies, consumer adoption trends, and OEM strategies drive demand. Programs like the National Electric Vehicle Infrastructure (NEVI) Formula Program are supporting the rollout of EV charging networks, indirectly facilitating EDU adoption by alleviating range anxiety. Policy adjustments, including changes to US-content requirements for federally funded charging stations, are shaping the market ecosystem.
Leading companies in the Global OEM Electric Drive Unit Market include Schaeffler, Valeo, BYD, Bosch, Tesla, BorgWarner, Vitesco Technologies, Aisin, Nidec, and ZF Friedrichshafen. Key strategies employed by companies in the OEM electric drive unit market include investing in R&D to develop high-efficiency, lightweight, and compact EDUs, collaborating with battery and EV manufacturers for integrated solutions, and expanding production capacities to meet growing global demand. Firms are establishing regional manufacturing hubs to reduce supply chain risks, forming strategic partnerships with automotive OEMs, and adopting advanced digital manufacturing technologies to enhance product quality and reliability. Companies are also focusing on cost reduction, modular platform development, and technology licensing to strengthen market presence. Marketing and after-sales support, along with participation in sustainability initiatives, help build brand credibility and customer trust, further reinforcing their foothold in the competitive market.
Table of Contents
Chapter 1 Methodology
- 1.1 Research approach
- 1.2 Quality Commitments
- 1.2.1 GMI AI policy & data integrity commitment
- 1.3 Research Trail & Confidence Scoring
- 1.3.1 Research Trail Components
- 1.3.2 Scoring Components
- 1.4 Data Collection
- 1.5 Data mining sources
- 1.5.1 Paid sources
- 1.6 Base estimates and calculations
- 1.6.1 Base year calculation for any one approach
- 1.7 Forecast
- 1.7.1 Quantified market impact analysis
- 1.8 Research transparency addendum
- 1.8.1 Source attribution framework
- 1.8.2 Quality assurance metrics
- 1.8.3 Our commitment to trust
Chapter 2 Executive Summary
- 2.1 Industry 360° synopsis
- 2.2 Key market trends
- 2.2.1 Regional
- 2.2.2 Propulsion
- 2.2.3 Drive Unit Configuration
- 2.2.4 Cooling Technology
- 2.2.5 Vehicle
- 2.3 TAM analysis, 2026-2035
- 2.4 CXO perspectives: Strategic imperatives
Chapter 3 Industry Insights
- 3.1 Industry ecosystem analysis
- 3.1.1 Supplier landscape
- 3.1.2 Profit margin
- 3.1.3 Cost structure
- 3.1.4 Value addition at each stage
- 3.1.5 Factor affecting the value chain
- 3.1.6 Disruptions
- 3.2 Industry impact forces
- 3.2.1 Growth drivers
- 3.2.1.1 Stringent emission regulations & zero-emission vehicle mandates
- 3.2.1.2 Increasing consumer demand for electric & hybrid vehicles
- 3.2.1.3 Government incentives & subsidies for EV adoption
- 3.2.1.4 Growing investment in EV infrastructure & charging networks
- 3.2.2 Industry pitfalls and challenges
- 3.2.2.1 High initial cost & capital intensity of EDU manufacturing
- 3.2.2.2 Range anxiety & infrastructure gaps in emerging markets
- 3.2.3 Market opportunities
- 3.2.3.1 Expansion into off-highway & industrial vehicle segments
- 3.2.3.2 Strategic partnerships between OEMs & Tier-1 suppliers
- 3.2.3.3 Development of modular & scalable EDU platforms
- 3.2.1 Growth drivers
- 3.3 Growth potential analysis
- 3.4 Regulatory landscape
- 3.4.1 North America
- 3.4.1.1 U.S. - Environmental Protection Agency (EPA)
- 3.4.1.2 Canada - Transportation Canada
- 3.4.2 Europe
- 3.4.2.1 Germany - VDA (German Association of the Automotive Industry)
- 3.4.2.2 Italy - Ministry of Infrastructure and Transport
- 3.4.3 Asia Pacific
- 3.4.3.1 China - China National Standardization Administration (SAC)
- 3.4.3.2 Japan - Japan Automobile Standards Internationalization Center (JASIC)
- 3.4.4 Latin America
- 3.4.4.1 Brazil - Instituto Nacional de Metrologia (INMETRO)
- 3.4.4.2 Mexico - Mexico’s Secretaria de Comunicaciones y Transportes (SCT)
- 3.4.5 Middle East & Africa
- 3.4.5.1 Saudi Arabia - Saudi Standards, Metrology and Quality Organization (SASO)
- 3.4.5.2 South Africa - South African Bureau of Standards (SABS)
- 3.4.1 North America
- 3.5 Porter's analysis
- 3.6 PESTEL analysis
- 3.7 Technology and innovation landscape
- 3.7.1 Current technologies
- 3.7.1.1 Permanent Magnet Synchronous Motors (PMSM)
- 3.7.1.2 Integrated Electric Drive Units (e-Axles)
- 3.7.1.3 400V Electrical Architecture Systems
- 3.7.1.4 Liquid Cooling Systems for Thermal Management
- 3.7.2 Emerging technologies
- 3.7.2.1 800V High-Voltage Electrical Architectures
- 3.7.2.2 Axial Flux Motors
- 3.7.2.3 Oil-Cooled and Direct Cooling Motor Technologies
- 3.7.1 Current technologies
- 3.8 Patent landscape (Driven by Primary Research)
- 3.9 Cost breakdown analysis
- 3.9.1 Raw material cost analysis
- 3.9.2 Manufacturing & assembly cost structure
- 3.9.3 Power electronics & semiconductor cost contribution
- 3.9.4 Logistics, supply chain, and overhead costs
- 3.10 Sustainability and environmental aspects
- 3.10.1 Sustainable practices
- 3.10.2 Waste reduction strategies
- 3.10.3 Energy efficiency in production
- 3.10.4 Eco-friendly Initiatives
- 3.10.5 Carbon footprint considerations
- 3.11 Trade Data Analysis (Driven by Paid Database)
- 3.11.1 Import/Export Volume & Value Trends
- 3.11.2 Key Trade Corridors & Tariff Impact
- 3.12 Capacity & Production Landscape (Driven by Primary Research)
- 3.12.1 Installed Capacity by Region & Key Producer
- 3.12.2 Capacity Utilization Rates & Expansion Pipelines
- 3.13 Integration with Advanced Vehicle Architectures
- 3.13.1 Integration with software-defined vehicle architectures
- 3.13.2 Compatibility with advanced driver assistance systems (ADAS)
- 3.13.3 Centralized vs distributed powertrain control systems
- 3.13.4 Integration with 400V vs 800V systems architecture
- 3.14 Electrification Roadmaps of Major Automotive OEMs
- 3.14.1 Transition timelines from ICE to full electrification
- 3.14.2 Investment strategies in EV platforms and technologies
- 3.14.3 Oem-specific approaches to EDU development and integration
- 3.14.4 Partnerships, joint ventures, and technology collaborations
- 3.14.5 Regional variations in electrification strategies
- 3.15 Impact of AI & Generative AI on the Market
- 3.15.1 AI-driven disruption of existing business models
- 3.15.2 GenAI use cases & adoption roadmap by segment
- 3.15.3 Risks, limitations & regulatory considerations
- 3.16 Forecast assumptions & scenario analysis (Driven by Primary Research)
- 3.16.1 Base Case - key macro & industry variables driving CAGR
- 3.16.2 Optimistic Scenarios - Favorable macro and industry tailwinds
- 3.16.3 Pessimistic Scenario - Macroeconomic slowdown or industry headwinds
Chapter 4 Competitive Landscape, 2025
- 4.1 Introduction
- 4.2 Company market share analysis
- 4.2.1 North America
- 4.2.2 Europe
- 4.2.3 Asia Pacific
- 4.2.4 LATAM
- 4.2.5 MEA
- 4.3 Competitive analysis of major market players
- 4.4 Competitive positioning matrix
- 4.5 Key developments
- 4.5.1 Mergers & acquisitions
- 4.5.2 Partnerships & collaborations
- 4.5.3 New product launches
- 4.5.4 Expansion plans and funding
- 4.6 Company tier benchmarking
- 4.6.1 Tier classification criteria & qualifying thresholds
- 4.6.2 Tier positioning matrix by revenue, geography & innovation
Chapter 5 Market Estimates & Forecast, By Propulsion, 2022 - 2035 ($Mn, Thousand Units)
- 5.1 Key trends
- 5.2 Battery Electric Vehicle (BEV)
- 5.3 Plug-in Hybrid Electric Vehicle (PHEV)
- 5.4 Fuel Cell Electric Vehicles (FCEV)
- 5.5 Hybrid Electric Vehicle (HEV)
Chapter 6 Market Estimates & Forecast, By Drive Unit Configuration, 2022 - 2035 ($Mn, Thousand Units)
- 6.1 Key trends
- 6.2 Single-Motor Drive Units
- 6.3 Dual-Motor Drive Units
- 6.4 Multi-Motor Drive Units
Chapter 7 Market Estimates & Forecast, By Cooling Technology, 2022 - 2035 ($Mn, Thousand Units)
- 7.1 Key trends
- 7.2 Water glycol
- 7.3 Oil-based
- 7.4 Air Cooling
Chapter 8 Market Estimates & Forecast, By Vehicle, 2022 - 2035 ($Mn, Thousand Units)
- 8.1 Key trends
- 8.2 Passenger cars
- 8.2.1 Hatchback
- 8.2.2 Sedan
- 8.2.3 SUV
- 8.3 Commercial vehicles
- 8.3.1 Light Commercial Vehicles (LCV)
- 8.3.2 Medium Commercial Vehicles (MCV)
- 8.3.3 High Commercial Vehicles (HCV)
Chapter 9 Market Estimates & Forecast, By Region, 2022 - 2035 ($Mn, Thousand Units)
- 9.1 Key trends
- 9.2 North America
- 9.2.1 US
- 9.2.2 Canada
- 9.3 Europe
- 9.3.1 Germany
- 9.3.2 UK
- 9.3.3 France
- 9.3.4 Italy
- 9.3.5 Spain
- 9.3.6 Sweden
- 9.3.7 Czech Republic
- 9.3.8 Poland
- 9.4 Asia Pacific
- 9.4.1 China
- 9.4.2 Japan
- 9.4.3 South Korea
- 9.4.4 India
- 9.4.5 Australia
- 9.4.6 Singapore
- 9.4.7 Vietnam
- 9.4.8 Indonesia
- 9.4.9 Malaysia
- 9.5 Latin America
- 9.5.1 Brazil
- 9.5.2 Mexico
- 9.5.3 Argentina
- 9.5.4 Chile
- 9.6 MEA
- 9.6.1 South Africa
- 9.6.2 Saudi Arabia
- 9.6.3 UAE
Chapter 10 Company Profiles
- 10.1 Global players
- 10.1.1 BorgWarner
- 10.1.2 ZF Friedrichshafen
- 10.1.3 GKN Automotive
- 10.1.4 Dana
- 10.1.5 Continental
- 10.1.6 Linamar
- 10.1.7 Aisin
- 10.1.8 Magna
- 10.1.9 Schaeffler
- 10.1.10 Nidec
- 10.1.11 Valeo
- 10.1.12 Bosch
- 10.2 Regional players
- 10.2.1 BYD
- 10.2.2 Tesla
- 10.2.3 American Axle & Manufacturing (AAM)
- 10.2.4 JATCO
- 10.2.5 Marelli
- 10.3 Emerging players
- 10.3.1 Lucid Motors
- 10.3.2 Rivian Automotive
- 10.3.3 Protean Electric
